UDR: profit jumped 83% on property sales while revenue stood still
On July 27, UDR released its second-quarter 2026 results. Revenue remained flat year-on-year at $425.4 million, EBITDA rose 12.7% to $279.4 million, and net profit jumped 83.1% to $69.0 million. The profit increase was driven by a one-off gain of $35.7 million from property sales, not by operational improvements. Given stagnant revenue, high leverage, and no clear catalysts for acceleration, the stock appears neutral.
Key takeaways
— Revenue stalled at $425.4 million, marking a second consecutive slowdown in growth
— Profit rose 83.1% solely due to a one-off property sale of $35.7 million
— EBITDA margin climbed to 65.7% on lower depreciation, not on revenue growth
— Debt of $5.8 billion against EBITDA of $1.03 billion gives a 5.6x leverage – higher than a year ago
— The $0.435 dividend per share consumes nearly all AFFO, leaving little for growth
— Operating cash flow of $262.2 million for the quarter covers dividends, but capex is rising
Attractiveness
Key figures, USD bn
| Metric | Q2 2025 | Q2 2026 | Change |
|---|---|---|---|
| Revenue | 0.43 | 0.43 | -0.0% |
| EBITDA | 0.25 | 0.28 | +12.7% |
| Operating profit | 0.08 | 0.12 | +49.7% |
| Net profit | 0.04 | 0.07 | +83.1% |
| Operating cash flow | 0.25 | 0.26 | +4.7% |
| Capex | 0.00 | — | — |
| EBITDA margin | 58.3% | 65.7% | +7.4 pp |
| Net margin | 8.9% | 16.2% | +7.3 pp |
Revenue stalled at $425.4 million, marking a second consecutive slowdown in growth
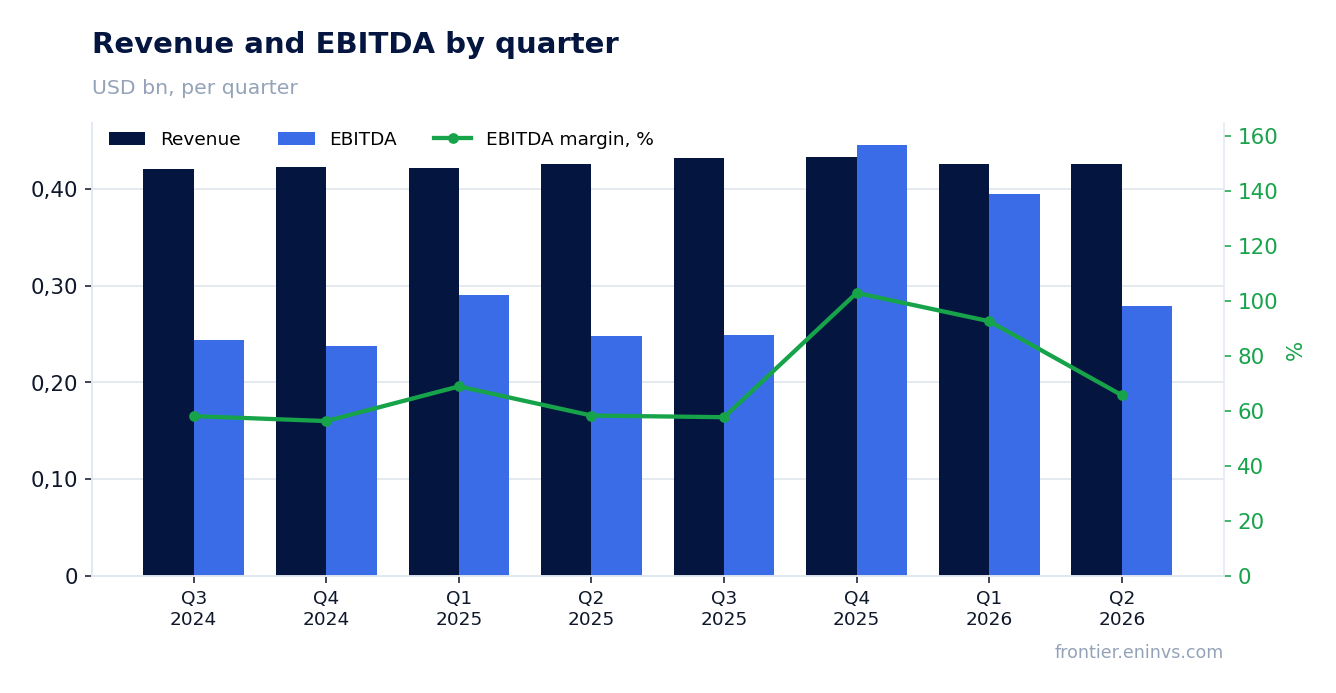
In the second quarter of 2026, UDR's revenue was $425.4 million, down 0.0% from a year earlier. This continues a slowdown: growth was 0.9% in Q1 and 2.5% in Q4 2025. The quarterly trend shows the company has essentially stopped growing its top line.
The main reason is stagnant rental income: rental revenue fell to $422.9 million from $423.0 million a year earlier. Growth in joint venture management fees ($2.5 million) did not offset the decline. Occupancy remains stable at 96.6%, but raising rates is proving difficult.
For the first half of 2026, revenue was $851.2 million versus $847.3 million a year earlier, a mere 0.5% increase. This confirms the slowdown is systemic, not a one-off. Without an acceleration in rental rates or occupancy, revenue is unlikely to break out of stagnation in the coming quarters.
Profit rose 83.1% solely due to a one-off property sale of $35.7 million
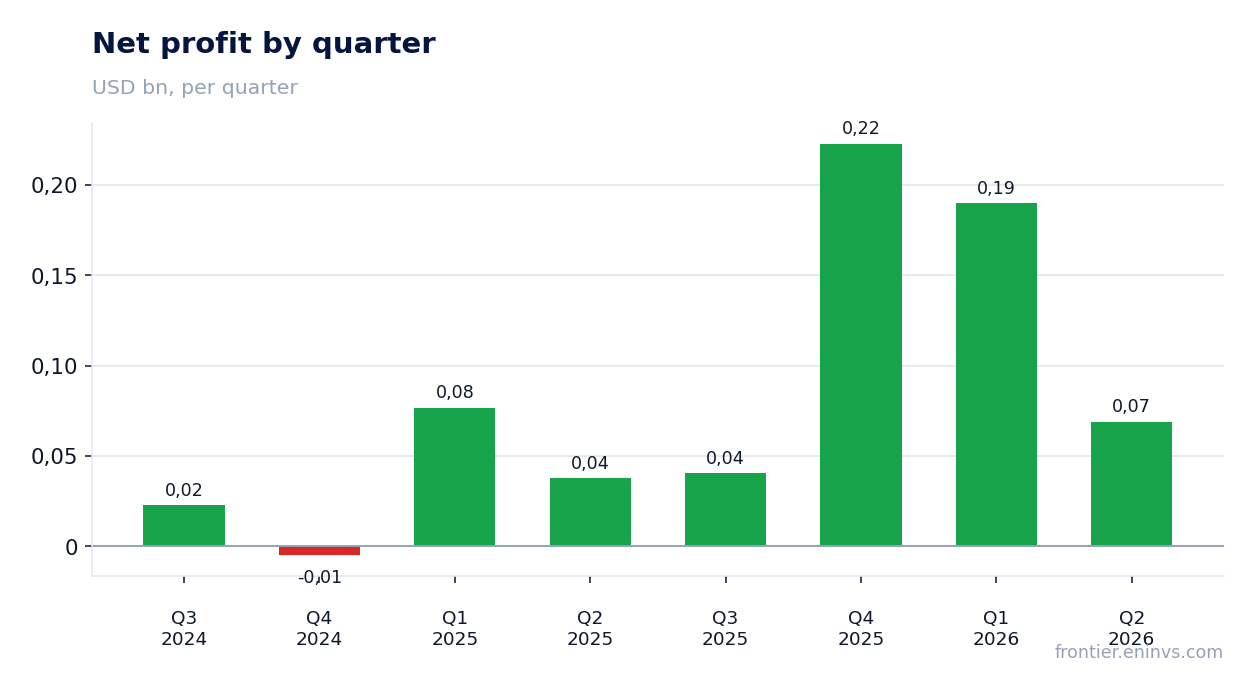
Net profit in Q2 2026 reached $69.0 million, up 83.1% year-on-year. However, this growth is entirely due to a one-off gain of $35.7 million from property sales recognised in the quarter. Without this one-off, profit would have been significantly lower.
Operating profit rose to $115.9 million from $77.4 million a year earlier, but again the property sale was the main contributor. Operating expenses fell by $2.8 million, mainly due to lower depreciation ($160.1 million vs. $163.2 million). This is not related to improved operational efficiency.
For the first half of 2026, net profit was $258.9 million versus $114.4 million a year earlier, but again a significant portion of the increase – $193.1 million – came from property sales. The sustainability of profit without one-off items is questionable.
EBITDA margin climbed to 65.7% on lower depreciation, not on revenue growth
EBITDA in Q2 2026 was $279.4 million, up 12.7% year-on-year. The EBITDA margin reached 65.7% versus 58.3% a year earlier. However, the margin improvement is not due to higher revenue – that remained flat.
The margin improvement came from lower operating expenses, particularly depreciation ($160.1 million vs. $163.2 million) and other operating expenses. The absence of certain one-off costs from a year ago also helped. This is not a sustainable factor.
For comparison, in Q1 2026 the EBITDA margin was even higher – around 92.6% ($394.4 million on revenue of $425.8 million) – but that was due to one-off items. The current 65.7% level may prove unsustainable if expenses normalise.
Debt of $5.8 billion against EBITDA of $1.03 billion gives a 5.6x leverage – higher than a year ago
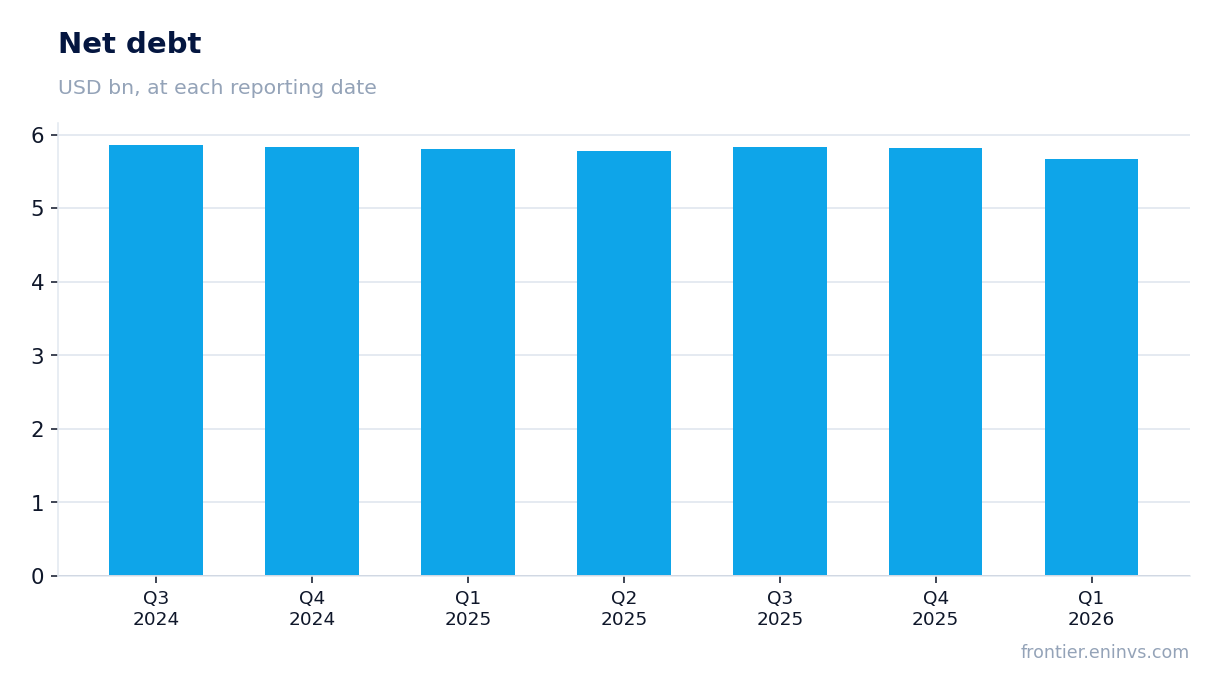
UDR's total debt at the end of Q2 2026 was $5.8 billion, with net debt also at $5.8 billion. The ratio of net debt to EBITDAre adjusted for non-recurring items is 5.6x versus 5.5x a year earlier. This is a moderate but rising leverage level.
Interest expense for the quarter was $47.6 million, down 2.1% year-on-year thanks to refinancing at lower rates. The average debt rate is 3.31%, with 88.1% of debt at fixed rates. This reduces the risk of higher payments if the key rate rises.
Operating cash flow for the quarter was $262.2 million, comfortably covering interest expense and dividends. However, capital expenditures are rising: $49.2 million for the half-year versus $47.6 million a year earlier. Leverage remains a key risk, especially if EBITDA starts to decline.
The $0.435 dividend per share consumes nearly all AFFO, leaving little for growth
For Q2 2026, UDR declared a dividend of $0.435 per share, up 1.2% from $0.43 a year earlier. The annual payout is thus $1.74 per share. At the current price, this gives a dividend yield of about 4.5% – in line with the company's historical levels.
Adjusted funds from operations (AFFO) per share for the quarter was $0.56, covering the dividend with a small margin. However, the payout ratio exceeds 77%, leaving little for growth and debt reduction. This is typical for a REIT but limits growth opportunities.
If operating performance deteriorates or capital expenditures rise, the dividend could be revised. The company maintains its full-year dividend guidance of $1.74, but the sustainability of the payout depends on its ability to keep AFFO at current levels.
Operating cash flow of $262.2 million for the quarter covers dividends, but capex is rising
Operating cash flow in Q2 2026 was $262.2 million, up 4.7% from $250.3 million a year earlier. This is a solid result that comfortably covers dividend payments (about $150 million per quarter) and interest expenses.
However, capital expenditures are rising: $49.2 million for the first half of 2026 versus $47.6 million a year earlier. These are mainly maintenance and improvement costs for existing assets. Rising capex could limit free cash flow in the future.
Free cash flow (after capex and dividends) remains positive but small. The company is also actively selling properties: proceeds from sales for the half-year were $193.1 million, which helped support liquidity. Without asset sales, free cash flow would be significantly lower.
Valuation on the latest reported figures
| Metric | Value |
|---|---|
| Operating cash flow (LTM) | 0.76 bn |
| ROE | 8.9% |
Bottom line
UDR's Q2 2026 report showed stagnant revenue and profit growth solely from a one-off property sale. Operational metrics – occupancy and rental rates – are not improving, and leverage remains high. The $0.435 dividend per share provides a yield of about 4.5%, but nearly all AFFO goes to payouts. At the current price, the stock appears neutral: upside is limited, and risks of lower profit without one-off items persist.
Open the company's financial profile UDR →
See also: market overview · valuation map · stock screeners