Hamkorbank: profit up 21.5%, but non-interest income is doing the accelerating
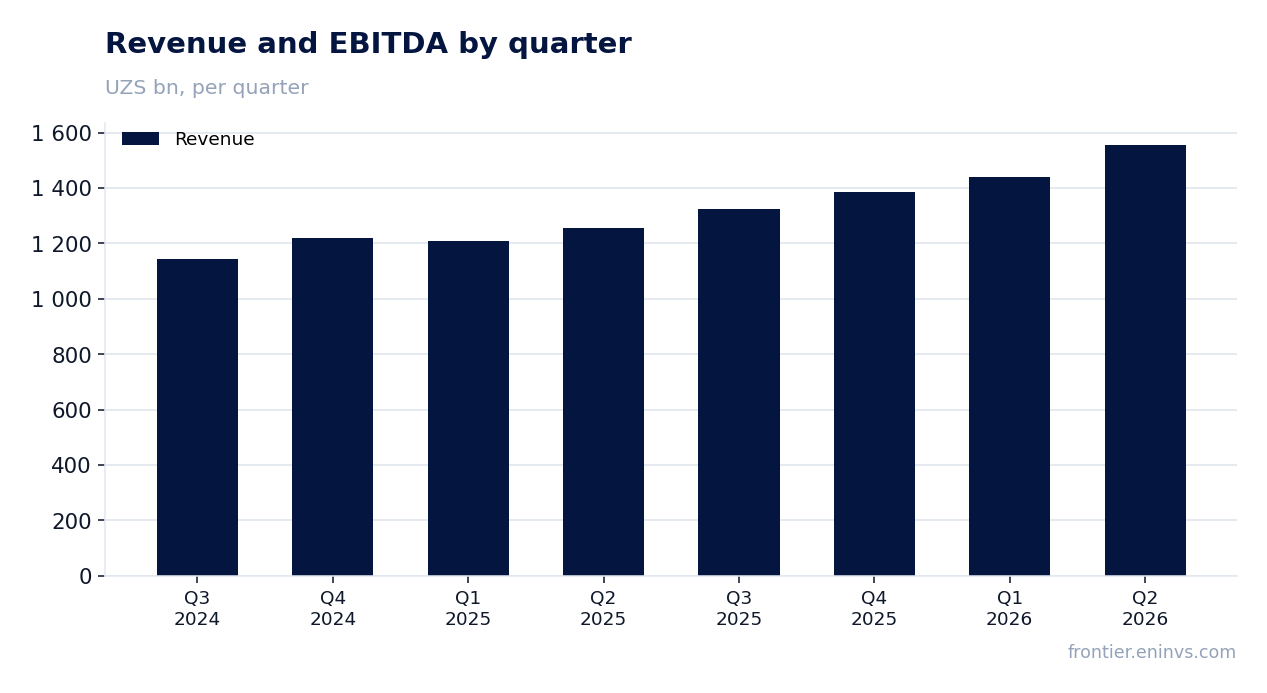
Hamkorbank has reported its Q2 2026 results: revenue reached UZS 1,556.2 bn, operating profit – UZS 599.0 bn, net profit – UZS 502.3 bn. Year on year, revenue added 23.8%, net profit – 21.5%, while the net margin stayed virtually flat at 32.3% versus 32.9%. With a P/E LTM of 4.56 and ROE of 27.1%, the share looks attractive, but the sustainability of this profit level hinges on how repeatable fee and other non-interest income prove to be.
Key takeaways
— Q2 revenue grew 23.8% year on year, the fastest quarterly pace in five quarters
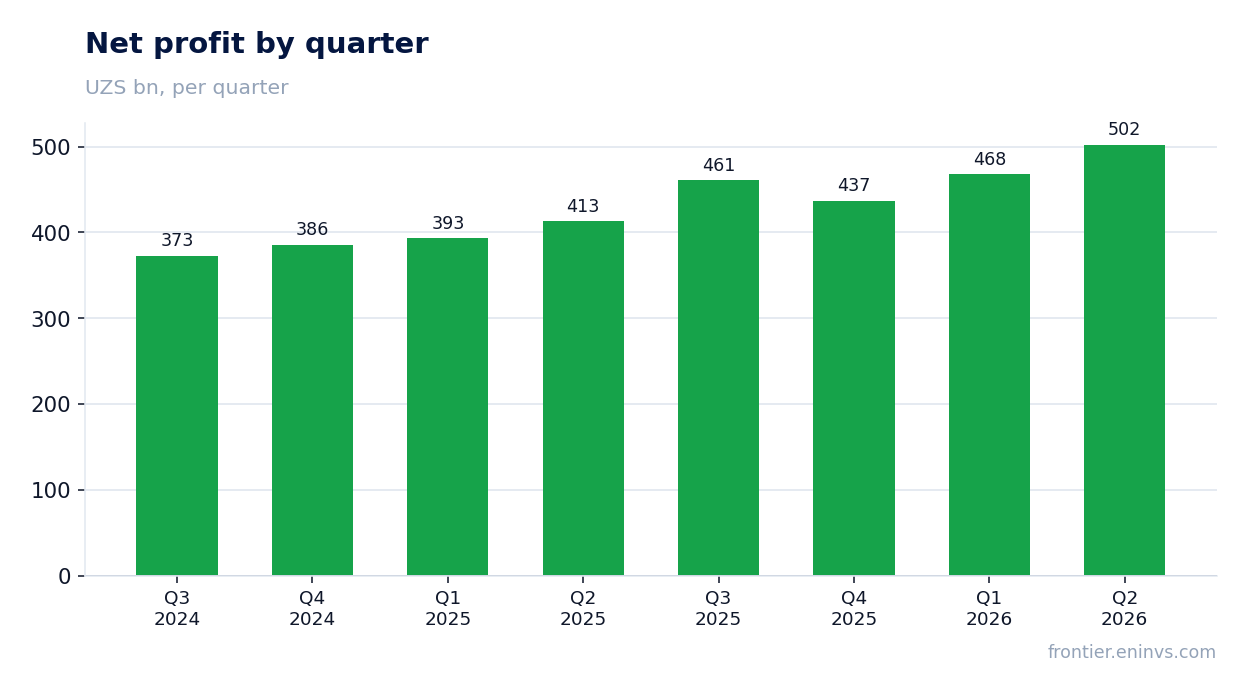
— Net profit added 21.5%, but the margin stayed almost flat – 32.3% versus 32.9% a year earlier
— Operating profit rose to UZS 599.0 bn, lifting its share of revenue to 38.5%
— Return on equity of 27.1% with a P/E LTM of 4.56 leaves room for a re-rating
— The trailing 12-month dividend yield is only 0.88%, below deposit rates
— On the portal's model, the share trades 24% below fair value derived from ROE and P/B
Attractiveness
Key figures, UZS bn
| Metric | Q2 2025 | Q2 2026 | Change |
|---|---|---|---|
| Revenue | 1 257 | 1 556 | +23.8% |
| Operating profit | — | 599 | — |
| Net profit | 413 | 502 | +21.5% |
| Net margin | 32.9% | 32.3% | -0.6 pp |
Q2 revenue grew 23.8% year on year, the fastest quarterly pace in five quarters
In Q2 2026, Hamkorbank's revenue reached UZS 1,556.2 bn, up 23.8% year on year. This is the highest quarterly growth rate in five quarters: Q1 2026 saw 19.2%, Q4 2025 – 13.7%, Q3 – 16.0%, Q2 2025 – 20.4%. The acceleration in Q2 breaks the deceleration trend observed since mid-2025.
The acceleration in Q2 revenue growth could be explained by a seasonal pickup in business activity as well as an increase in non-interest income. The source document – the bank's tariff schedule – reflects expanded commission rates on cards, transfers, and account servicing, which could have supported fee income. However, a detailed breakdown of revenue components is not disclosed, so the exact driver cannot be identified.
For the sustainability of this pace, it is important that growth is not one-off. If the acceleration stems from one-off fees or a seasonal factor, the growth rate could return to 15–20% next quarter. If it reflects organic expansion of the customer base and transaction activity, the current level may persist.
Net profit added 21.5%, but the margin stayed almost flat – 32.3% versus 32.9% a year earlier
Net profit in Q2 2026 was UZS 502.3 bn, up 21.5% year on year. The net margin remained virtually unchanged: 32.3% versus 32.9% in the same period last year. A 0.6 percentage point decline in the margin alongside 23.8% revenue growth means costs grew slightly faster than income, but not enough to materially impair profitability.
Operating profit rose to UZS 599.0 bn, and its share of revenue increased to 38.5%. This is higher than in Q4 2025, when operating profit was UZS 516.4 bn on revenue of UZS 1,385.2 bn, or 37.3% of revenue. The rise in operating margin indicates the bank is controlling operating expenses despite business expansion.
The ratio of net to operating profit in Q2 was 83.9%, pointing to a moderate tax burden and no large one-off write-offs. If operating efficiency persists, net profit can grow at rates similar to revenue, provided the cost of risk remains stable.
Operating profit rose to UZS 599.0 bn, lifting its share of revenue to 38.5%
Operating profit in Q2 2026 reached UZS 599.0 bn, up 16.0% from Q4 2025, when it was UZS 516.4 bn. The growth in operating profit, combined with a higher revenue growth rate, pushed the operating margin up to 38.5% from 37.3% in the previous quarter.
The rise in operating margin may be due to economies of scale: the bank is expanding its operations while fixed costs grow more slowly. In addition, the source document indicates the bank charges fees for card servicing, transfers, and other services, which boosts fee income without a proportional increase in costs. This supports operating efficiency.
However, the sustainability of the operating margin at 38.5% is questionable. If revenue growth is largely driven by one-off fees rather than recurring flows, the margin could revert to 37% or lower. In the next report, it is worth watching the dynamics of operating expenses and the revenue structure.
Return on equity of 27.1% with a P/E LTM of 4.56 leaves room for a re-rating
Hamkorbank's return on equity is 27.1%, well above the cost of equity for the Uzbek banking sector. At the same time, the share trades at a P/E LTM of 4.56, implying a high return on invested capital for the investor. The combination of high ROE and low P/E typically signals undervaluation if earnings are sustainable.
On the portal's model, which compares ROE with P/B, the fair value of the share is 24% above the current market price. This is our own estimate, not a market consensus. It rests on the assumption that the current profit level persists and that the market will eventually re-rate the bank closer to its return on capital.
The bank's market capitalisation is UZS 8,518.4 bn. With net profit of UZS 1,868.1 bn over the trailing twelve months and revenue of UZS 2,783.3 bn over the same period, the bank appears undervalued relative to its ability to generate profit. However, a trigger is needed to realise the re-rating potential – for example, sustained profit growth over several quarters or an increase in dividend payouts.
The trailing 12-month dividend yield is only 0.88%, below deposit rates
Hamkorbank's dividend yield over the trailing 12 months is 0.88%. This is significantly below bank deposit rates in Uzbekistan, where rates on local currency deposits typically exceed 15%. For an income-oriented investor, the share does not look attractive.
The low dividend yield may be explained by the bank directing most of its profit into business development and capital maintenance. With ROE of 27.1% and a growing loan portfolio, the bank is better off reinvesting profit than paying it out to shareholders. However, the lack of generous dividends reduces the appeal of the share for conservative investors.
In the future, the dividend policy may change if the bank reaches its target capital adequacy level. But there are no specific statements about increasing payouts in the source document. For the dividend yield to rise, either profit must grow, the payout ratio must increase, or the share price must fall.
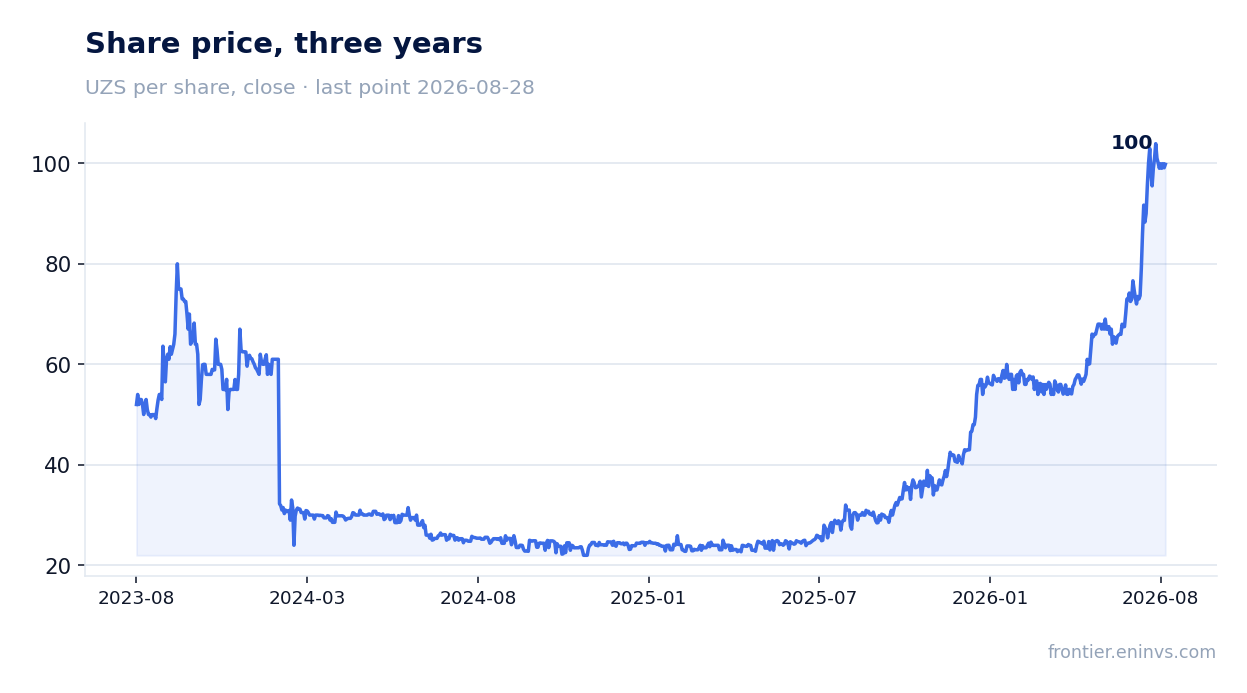
On the portal's model, the share trades 24% below fair value derived from ROE and P/B
Our model, which compares return on equity with the price-to-book ratio, indicates a 24% upside to fair value. This is not a consensus forecast or a target price, but the result of a calculation based on the bank's current financials. The model assumes the market will eventually value the bank closer to its return on capital.
A catalyst is needed to realise this potential. Such a catalyst could be the publication of sustained quarterly results, an increase in dividends, or a general improvement in Uzbekistan's investment climate. Without a catalyst, the share may remain undervalued for a long time.
It is worth noting that the model is sensitive to assumptions about earnings sustainability. If the trailing twelve-month net profit of UZS 1,868.1 bn turns out to be inflated by one-off factors, the fair value could be lower. Therefore, it is important to monitor earnings quality and the repeatability of income.
Valuation on the latest reported figures
| Metric | Value |
|---|---|
| Market cap | 8 518 bn UZS |
| P/E (LTM) | 4.6 |
| P/B | 1.11 |
| ROE | 27.1% |
| Dividend yield (12m) | 0.9% |
Bottom line
Hamkorbank delivered a strong quarter: revenue grew 23.8%, net profit – 21.5%, and the operating margin rose to 38.5%. However, the sustainability of these results is questionable, as there is no detailed income breakdown, and the low dividend yield of 0.88% does not compensate for the risks. With a P/E LTM of 4.56 and ROE of 27.1%, the share looks undervalued, and our model points to 24% upside. A catalyst is needed to realise this potential – sustained profit growth or higher dividends. Until such a catalyst appears, the share remains attractive for investors willing to tolerate low current payouts in exchange for long-term growth.
Open the company's financial profile HAMKOR →
See also: market overview · valuation map · stock screeners