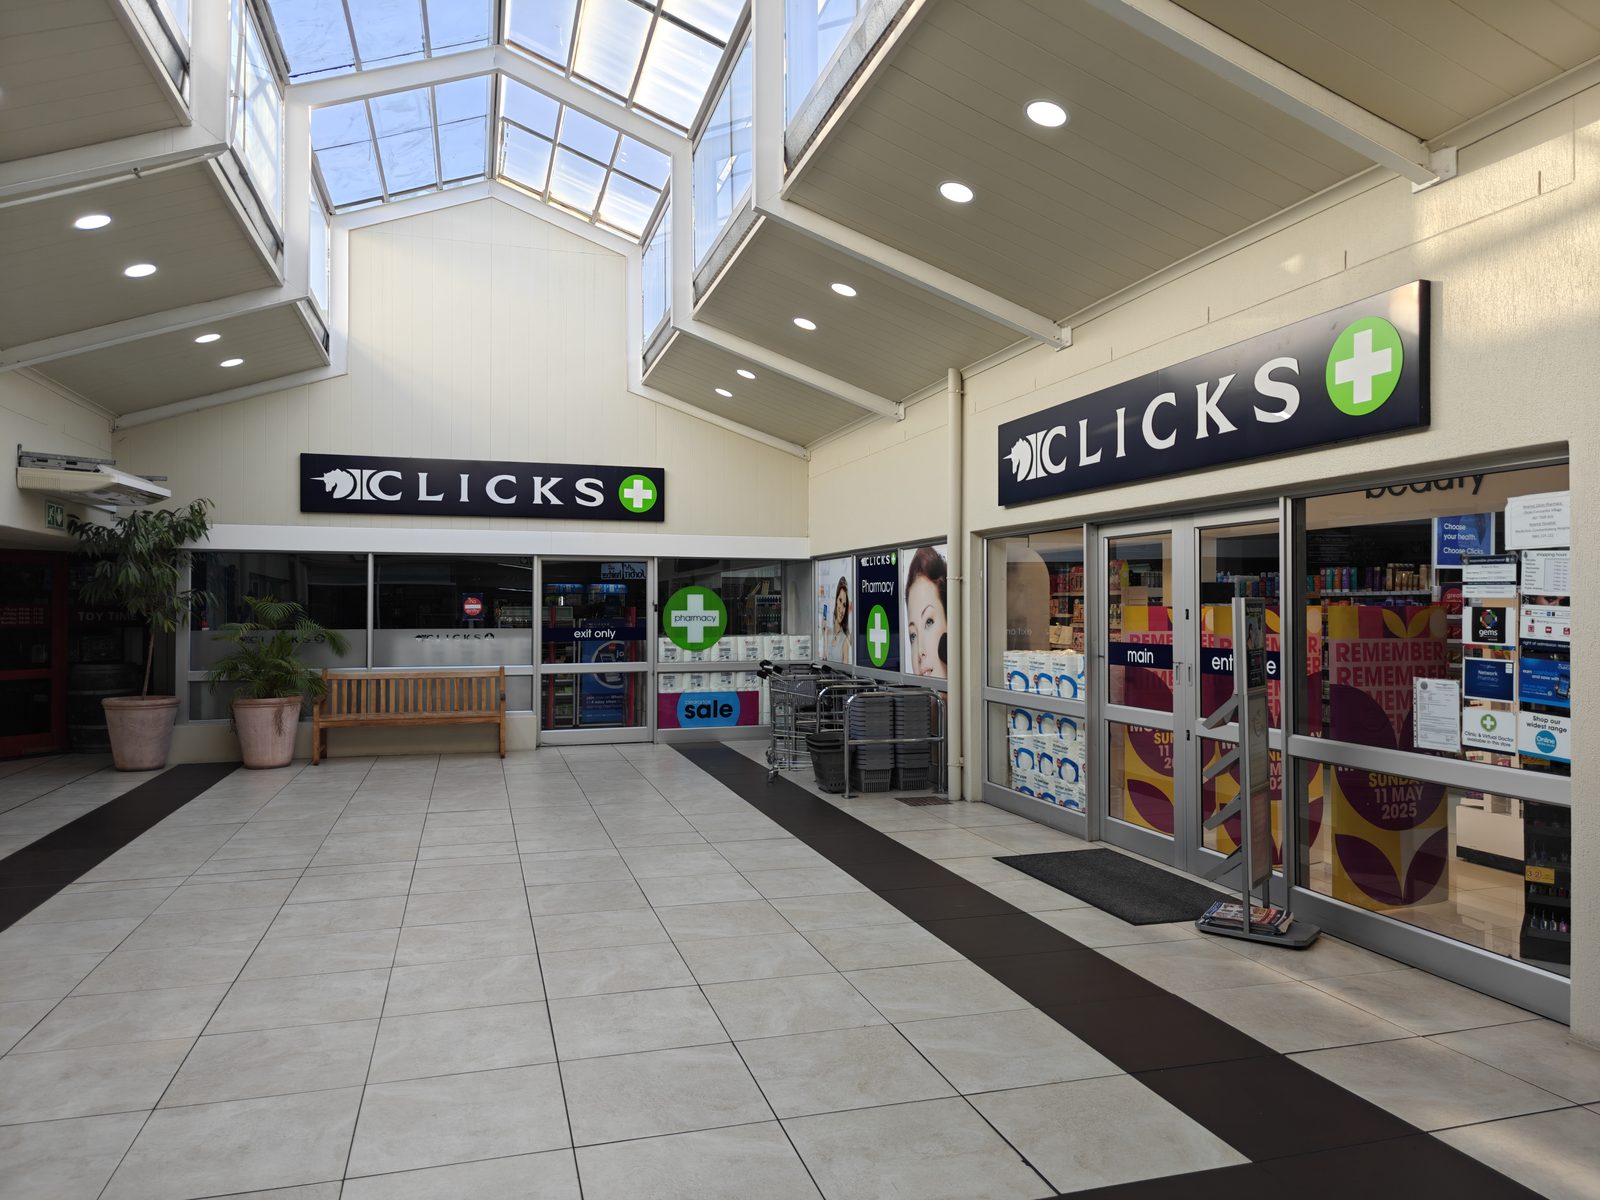
– Operates health and beauty stores and retail pharmacies, mainly in South Africa. Clicks and UniCare serve pharmacy customers, while Clicks stores also sell beauty and personal care products. The UPD wholesale business supplies the group’s pharmacies, independent pharmacies and private hospital groups.
– Operates health and beauty stores and retail pharmacies, mainly in South Africa. Clicks and UniCare serve pharmacy customers, while Clicks stores also sell beauty and personal care products. The UPD wholesale business supplies the group’s pharmacies, independent pharmacies and private hospital groups.– Sells medicines, beauty products and personal care goods through Clicks stores and pharmacies. Its retail business also includes UniCare pharmacies. The UPD wholesale business supplies medicines to the group’s pharmacies, independent pharmacies and private hospitals in South Africa.– Sells medicines, cosmetics and personal care products through Clicks stores and pharmacies in South Africa. UniCare runs specialist pharmacies. The group's UPD division supplies medicines to retail pharmacies and private hospitals.– Runs Clicks health and beauty stores and pharmacies in South Africa. It also operates specialist UniCare pharmacies and distributes medicines to pharmacies and private hospitals through UPD.– Sells medicines, beauty products and personal care goods through Clicks stores and pharmacies. Its UPD business supplies pharmacies and hospitals.– Runs Clicks pharmacies and stores and distributes medicines to pharmacies and private hospitals through UPD.
Net debt (table and EV/EBITDA): |short-term borrowings| + |long-term borrowings| + |other financial liabilities| when extracted + |non-controlling interest| when extracted − |cash and equivalents|; amounts in millions of the reporting currency.
Amounts:USD (converted) · As reported Converted modes use NBK / ECB-linked rates: balance sheet date for BS items, period average for P&L and cash flow (see filing row evidence). As reported keeps each row in its filing currency.
Financial results
Monetary columns are in B ZAR, one decimal; scale (K/M/B/T) keeps values readable. For the period (default) shows P&L and cash flow for that row’s reporting window: quarterly amounts when the feed uses quarter-duration facts (typical US 10-Q revenue and income), quarterly cash flows after stripping YTD where only cumulative tags exist, and an implied Q4 on 31 Dec FY rows (P&L: FY minus Q1–Q3; operating / investing cash flow: FY 12m minus 9M YTD to 30 Sep when sourced from SEC builder evidence) so they match 10-Q scale. Some issuers still use cumulative YTD minus the prior row in the same calendar year. As reported shows values stored on each row (e.g. full-year on FY). Balance sheet is always as reported. Source JSON may use millions etc.; conversion uses amounts_unit per row.
Net debt structure (leases included, IFRS 16) 2026-08-31
Debt (loans, bonds and leases)
4 489
− Cash & equivalents
2 301
Net debt
2 188
Net debt / LTM EBITDA: 0.3x
Revenue & EBITDA
RevenueEBITDA
Half-year values (ZAR mln)
Year-over-year change
Cash flow
Operating and investing cash flow (OCF + ICF) (ZAR mln)
Net debt / cash (ZAR mln)
Profit and cash
Worth a look
In a typical year of 2022–2026 operating cash flow came to 1.30x of reported net profit; after capex, 0.94x.
year
2022
2023
2024
2025
2026
cash flow / profit
0.73x
1.30x
1.06x
1.62x
1.45x
accruals, % of assets
4.0%
-4.1%
-0.8%
-8.9%
-6.2%
Last twelve months (to 2026-08-31): 1.45x of profit came back as operating cash flow.
net debt / EBITDA 0.3x · capex 0.6x of depreciation
● Capex is 57% of depreciation - the asset base is being consumed faster than replaced.
Read from the reported annual statements: cash flow / profit is the median of the yearly operating cash flow over net profit for the years shown; accruals are (profit − operating cash flow) / assets, the classic gap between what was booked and what was collected. A gap can be growth in working capital, capitalised costs, revaluations or profit from associates — the panel points at it, the statements explain it. Not investment advice.
Research & reviews
Our earnings breakdowns and investment notes on this issuer.
The growth-acceleration signal behind the GARP+acceleration strategy — it favours companies whose revenue growth is speeding up and flags those slowing down (the second derivative of growth).
Dividends
Trailing 12 months
Dividend yield
–
Paid per share
–
Forward dividends
No confirmed data
Paid (completed)
Date
Per share
Details
Status
Source
2026-07-01
258 ZAR
Ex-dividend: 258 ZAR per share
Paid
Yahoo Finance (ex-div)
2026-01-21
648 ZAR
Ex-dividend: 648 ZAR per share
Paid
Yahoo Finance (ex-div)
2025-07-02
238 ZAR
Ex-dividend: 238 ZAR per share
Paid
Yahoo Finance (ex-div)
2025-01-22
566 ZAR
Ex-dividend: 566 ZAR per share
Paid
Yahoo Finance (ex-div)
2024-06-26
210 ZAR
Ex-dividend: 210 ZAR per share
Paid
Yahoo Finance (ex-div)
2024-01-24
494 ZAR
Ex-dividend: 494 ZAR per share
Paid
Yahoo Finance (ex-div)
2023-06-28
185 ZAR
Ex-dividend: 185 ZAR per share
Paid
Yahoo Finance (ex-div)
2023-01-25
457 ZAR
Ex-dividend: 457 ZAR per share
Paid
Yahoo Finance (ex-div)
2022-06-29
180 ZAR
Ex-dividend: 180 ZAR per share
Paid
Yahoo Finance (ex-div)
2022-01-26
347.5 ZAR
Ex-dividend: 347.5 ZAR per share
Paid
Yahoo Finance (ex-div)
KASE: status follows wording in the news headline (paid vs intends to pay). Yahoo: amounts are cash dividends per share on ex-dividend dates (UTC calendar date). stockscope.uz (UZ): amounts are per share in UZS by publication date (not necessarily ex-div).
P/E and EV/EBITDA use LTM from up to four quarter rows when they look comparable (incl. Q2/Q4); if the feed is only Q1 and Q3, we use latest FY profit/EBITDA instead of summing them. P/B is market cap ÷ latest FY equity. Hover multiples for the exact formula. Financial rows: year(period_end) ≥ max(2023, current calendar year − 2) (hide older).