Cosan: revenue up 12.9%, but quarterly profit almost entirely eaten by one-off write-downs
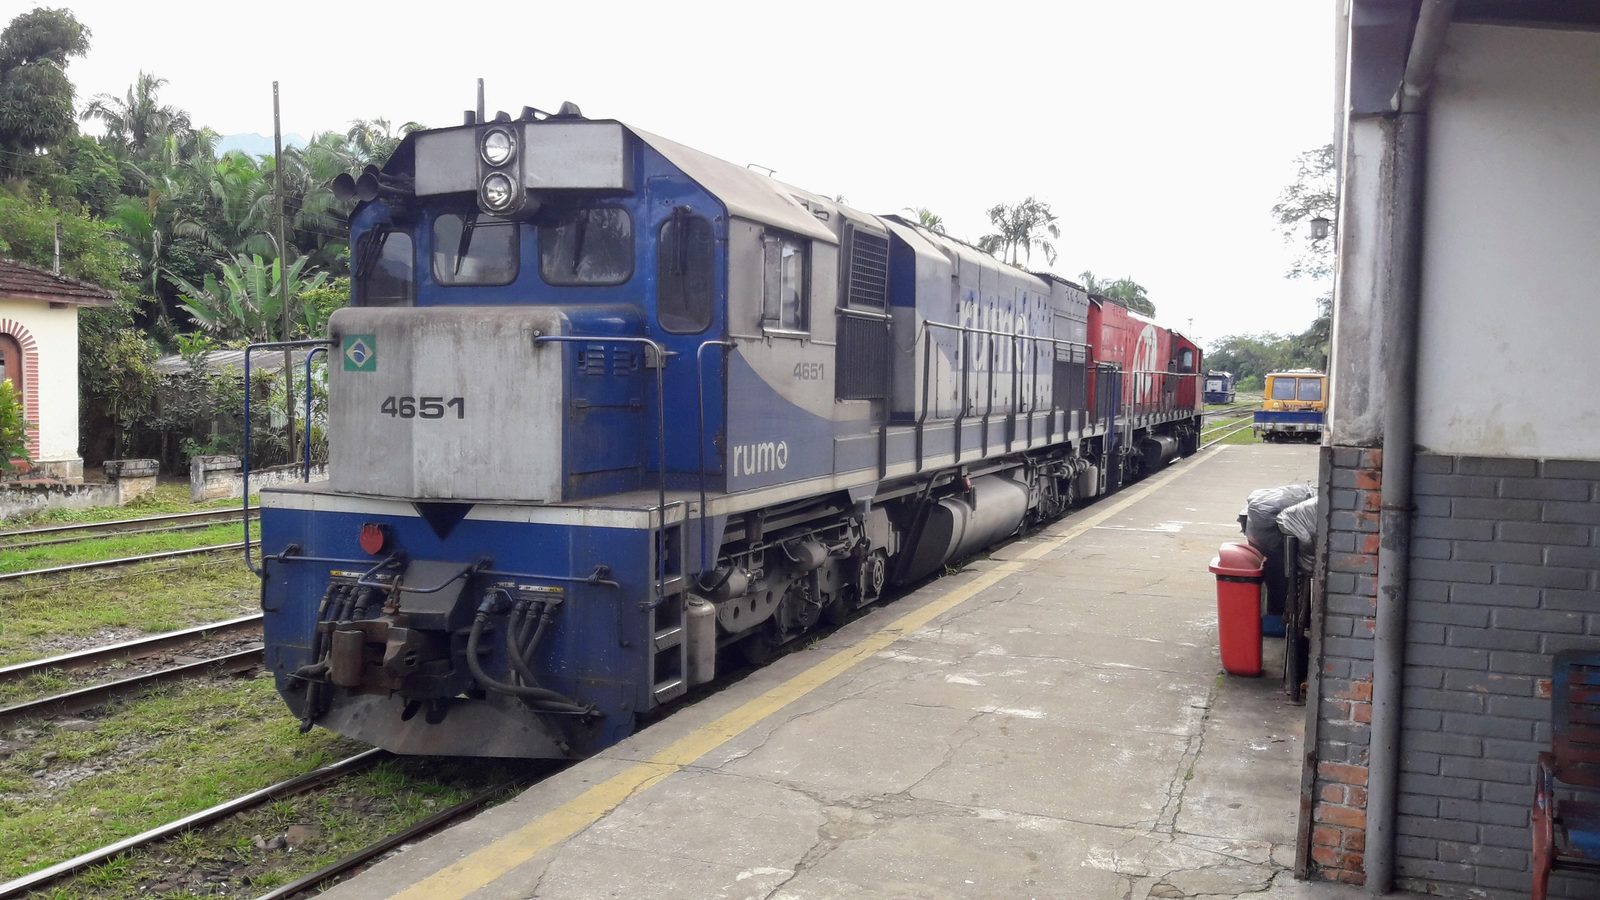
Cosan reported second-quarter 2026 results. Revenue rose 12.9% year on year to USD 2,122.0 million, EBITDA added 36.6% to reach 693.3 million, while net profit was only 36.8 million at a 1.7% margin. Leverage stands at 3.78 times trailing twelve-month EBITDA, and on the portal's model the share trades at half its fair value. Given the weak base a year earlier and the one-off loss in the fourth quarter of 2025, the stock looks rather attractive rather than neutral.
Key takeaways
— Revenue rose 12.9% year on year – the best quarterly growth in two years
— EBITDA added 36.6%, but its level is still below the four-quarter average
— Net profit of 36.8 million was almost entirely eaten by one-off write-downs
— Operating cash flow of 680.4 million covers capital expenditure of 414.4 million
— Net debt of 9,360.2 million equals 3.78 times trailing twelve-month EBITDA
— On the portal's model the upside to fair value is +100%
Attractiveness
Key figures, USD bn
| Metric | Q2 2025 | Q2 2026 | Change |
|---|---|---|---|
| Revenue | 1.88 | 2.12 | +12.9% |
| EBITDA | 0.51 | 0.69 | +36.6% |
| Operating profit | 0.33 | 0.50 | +50.9% |
| Net profit | -0.10 | 0.04 | в прибыль |
| Operating cash flow | 0.70 | 0.68 | -3.4% |
| Capex | 0.35 | 0.41 | +20.0% |
| EBITDA margin | 27.0% | 32.7% | +5.7 pp |
| Net margin | -5.4% | 1.7% | +7.1 pp |
Revenue rose 12.9% year on year – the best quarterly growth in two years
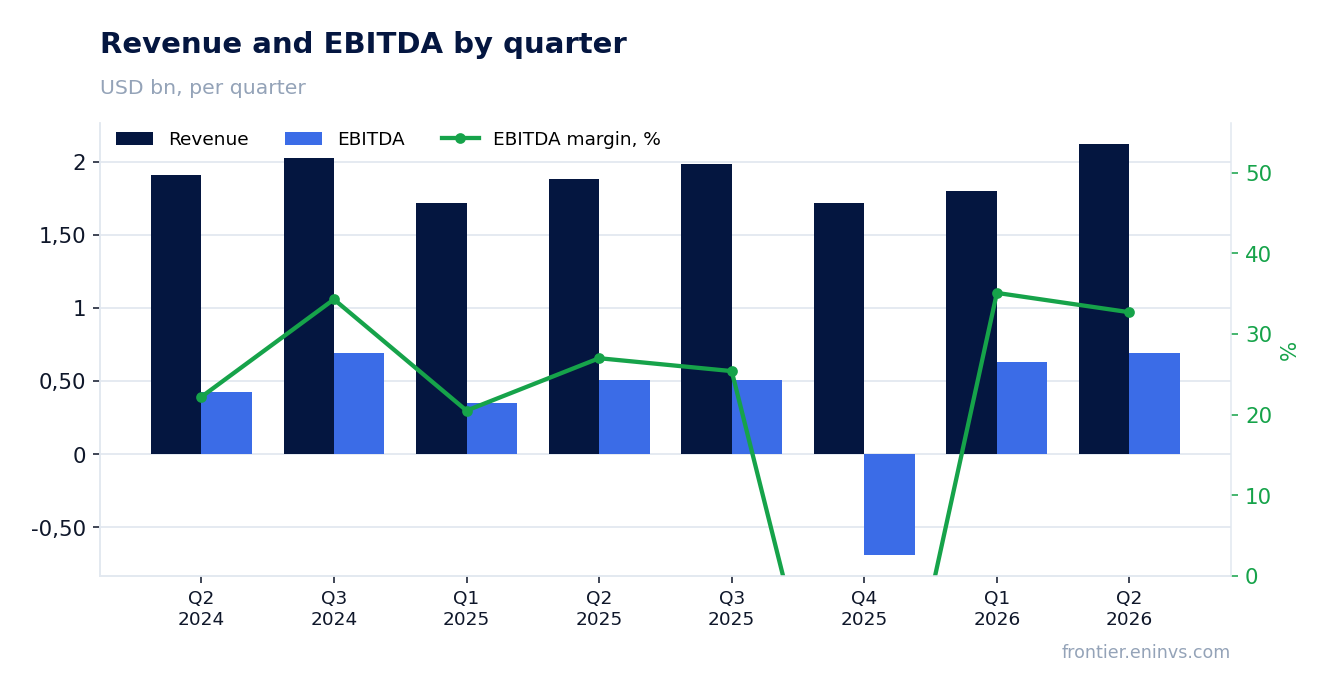
In the second quarter of 2026, Cosan's revenue reached USD 2,122.0 million, up 12.9% year on year. This is the fastest quarterly growth in two years: in the first quarter of 2026 revenue added 4.7%, while in the fourth quarter of 2025 it declined. The acceleration follows a weak second quarter of 2025, when revenue contracted 1.4%.
The revenue increase relies on recovering demand in key segments, although the report does not provide a breakdown by division. Importantly, quarterly revenue exceeded the second-quarter 2024 level (1,905.9 million) and became the highest in at least eight quarters.
For further growth, the current momentum needs to hold in the third quarter, which is traditionally stronger than the second. If revenue stays above 2,000 million, the annual figure could exceed 8,000 million, well above the 7,600 million of the trailing twelve months.
EBITDA added 36.6%, but its level is still below the four-quarter average
EBITDA in the second quarter of 2026 rose 36.6% year on year to USD 693.3 million, and the EBITDA margin climbed to 32.7% from 27.0% a year earlier. This margin expansion is primarily due to the low base effect: in the second quarter of 2025, EBITDA was 507.5 million at a 27.0% margin.
Despite strong annual growth, quarterly EBITDA is still below the average of the last four quarters. For comparison: in the third quarter of 2025 EBITDA was 504.3 million, in the fourth quarter of 2025 the company posted negative EBITDA of minus 690.5 million, and in the first quarter of 2026 – 631.2 million. The average over these four quarters is about 284.6 million, and the current 693.3 million is well above it, but this advantage is driven by the disastrous fourth quarter.
Sustaining the margin above 30% is a key question for investors. If EBITDA holds above 600 million in the next quarter, the annual figure could exceed 2,200 million, providing additional momentum to reduce debt.
Net profit of 36.8 million was almost entirely eaten by one-off write-downs
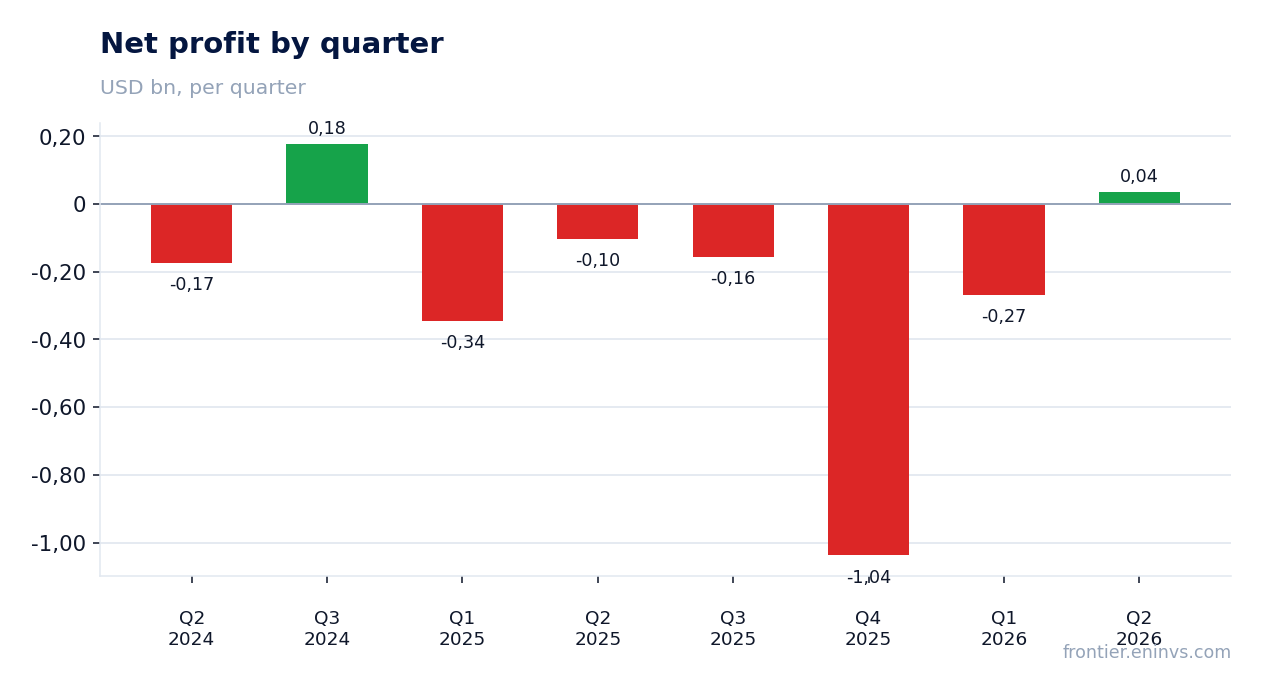
Net profit in the second quarter of 2026 was USD 36.8 million at a 1.7% margin. A year earlier there was a loss of 101.9 million, so formally the company returned to profit, but the absolute level remains extremely low relative to revenue and EBITDA.
The gap between EBITDA of 693.3 million and net profit of 36.8 million is explained by high debt burden and one-off write-downs. In the fourth quarter of 2025 the company already reported a loss of 1,037.3 million, indicating ongoing asset write-downs or impairments. Without these one-off factors, profit could have been substantially higher.
For investors, it is important that operating profit in the second quarter of 2026 was 497.1 million – higher than 329.6 million a year earlier, but still below the third-quarter 2024 level of 507.1 million. Thus, core operations are recovering, but are still far from peak values.
Operating cash flow of 680.4 million covers capital expenditure of 414.4 million
Operating cash flow in the second quarter of 2026 was USD 680.4 million, down 3.4% from 704.6 million a year earlier. Despite the slight decline, the flow remains stable and comfortably covers capital expenditure, which in the reporting quarter was 414.4 million.
Free cash flow therefore remains positive at around 266 million. This is important for debt servicing: net debt at the end of the quarter was 9,360.2 million, and the company allocates part of the flow to service it.
Capital expenditure increased relative to the second quarter of 2025 (345.3 million), but remains below the first-quarter 2026 level (458.0 million). The company continues to invest, but not at the expense of cash flow.
Net debt of 9,360.2 million equals 3.78 times trailing twelve-month EBITDA
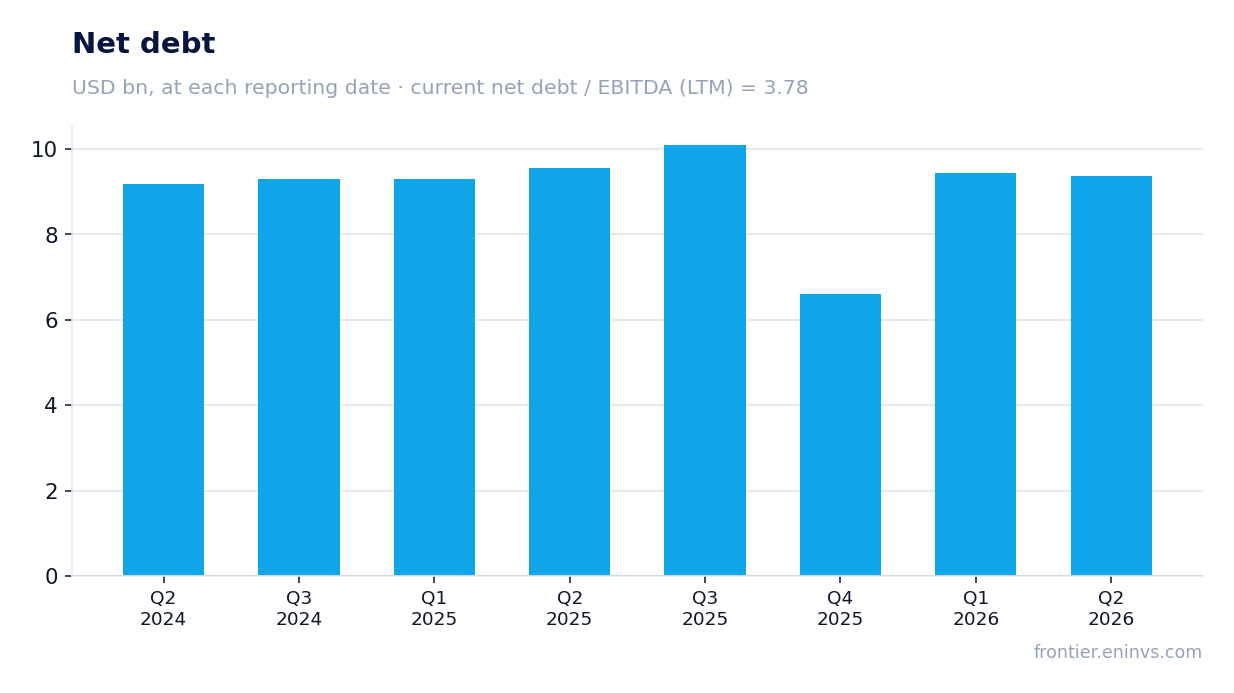
Cosan's net debt at the end of the second quarter of 2026 was USD 9,360.2 million, equivalent to 3.78 times trailing twelve-month EBITDA. This is a moderate level for a company with EBITDA of about 2,094 million, but it limits room for additional borrowing.
Over the past 12 months net debt decreased by 0.2 billion rubles, and versus the previous reporting date – by 0.1 billion rubles. This is a small reduction, but it shows the company is not increasing debt.
The trailing twelve-month EV/EBITDA multiple is 4.65 – a low multiple that reflects both the debt burden and the market valuation. With a market capitalisation of 1,805 million and EV of about 11,129 million (capitalisation plus net debt), the company trades at a discount to historical levels.
On the portal's model the upside to fair value is +100%
According to the portal's model, Cosan's fair value per share is twice the current market price. The upside is estimated at +100%, making the stock one of the most undervalued in our coverage.
The model incorporates EBITDA growth and a target multiple. With the current EV/EBITDA of 4.65 and a market capitalisation of 1,805 million, even a moderate recovery in EBITDA to 2,500 million could lead to a significant re-rating.
However, the model does not account for risks related to one-off write-downs and high debt burden. If the company continues to incur impairment losses, fair value could be lower.
Valuation on the latest reported figures
| Metric | Value |
|---|---|
| Market cap | 1.80 bn USD |
| EV/EBITDA (LTM) | 4.6 |
| P/B | 0.32 |
| Net debt / EBITDA (LTM) | 3.78 |
| Operating cash flow (LTM) | 2.40 bn |
| ROE | 2.4% |
Bottom line
In the second quarter of 2026 Cosan delivered strong revenue growth of 12.9% and EBITDA growth of 36.6%, but net profit remained symbolic due to one-off write-downs. Operating cash flow of 680.4 million covers capital expenditure, and leverage at 3.78 times EBITDA looks manageable. The key question for a holder is whether the company can avoid new write-downs and keep the margin above 30%. At the current EV/EBITDA of 4.65 and with +100% upside on the portal's model, the stock deserves a 'rather attractive' status, but only if one-off losses do not recur.
Open the company's financial profile CSAN →
See also: market overview · valuation map · stock screeners