Nu Holdings: net profit up 66.5%, but shares are expensive — portal model upside only +1%

On August 25, Nu Holdings reported Q2 2026 results: net profit rose 66.5% YoY to $189.5 million, and net interest income grew 50.2% to $673.8 million. At the current price, the shares look rather attractive: growth continues, but valuation already prices in much, and the portal model upside is only +1%.
Key takeaways
— Net profit in Q2 rose 66.5% YoY to $189.5 million, driven by a 50.2% increase in net interest income
— Net interest income for the trailing twelve months reached $2,400.0 million, reflecting sustained expansion of the loan portfolio
— Return on equity (ROE) for the trailing twelve months was 32.8%, indicating high efficiency in capital utilization
— Shares trade at a P/E of 114.7 for the trailing twelve months, significantly above the three-year average if it were known
— According to the portal model, the upside potential of the shares is only +1% from the current price, indicating fair valuation
— Capital expenditures in Q2 decreased to $4.5 million, contributing to net profit growth
— No dividends are paid, as the company reinvests profits in business expansion
Attractiveness
Key figures, USD bn
| Metric | Q2 2025 | Q2 2026 | Change |
|---|---|---|---|
| Net profit | 0.11 | 0.19 | +66.5% |
| Capex | 0.01 | 0.00 | -64.2% |
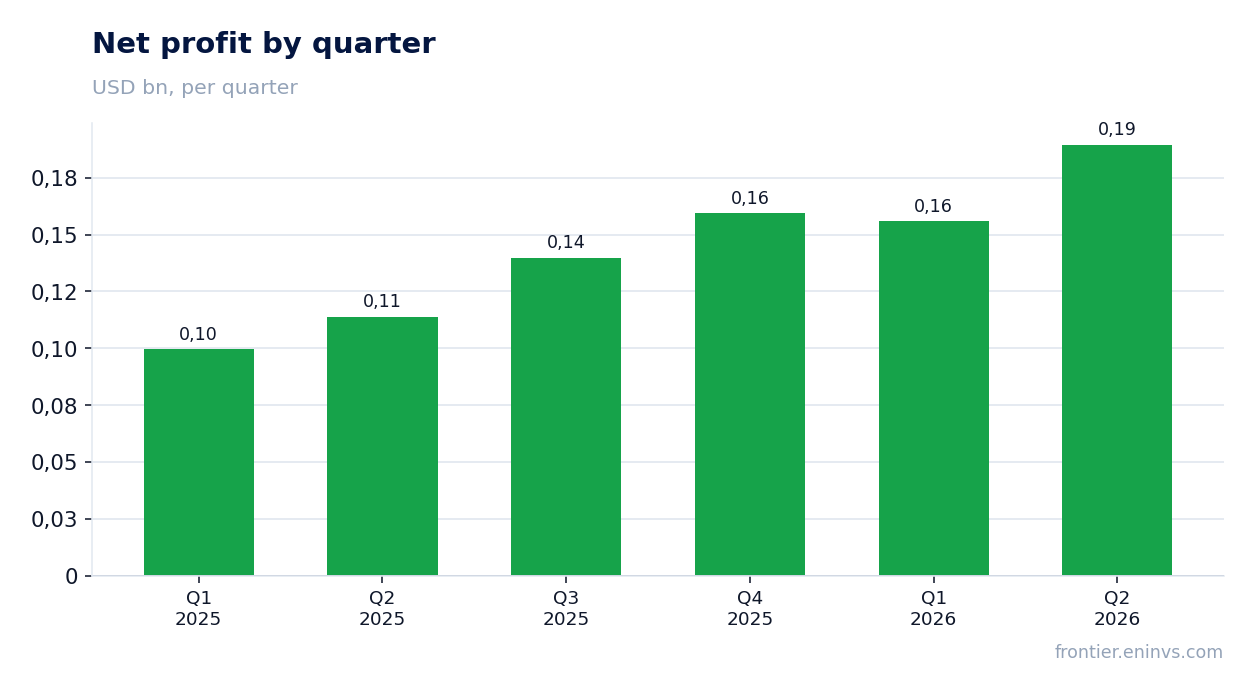
Net profit in Q2 rose 66.5% YoY to $189.5 million, driven by a 50.2% increase in net interest income
In Q2 2026, Nu Holdings' net profit amounted to $189.5 million, up 66.5% from the same quarter a year earlier. The main driver was net interest income, which grew 50.2% to $673.8 million.
The growth in interest income reflects the expansion of the loan portfolio and a growing customer base. The company continues to scale its business, directly converting into profit.
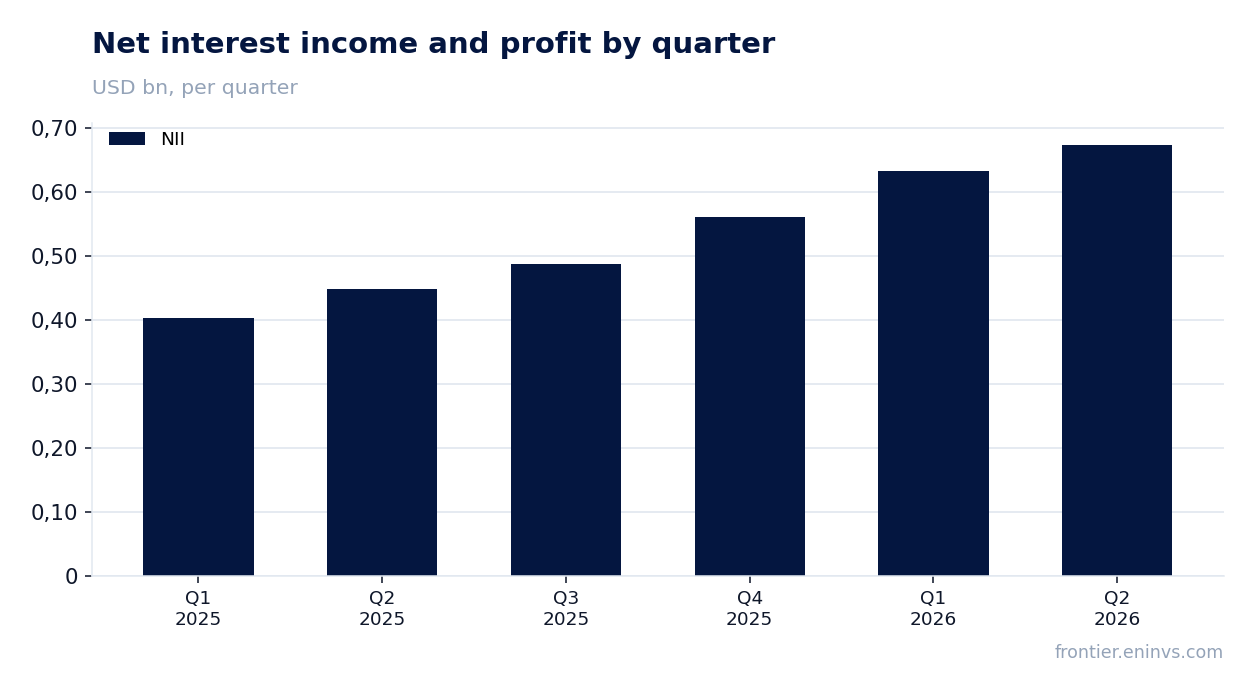
Net interest income for the trailing twelve months reached $2,400.0 million, reflecting sustained expansion of the loan portfolio
For the trailing twelve months, net interest income amounted to $2,400.0 million. This is the sum of four quarters ending in June 2026, and it shows a steady upward trend: quarterly figures rose from $402.3 million in Q1 2025 to $673.8 million in Q2 2026.
This dynamic indicates that the bank is successfully growing interest income faster than funding costs, which is a key driver of profit growth.
Return on equity (ROE) for the trailing twelve months was 32.8%, indicating high efficiency in capital utilization
ROE for the trailing twelve months reached 32.8%. This is a high figure, especially for the banking sector, and it confirms that the company efficiently uses its equity to generate profit.
High return on equity supports internal growth without the need to raise expensive external capital, which is important for stock valuation.
Shares trade at a P/E of 114.7 for the trailing twelve months, significantly above the three-year average if it were known
The current P/E multiple is 114.7 based on trailing twelve-month earnings. This is a very high valuation, implying that the market expects continued rapid profit growth in the future.
Comparison with its own history is difficult as the three-year average P/E is not disclosed in the facts, but the current level is clearly above typical values for fast-growing banks.
According to the portal model, the upside potential of the shares is only +1% from the current price, indicating fair valuation
Our portal model, based on the ratio of annualized earnings to market cap and ROE to P/B, shows that the shares have an upside potential of only +1% from the current price. This means the market has already priced in the company's future prospects.
The model is not a market consensus or a target price, but it serves as a guide for us. With such a small upside, investors should rely mainly on further business growth rather than on stock re-rating.
Capital expenditures in Q2 decreased to $4.5 million, contributing to net profit growth
In Q2 2026, capital expenditures amounted to only $4.5 million, significantly lower than in previous quarters (e.g., $13.5 million in Q1 2026). This reduction eased the burden on profit.
Low capital expenditures are typical for banks with a digital model that do not need to invest in physical infrastructure. This allows a larger portion of revenues to convert into net profit.
No dividends are paid, as the company reinvests profits in business expansion
Nu Holdings does not pay dividends. All net profit is reinvested in development: expanding the customer base, new products, and technology. This is a typical strategy for fast-growing fintech companies in the scaling stage.
For income-focused investors, the shares are not interesting, but for those seeking capital appreciation, profit reinvestment may offer long-term potential.
Valuation on the latest reported figures
| Metric | Value |
|---|---|
| Market cap | 73.9 bn USD |
| P/E (LTM) | 114.7 |
| P/B | 36.63 |
| ROE | 32.8% |
Bottom line
Bottom line: Nu Holdings shows impressive profit growth – 66.5% in Q2, driven by expanding interest income. Return on equity is high, and capital expenditures are minimal, allowing a larger portion of revenues to convert into profit. However, the shares are already almost fairly valued by the market: the portal model upside is only +1%, and a P/E of 114.7 implies investors are paying for future growth. Verdict – rather attractive: growth continues, but re-rating potential is limited, and the main return will depend on the company's ability to sustain high growth rates.
Open the company's financial profile NU →
See also: market overview · valuation map · stock screeners