Vibra Energia: profit up 8.8x, but half the quarter came from the price gap, not volume
On 25 August Vibra Energia released its second-quarter 2026 results. Revenue rose 38.1% year on year to 11,283.6 m, EBITDA by 259.7% to 760.3 m, and net profit by 784.4% to 463.2 m. The EBITDA margin climbed from 2.8% to 7.4%, and the net margin from 0.6% to 4.1%. At a P/E of 9.1 and a dividend yield of 4.0%, the share looks attractive, but the sustainability of such a margin is questionable.
Key takeaways
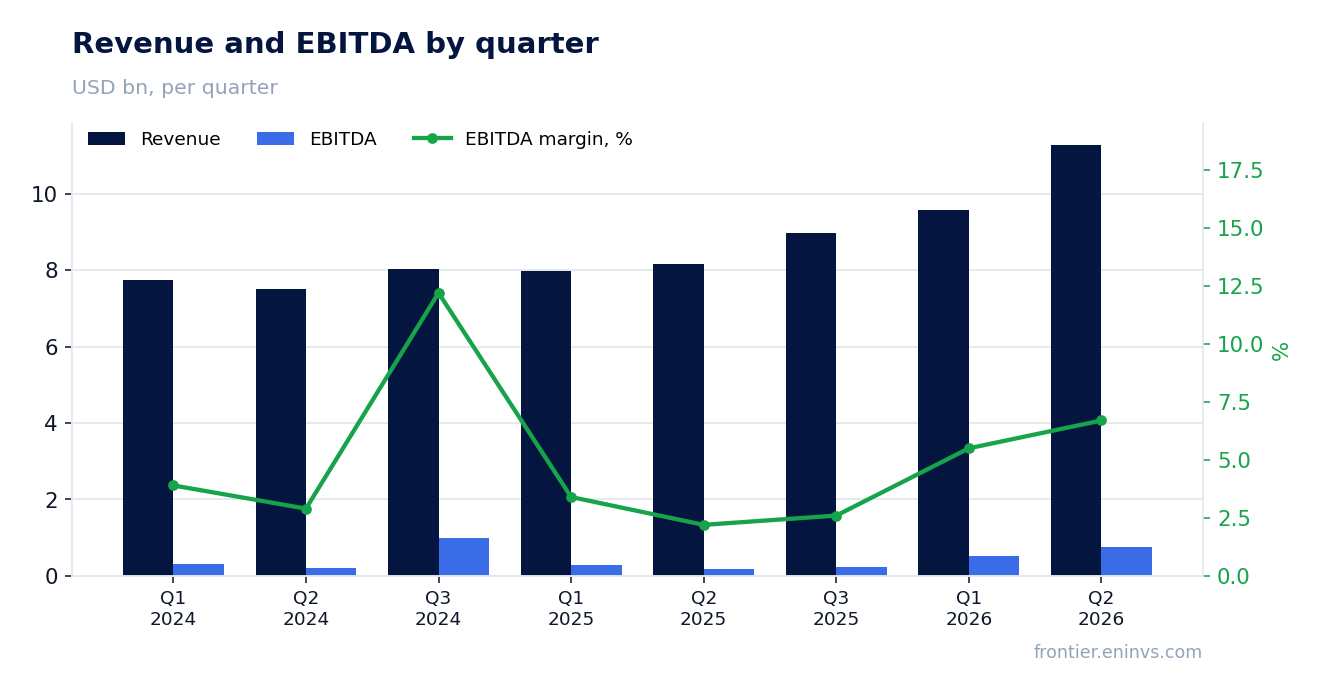
— Revenue added 38.1% year on year, but growth has accelerated for a fourth straight quarter
— EBITDA rose 4.1x, and the 7.4% margin is a record for the entire observation period
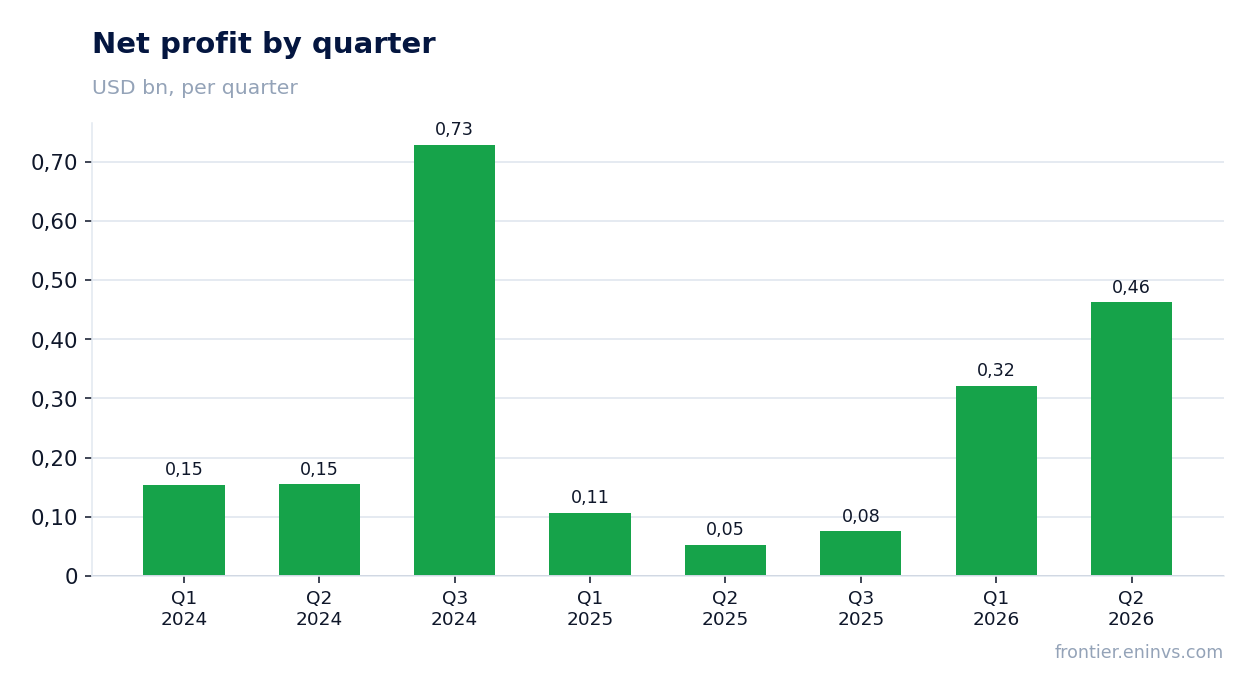
— Net profit of 463.2 m rose 8.8x, but operating cash flow is not keeping pace
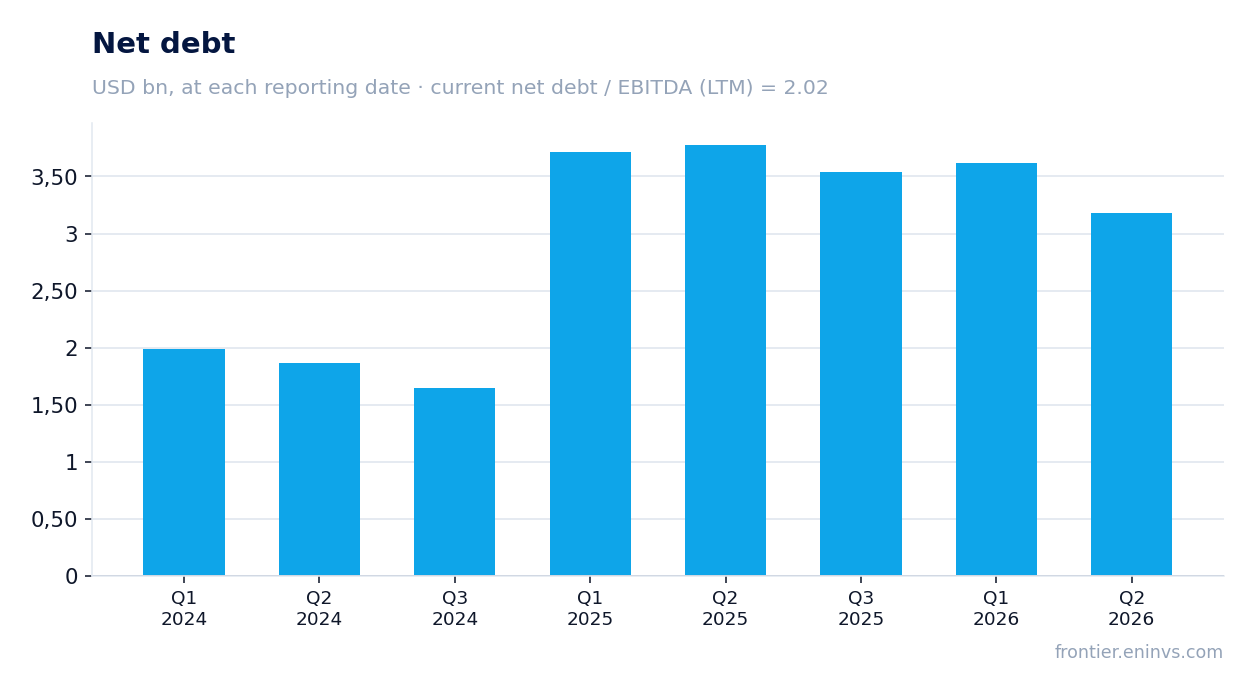
— Debt of 3,573.5 m against LTM EBITDA of 1,767.1 m gives leverage of 2.02 – moderate for the sector
— Dividend yield of 4.0% with about 360 m paid over the last 12 months
— P/E of 9.1 and EV/EBITDA of 7.1 are below historical levels, but the portal model gives +43% upside
— Free cash flow remains weak: capex of 46.3 m against OCF of 597.3 m – a gap of 551 m
Attractiveness
Key figures, USD bn
| Metric | Q2 2025 | Q2 2026 | Change |
|---|---|---|---|
| Revenue | 8.17 | 11.3 | +38.1% |
| EBITDA | 0.23 | 0.83 | +259.7% |
| Operating profit | 0.18 | 0.76 | +314.4% |
| Net profit | 0.05 | 0.46 | +784.4% |
| Operating cash flow | 0.14 | 0.60 | +312.1% |
| Capex | 0.06 | 0.05 | -20.1% |
| EBITDA margin | 2.8% | 7.4% | +4.6 pp |
| Net margin | 0.6% | 4.1% | +3.5 pp |
Revenue added 38.1% year on year, but growth has accelerated for a fourth straight quarter
In the second quarter of 2026, revenue reached 11,283.6 m, up 38.1% year on year. This is the fastest growth in three years: in the first quarter of 2026 revenue added 19.9%, in the fourth quarter of 2025 – 11.9%, in the third quarter of 2025 – 8.9%.
The acceleration is not only due to the low base of last year, when second-quarter 2025 revenue was 8,168.9 m. The main contribution comes from higher oil product prices and increased sales volumes through the retail network. The company does not disclose a precise breakdown, but the dynamics of gross margin indicate that the price factor was significant.
For the sustainability of such growth, it is important that it does not prove one-off. If revenue maintains a pace above 20% next quarter, it will confirm that the company has moved onto a new trajectory. If growth slows to 10–15%, the market will perceive it as a return to normal.
EBITDA rose 4.1x, and the 7.4% margin is a record for the entire observation period
EBITDA in the second quarter of 2026 was 760.3 m, 4.1 times more than 183.5 m a year earlier. The EBITDA margin rose to 7.4% from 2.8% in the second quarter of 2025. This is the highest margin level in the entire available history of quarterly reports.
Such a jump in margin cannot be explained by revenue growth alone. Operating expenses grew slower than revenue, providing an operating leverage effect. In addition, the company may have received a one-off benefit from a shift in the sales mix towards more marginal products. Without company detail, the exact cause remains unclear.
For investors, the key question is the sustainability of the margin. If it remains above 6% next quarter, it will mean the company has genuinely improved efficiency. If the margin returns to 3–4%, the market may revise its valuation.
Net profit of 463.2 m rose 8.8x, but operating cash flow is not keeping pace
Net profit in the second quarter of 2026 was 463.2 m, 8.8 times more than 52.4 m a year earlier. The net margin rose from 0.6% to 4.1%. Such profit growth significantly outpaces EBITDA growth, indicating a lower effective tax rate or one-off factors below the operating line.
Operating cash flow for the quarter was 597.3 m, higher than net profit but still below the first quarter of 2026 (526.4 m). The gap between profit and cash flow may be related to working capital changes, but without detail this is only an assumption.
Importantly, operating cash flow does not cover investments and dividends. With capex of 46.3 m and shareholder payouts, free cash flow remains limited. This creates a risk for future dividends if profit does not convert into cash.
Debt of 3,573.5 m against LTM EBITDA of 1,767.1 m gives leverage of 2.02 – moderate for the sector
Net debt at the latest reporting date was 3,573.5 m, down 0.4 bn from the previous reporting date and 0.6 bn less than a year earlier. The reduction in debt alongside EBITDA growth brought the net debt / LTM EBITDA ratio to 2.02. This is a moderate level for the oil and gas sector.
The debt reduction occurred despite the company paying dividends and investing in business maintenance. This indicates the ability to generate enough cash to service obligations. However, if EBITDA returns to last year's levels, leverage could rise.
Interest expenses are not disclosed in the provided data, but at the current debt level and rates they remain manageable. The main risk is rising rates or falling EBITDA, which could lead to covenant breaches if they are tied to debt leverage.
Dividend yield of 4.0% with about 360 m paid over the last 12 months
Over the last 12 months, the company paid dividends providing a yield of 4.0% on the current price. The exact amount is not disclosed, but at a market capitalisation of 8,963.8 m it is about 360 m. This corresponds to a payout ratio of approximately 36% of LTM net profit (986.7 m).
Our forecast for the current year's dividend assumes a payout ratio of 35–40% and expected net profit. If second-half 2026 profit remains at the first-half level, annual profit could be around 1.5 bn, giving a dividend of about 525–600 m, or a yield of 5.9–6.7% on the current price.
However, the dividend depends on free cash flow, which remains under pressure. Capex of 46.3 m per quarter is small, but operating cash flow is unstable. If the company increases investments or faces working capital growth, the dividend could be lower than expected.
The key rate in Russia remains high, making a 4.0% dividend yield less attractive compared to risk-free instruments. For conservative investors, this may be insufficient compensation for the risk.
P/E of 9.1 and EV/EBITDA of 7.1 are below historical levels, but the portal model gives +43% upside
At present, the shares trade at a P/E of 9.1 and EV/EBITDA of 7.1. This is below the average historical values over the last three years, when multiples were closer to 12–15. The decline reflects both profit growth and market caution regarding the sustainability of results.
According to the portal's model, which compares EBITDA growth with a target multiple and market capitalisation, the upside to fair value is +43%. This is our own estimate, not a market consensus. It assumes that the current EBITDA level persists and the multiple returns to its historical average.
If EBITDA next quarter turns out below 500 m, the model may give less upside. If the company confirms its ability to keep the margin above 6%, the shares could re-rate closer to fair value.
Free cash flow remains weak: capex of 46.3 m against OCF of 597.3 m – a gap of 551 m
Operating cash flow in the second quarter of 2026 was 597.3 m, while capital expenditures were 46.3 m. The difference of 551 m is free cash flow before dividends. However, compared to the first quarter of 2026, OCF declined from 526.4 m, which may indicate a deterioration in profit-to-cash conversion.
The main reason for the gap between net profit (463.2 m) and operating cash flow (597.3 m) is depreciation and changes in working capital. The company does not disclose details, but if revenue growth is accompanied by an increase in receivables, this could be eating into cash flow.
For dividends and debt reduction, a sustainable free cash flow is important. At the current capex level, the company can allocate about 500 m per year to dividends, but if OCF falls, payouts will be at risk. In the next report, it is worth watching the dynamics of OCF and working capital.
Valuation on the latest reported figures
| Metric | Value |
|---|---|
| Market cap | 8.96 bn USD |
| P/E (LTM) | 9.1 |
| EV/EBITDA (LTM) | 7.1 |
| P/B | 2.37 |
| Net debt / EBITDA (LTM) | 2.02 |
| Operating cash flow (LTM) | 1.20 bn |
| ROE | 41.1% |
| Dividend yield (12m) | 4.0% |
Bottom line
Bottom line: Vibra Energia delivered a record quarter in revenue, EBITDA and net profit. Revenue growth of 38.1% and an EBITDA margin of 7.4% are strong results that have driven multiples below historical levels. However, a significant part of profit growth may be one-off, and operating cash flow is not keeping pace with profit. Leverage of 2.02 is moderate, and the 4.0% dividend yield is acceptable but not outstanding. At the current price, the share looks attractive, but at least one more quarter is needed to confirm the sustainability of the margin and cash flow.
Open the company's financial profile VBBR →
See also: market overview · valuation map · stock screeners