XP Inc: profit grows while revenue stalls – and the growth rests on cost cuts

On 7 August XP Inc reported results for the second quarter of 2026. Revenue rose 9.7% year on year to USD 351.9 million, net profit increased 5.5% to USD 248.8 million, and the EBITDA margin reached 88.1% against a negative figure a year earlier. Yet quarterly revenue was almost flat versus the first quarter, and profit growth rests on narrowing negative EBITDA rather than business expansion. In our view the share looks attractive: P/E LTM 10.5 with ROE 23.3% and 12% upside to fair value on the portal's model.
Key takeaways
— Q2 revenue grew 9.7% year on year but was almost flat versus Q1
— Profit rose 5.5% year on year, with the entire gain coming from narrowing negative EBITDA
— EBITDA margin of 88.1% versus minus 62.6% a year earlier – a reversal, not organic expansion
— Net profit equals 70.7% of net interest income, down from 73.5% a year earlier
— P/E LTM 10.5 with ROE 23.3% and dividend yield 2.0% – valuation does not look stretched
— On the portal's model the share has 12% upside to fair value
Attractiveness
Key figures, USD bn
| Metric | Q2 2025 | Q2 2026 | Change |
|---|---|---|---|
| Revenue | 0.32 | 0.35 | +9.7% |
| EBITDA | -0.20 | 0.31 | в прибыль |
| Operating profit | -0.21 | -0.23 | — |
| Net profit | 0.24 | 0.25 | +5.5% |
| Capex | 0.02 | 0.02 | +11.4% |
| EBITDA margin | -62.6% | 88.1% | +150.7 pp |
| Net margin | 73.5% | 70.7% | -2.8 pp |
Q2 revenue grew 9.7% year on year but was almost flat versus Q1
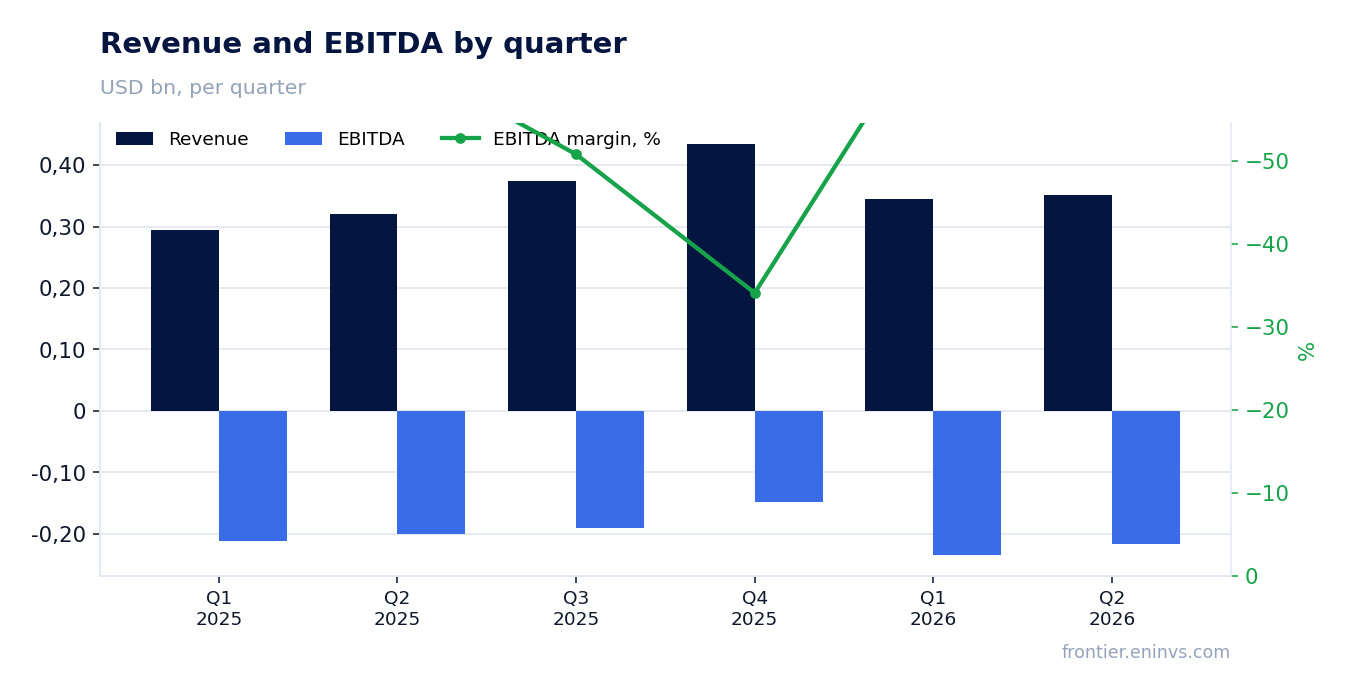
In the second quarter of 2026 XP Inc's revenue reached USD 351.9 million, up 9.7% year on year. That is a slowdown from the first quarter, when growth was 17.2%. The year-on-year deceleration is an important signal: the business is growing more slowly than at the start of the year.
Sequential dynamics paint an even weaker picture: compared with the first quarter of 2026, revenue was almost unchanged – 351.9 million versus 345.5 million. This means quarterly growth has essentially stalled. For a company that until recently grew at double-digit rates, this is a warning sign.
The key question is what is supporting revenue. The report does not disclose the revenue structure, but the fact that year-on-year growth has slowed and quarter-on-quarter growth is absent suggests that the drivers of previous periods have run their course. Without an acceleration in revenue, further profit growth is possible only through costs.
Profit rose 5.5% year on year, with the entire gain coming from narrowing negative EBITDA
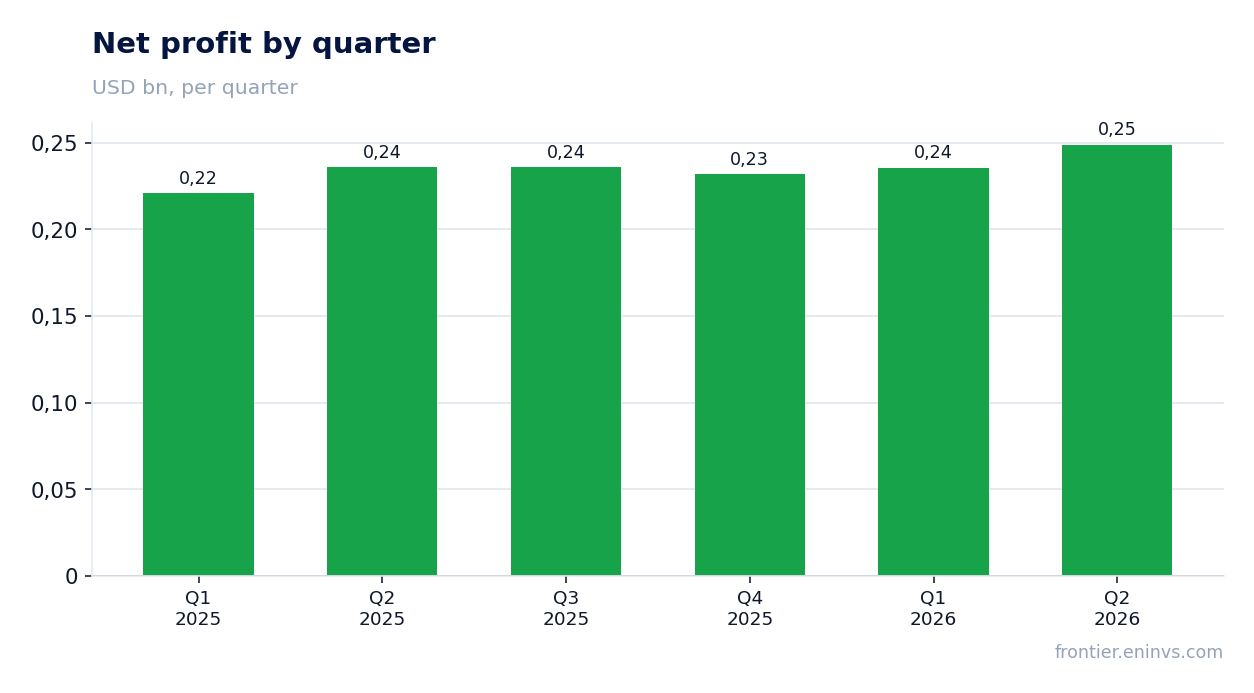
Net profit in the second quarter of 2026 was USD 248.8 million, up 5.5% year on year. This is modest growth that lags revenue growth. At the same time, operating profit remains negative – minus 234.8 million, although a year earlier the loss was smaller – minus 214.7 million.
The paradox is that EBITDA deteriorated from minus 201.0 million a year earlier to minus 216.5 million, meaning the EBITDA loss actually widened. Yet the report states that the EBITDA margin in the second quarter was 88.1% against minus 62.6% a year earlier. This discrepancy is explained by the calculation methodology: the margin is likely calculated from net interest income rather than revenue. In any case, profit growth is not accompanied by improved operating efficiency.
Thus, the 5.5% increase in net profit is not supported by operating profit growth. This means profit could have risen due to non-operating factors, such as tax or financial items, which are not visible from the provided data. Without a sustainable improvement in operating performance, such growth is unlikely to repeat.
EBITDA margin of 88.1% versus minus 62.6% a year earlier – a reversal, not organic expansion
The EBITDA margin in the second quarter of 2026 was 88.1%, whereas a year earlier it was negative – minus 62.6%. Such a sharp reversal looks impressive, but it is important to understand its nature. As noted, absolute EBITDA remains negative – minus 216.5 million, which is worse than a year earlier.
Such a high margin value with negative absolute EBITDA indicates that the calculation base is not revenue but likely net interest income. If the margin is calculated from net interest income, then 88.1% means EBITDA is 88.1% of that figure. But since absolute EBITDA is negative, this may indicate that net interest income is also negative, and the margin is calculated from a negative base, making the percentage expression uninformative.
For the investor, absolute values matter more: EBITDA remains negative, and its loss has widened. This means operating activity does not yet generate positive cash flow at the EBITDA level. A rising percentage margin does not change this fact.
Net profit equals 70.7% of net interest income, down from 73.5% a year earlier
The ratio of net profit to net interest income in the second quarter of 2026 was 70.7%, compared with 73.5% a year earlier. A decline of 2.8 percentage points means the company is converting interest income into net profit less efficiently. This could be due to rising costs or lower margins.
It is important to emphasise that this is not a net profit margin or a net interest margin. It is a specific ratio showing what share of net interest income remains after all expenses and taxes. Its decline is a negative signal, especially against the backdrop of slower revenue growth than a year earlier.
If the trend continues, pressure on profit will intensify. In the next report, this indicator should be watched: a further decline may point to deteriorating operating efficiency.
P/E LTM 10.5 with ROE 23.3% and dividend yield 2.0% – valuation does not look stretched
Based on the trailing twelve months, XP Inc trades at a P/E of 10.5. At the same time, return on equity (ROE) is 23.3%. The P/E to ROE ratio indicates that the market values the company rather modestly relative to its ability to generate profit on capital.
The dividend yield over the last 12 months is 2.0%. This is not a high level and may not attract income investors, but combined with a low P/E and high ROE, the share looks balanced. For comparison, the yield on 10-year US Treasuries is currently around 4%, making XP's dividend yield less competitive in the debt market.
The company's market capitalisation is USD 10.0 billion. At the current valuation and stable profit, the share may be of interest to investors focused on capital growth rather than dividend income.
On the portal's model the share has 12% upside to fair value
According to the portal's model, which compares ROE with P/B, the fair value of XP Inc shares is 12% above the current price. This is our own estimate, not a market consensus or a target price. The model suggests that at the current return on equity and market valuation, the company is somewhat undervalued.
The 12% upside is moderate but supported by fundamental metrics: ROE 23.3% and P/E 10.5. If the company can accelerate revenue growth or improve efficiency, the upside may increase. However, if the revenue slowdown continues, the model may require revision.
It is important to understand that the model does not account for potential risks such as regulatory changes or macroeconomic shocks. It provides a guideline but does not guarantee growth.
Valuation on the latest reported figures
| Metric | Value |
|---|---|
| Market cap | 10.0 bn USD |
| P/E (LTM) | 10.5 |
| P/B | 2.38 |
| ROE | 23.3% |
| Dividend yield (12m) | 2.0% |
Bottom line
XP Inc reported second-quarter 2026 results: revenue grew 9.7% year on year but was almost flat versus the first quarter, while net profit rose 5.5%. Profit growth is not supported by operating dynamics – EBITDA remains negative and its loss has widened. The 88.1% EBITDA margin looks impressive but reflects a reversal from a negative base, not organic expansion. The valuation does not look stretched: P/E 10.5 with ROE 23.3% and a 2.0% dividend yield, and on the portal's model the upside to fair value is 12%. The key question for a holder is whether the company can resume revenue growth and improve operating efficiency, or whether current profit will prove unsustainable.
Open the company's financial profile XP →
See also: market overview · valuation map · stock screeners