Advantage Energy: revenue accelerated to +23.5%, but EBITDA and profit fell as margin returned from an anomalous 102% to 63%
Advantage Energy reported Q2 2026 results. Revenue rose 23.5% year-on-year to $147.0 million, accelerating from a 2.4% decline in the prior quarter. However, EBITDA fell 23.6% to $67.9 million and net profit dropped 38.1% to $32.4 million: a year earlier the EBITDA margin was an anomalous 102.1%, now it is 63.1%. At 64.8x LTM earnings and 7.08x EV/EBITDA versus its own three-year average of 7.77x, the stock looks rather attractive, but the profit decline and the high year-ago base warrant caution.
Key takeaways
— Revenue accelerated to +23.5% year-on-year, but this is a return to normal after a 2.4% decline in Q1
— EBITDA fell 23.6% due to an anomalously high year-ago base when the margin reached 102.1%
— Net profit declined 38.1% but remains positive at $32.4 million for the quarter
— Leverage at 2.43x LTM EBITDA is moderate, but net debt rose to $0.6 billion
— Operating cash flow of $75.3 million for the quarter covers interest and supports dividends
— Valuation at 7.08x EV/EBITDA is below its own three-year average of 7.77x — a discount to history
— The portal model implies +14% upside to fair value
Attractiveness
Key figures, USD bn
| Metric | Q2 2025 | Q2 2026 | Change |
|---|---|---|---|
| Revenue | 0.12 | 0.15 | +23.5% |
| EBITDA | 0.12 | 0.09 | -23.6% |
| Operating profit | 0.01 | 0.03 | +118.6% |
| Net profit | 0.05 | 0.03 | -38.1% |
| Operating cash flow | 0.06 | 0.08 | +30.0% |
| EBITDA margin | 102.1% | 63.1% | -39.0 pp |
| Net margin | 44.0% | 22.1% | -21.9 pp |
Revenue accelerated to +23.5% year-on-year, but this is a return to normal after a 2.4% decline in Q1
In Q2 2026, Advantage Energy's revenue reached $147.0 million, up 23.5% year-on-year. This is a notable acceleration from Q1, when revenue declined 2.4% year-on-year. However, this growth is mainly explained by the low base of Q2 2025, when revenue was $119.0 million.
Sequential dynamics (quarter-on-quarter) show a 2.3% decline: in Q1 2026 revenue was $150.4 million. So the year-on-year growth is more a recovery from a weak start to 2025 than an acceleration of the business. The company did not disclose segment details, so the source of growth remains unclear.
For an investor, it is important that revenue returned above $145 million, but without sustained quarterly growth it is difficult to speak of a trend change. The next report will show whether the positive year-on-year dynamics persist or this is a one-off base effect.
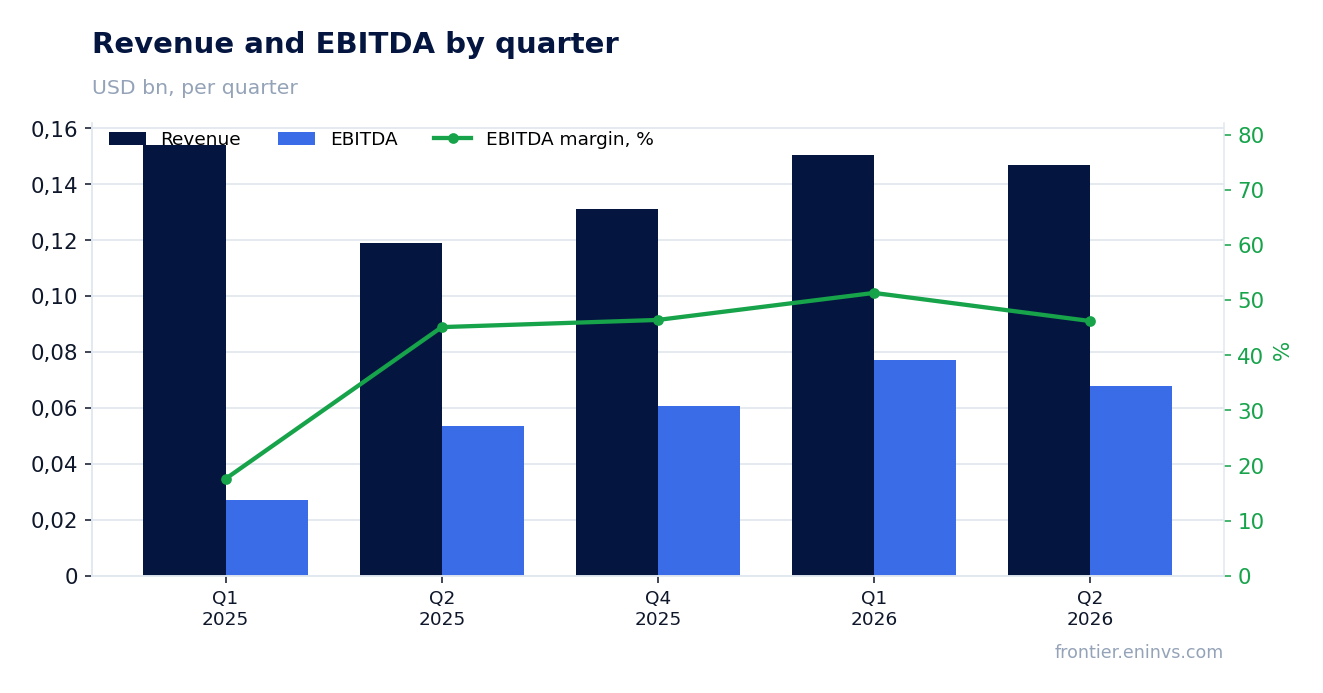
EBITDA fell 23.6% due to an anomalously high year-ago base when the margin reached 102.1%
EBITDA in Q2 2026 was $67.9 million, down 23.6% year-on-year. The key reason is the exceptionally high base of Q2 2025, when EBITDA reached $53.7 million on revenue of $119.0 million, implying an EBITDA margin of 102.1%. Such a margin level is atypical and likely related to one-off factors that will not repeat.
In the current quarter, the EBITDA margin was 63.1%, significantly below last year's 102.1% but still very high for most industries. The 39 percentage point margin decline is explained by base normalisation: a year earlier, income unrelated to core operations or one-off compensations may have been recognised.
Sequential dynamics are also negative: in Q1 2026 EBITDA was $77.1 million, a 12.0% quarter-on-quarter decline. This suggests that pressure on profitability persists, and the sustainability of margins above 60% remains in question.
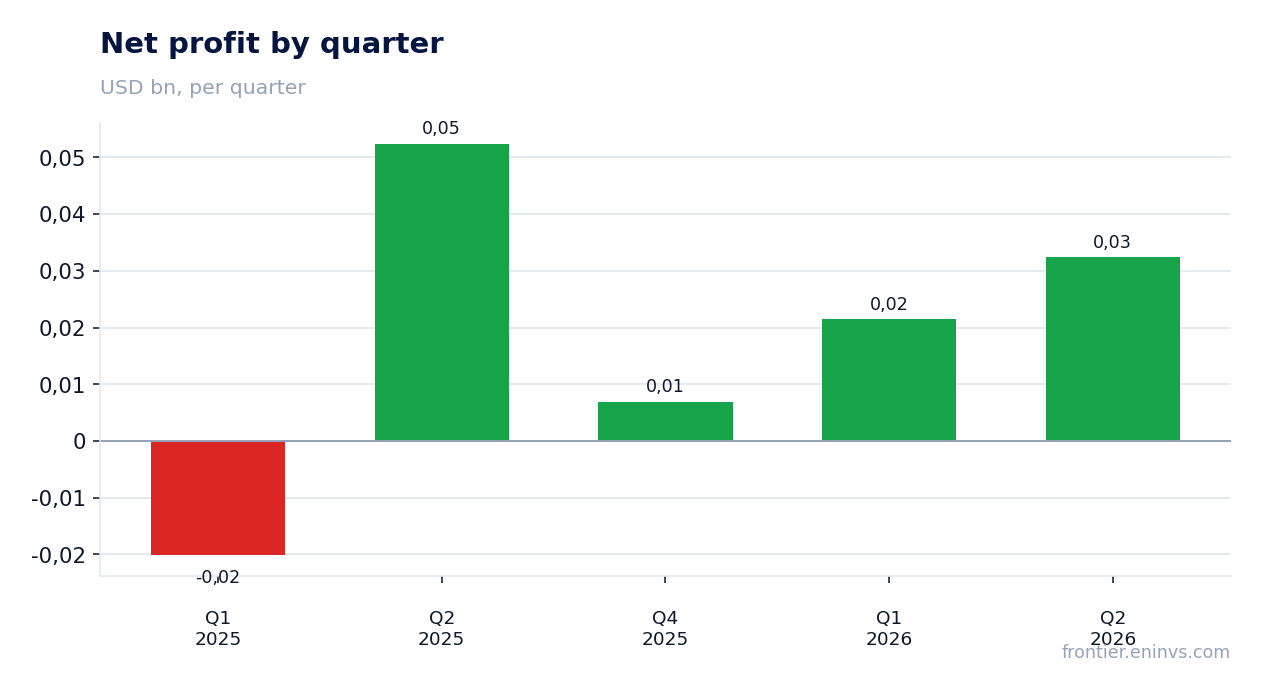
Net profit declined 38.1% but remains positive at $32.4 million for the quarter
Net profit in Q2 2026 was $32.4 million, down 38.1% year-on-year. The profit decline is deeper than the EBITDA decline, pointing to higher expenses below the operating line — possibly increased interest or taxes. Net margin fell to 22.1% from 44.0% a year earlier.
Despite the decline, the company remains profitable. Operating profit was $28.8 million, which is lower than net profit — this means a significant portion of profit comes from non-operating income, such as foreign exchange gains or investment income. This reduces the quality of earnings and makes them less sustainable.
Sequential dynamics are positive: in Q1 2026 net profit was $21.5 million, a 51.1% quarter-on-quarter increase. However, year-on-year profit is still significantly lower, and a recovery will require sustained improvement in operating metrics.
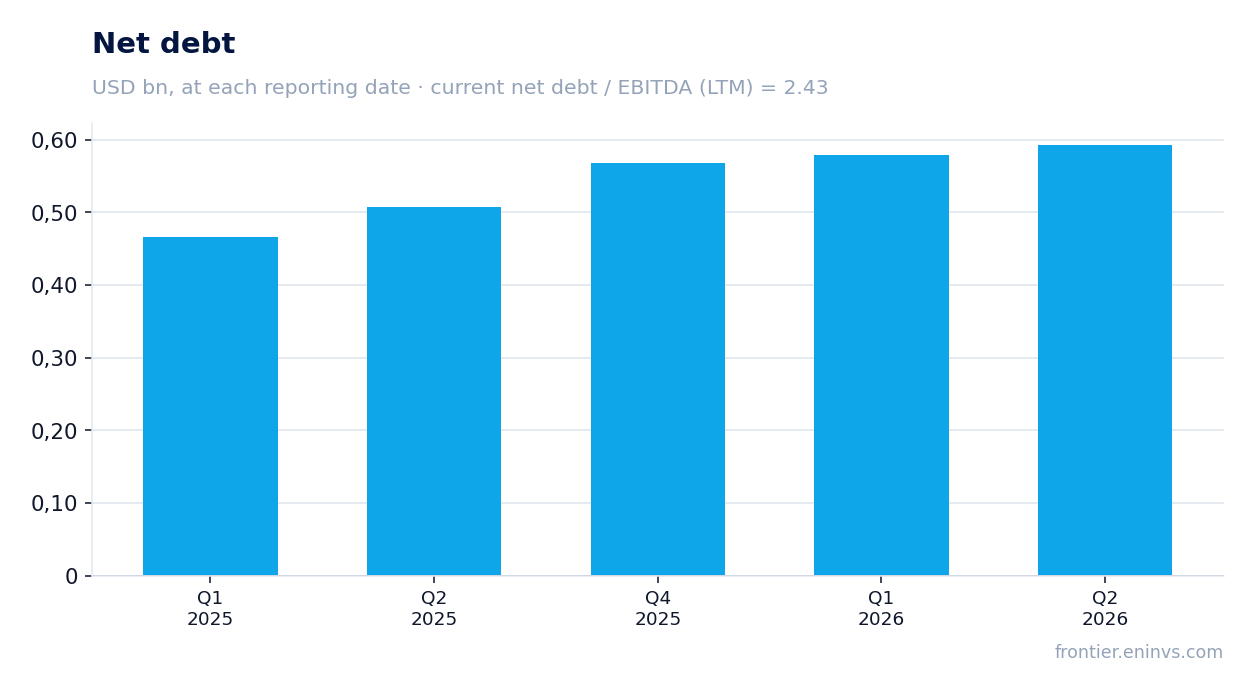
Leverage at 2.43x LTM EBITDA is moderate, but net debt rose to $0.6 billion
Net debt as of 30 June 2026 was $592.9 million, up from $578.6 million on 31 March 2026. Over the past 12 months, net debt rose from $507.4 million on 30 June 2025 to $592.9 million, an increase of $0.1 billion. This is moderate growth, consistent with current capex and dividend payments.
The net debt to LTM EBITDA ratio is 2.43x. This is a moderate level that does not raise immediate concerns but limits financial flexibility. It is important to note that the earlier value of this ratio is not in the facts, so one cannot claim that leverage rose or fell.
Interest expenses likely rise with debt, explaining the faster decline in net profit compared to EBITDA. If the current trajectory continues, debt could become a more significant factor for profit, especially if EBITDA continues to decline.
Operating cash flow of $75.3 million for the quarter covers interest and supports dividends
Operating cash flow in Q2 2026 was $75.3 million, up 30.0% from $57.9 million a year earlier. This is a strong result that exceeds quarterly EBITDA, which may indicate favourable working capital changes. Over the trailing twelve months, operating cash flow reached $272.9 million.
This level of cash flow comfortably covers interest payments and provides a basis for dividends. However, the company did not disclose capital expenditures, so free cash flow cannot be assessed. If capex is high, dividend potential may be limited.
Sequential dynamics: in Q1 2026 operating cash flow was $85.1 million, an 11.6% quarter-on-quarter decline. This may reflect seasonality or one-off factors, but overall the level remains high.
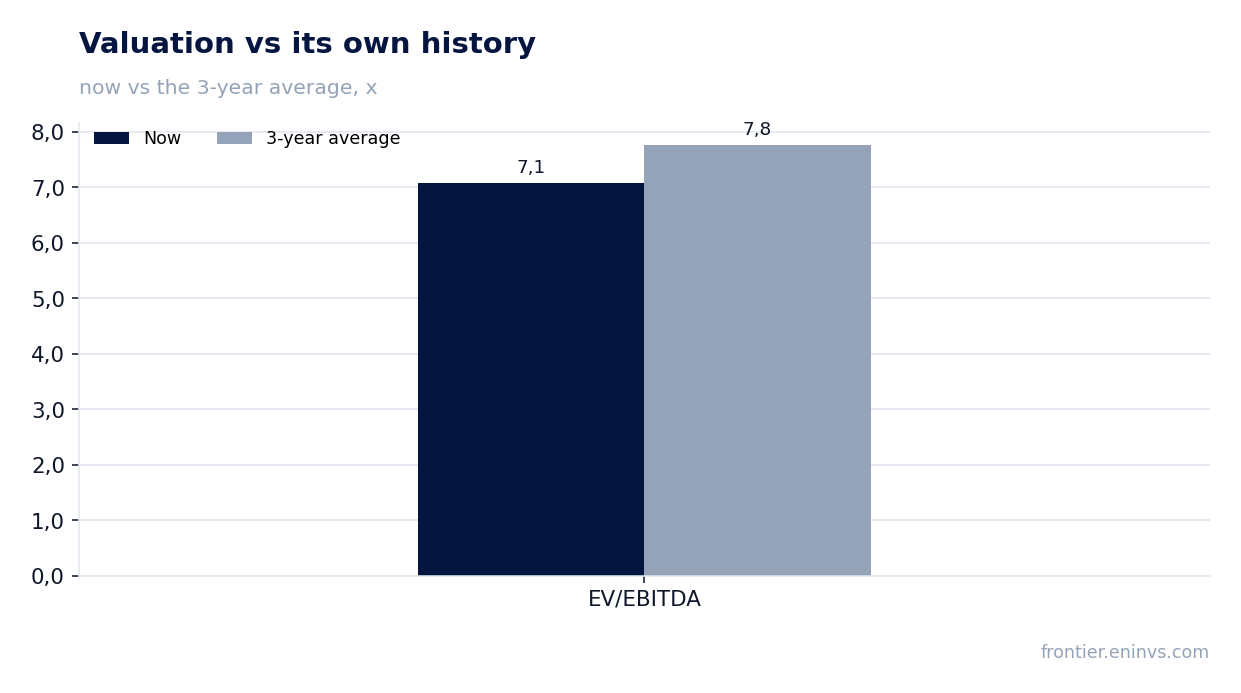
Valuation at 7.08x EV/EBITDA is below its own three-year average of 7.77x — a discount to history
The current EV/EBITDA multiple is 7.08x, below its own three-year average of 7.77x. This means the market values the company cheaper than its average over the past three years. The discount may be justified by the decline in EBITDA and uncertainty about margin sustainability.
The price-to-earnings ratio for the trailing twelve months (P/E LTM) is 64.8x, reflecting a low LTM profit base ($17.9 million). This is a high figure that is not attractive on its own, but it is distorted by one-off factors. Return on equity (ROE) is 10.5%.
According to the portal's model, which reprices EBITDA at current commodity prices at the target EV/EBITDA, the upside to fair value is estimated at +14%. This is the portal's own estimate, not a market consensus. For an investor, the current multiple below the historical average could be an entry point if EBITDA stabilises.
Valuation on the latest reported figures
| Metric | Value |
|---|---|
| Market cap | 1.16 bn USD |
| P/E (LTM) | 64.8 |
| EV/EBITDA (LTM) | 7.1 |
| P/B | 0.94 |
| Net debt / EBITDA (LTM) | 2.43 |
| Operating cash flow (LTM) | 0.27 bn |
| ROE | 10.5% |
| EV/EBITDA, 3-year average | 7.8 |
Bottom line
Advantage Energy showed revenue acceleration to +23.5% year-on-year, but this is largely a low-base effect. EBITDA and net profit declined due to the anomalously high margin of the previous year, which is unlikely to repeat. Operating cash flow remains strong, and leverage is moderate. Valuation at EV/EBITDA is below its own three-year average, providing some cushion. However, to confirm business sustainability, growth in EBITDA and profit is needed, not just revenue.
Open the company's financial profile AAV →
See also: market overview · valuation map · stock screeners