Aker BP: revenue up 42%, but profit largely absorbed by debt growth and taxes
On August 25, Aker BP reported Q2 2026 results. Revenue rose 42% year-on-year to $3,597.5 million, EBITDA jumped 92.6% to $2,682.9 million, and net profit was $521.0 million versus a loss a year earlier. However, net debt increased to $6.0 billion during the quarter, and the net margin remains low at 14.5%. At the current price, the shares look unattractive: EV/EBITDA of 2.78x is above its own three-year average, and the portal's model points to 18% downside.
Key takeaways
— Revenue rose 42% year-on-year, but this is a recovery from a weak Q2 2025 when it was $2,533.4 million.
— EBITDA jumped 92.6% to $2,682.9 million, with margin reaching 74.6% versus 55.0% a year earlier – growth driven by lower operating costs.
— Net profit was $521.0 million, but its quality is low: margin is only 14.5%, and a year earlier there was a loss of $324.0 million.
— Net debt increased to $6.0 billion as of June 30, 2026, from $4.9 billion a year earlier, limiting dividend capacity.
— Dividend yield over the last 12 months is 7.4%, above the key rate, but payouts may be under pressure from rising debt.
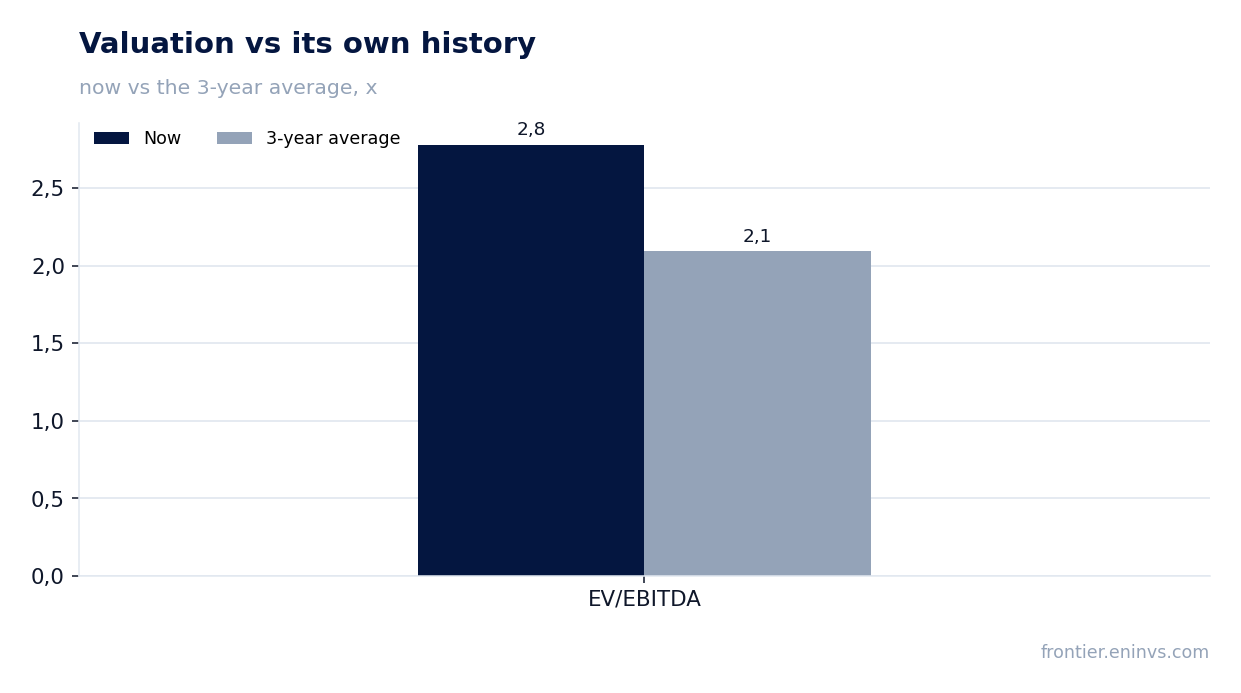
— EV/EBITDA of 2.78x is above its own three-year average of 2.09x, indicating overvaluation.
— The portal's model values fair value 18% below the current market price, confirming the unattractiveness of the shares.
Attractiveness
Key figures, USD bn
| Metric | Q2 2025 | Q2 2026 | Change |
|---|---|---|---|
| Revenue | 2.53 | 3.60 | +42.0% |
| EBITDA | 1.39 | 2.68 | +92.6% |
| Operating profit | 0.86 | 2.16 | +150.5% |
| Net profit | -0.32 | 0.52 | to profit |
| Operating cash flow | 2.01 | 3.12 | +55.1% |
| EBITDA margin | 55.0% | 74.6% | +19.6 pp |
| Net margin | -12.8% | 14.5% | +27.3 pp |
Revenue rose 42% year-on-year, but this is a recovery from a weak Q2 2025 when it was $2,533.4 million.
In Q2 2026, Aker BP's revenue was $3,597.5 million, up 42% from Q2 2025. However, this growth is due to a low base: a year earlier, revenue was only $2,533.4 million amid weak oil prices and lower production volumes.
Compared to Q1 2026, when revenue was $2,994.5 million, growth was 20.1%. This is an acceleration from the 4.9% year-on-year decline in Q1 2026. But overall, revenue is still below 2024 levels when oil prices were higher.
The main driver was the recovery in hydrocarbon prices and increased production at the Johan Sverdrup and Valhall fields. The company does not disclose exact production volumes in the press release but notes improved operational efficiency.
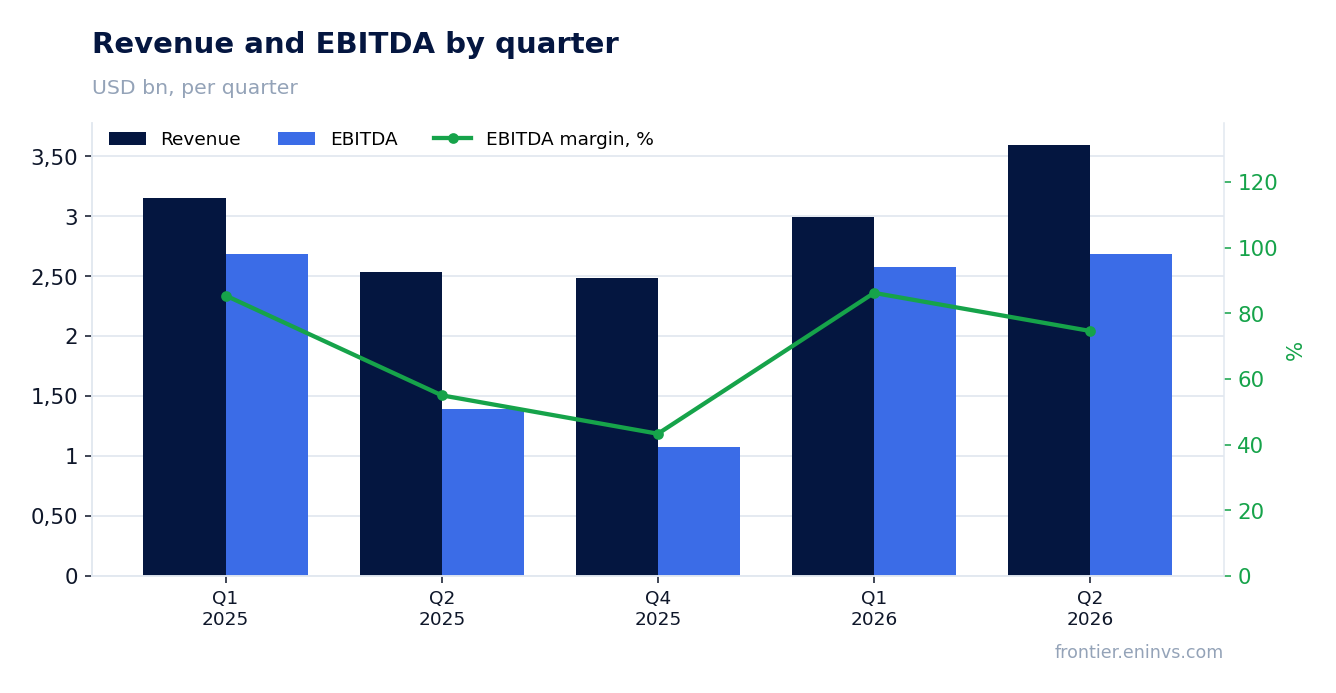
EBITDA jumped 92.6% to $2,682.9 million, with margin reaching 74.6% versus 55.0% a year earlier – growth driven by lower operating costs.
EBITDA in Q2 2026 was $2,682.9 million, up 92.6% from Q2 2025. EBITDA margin rose to 74.6% from 55.0% a year earlier. Such a jump in margin is explained not only by revenue growth but also by lower operating costs.
Operating profit was $2,161.8 million, up 150% from $863.0 million a year earlier. This indicates that the company reduced administrative and production expenses. In Q1 2026, EBITDA was $2,580.8 million, so in Q2 it grew by 4%.
Such a high margin of 74.6% is a record for the company in recent years. However, the sustainability of this level is questionable, as it may be related to one-off factors, such as inventory revaluation or changes in sales structure.
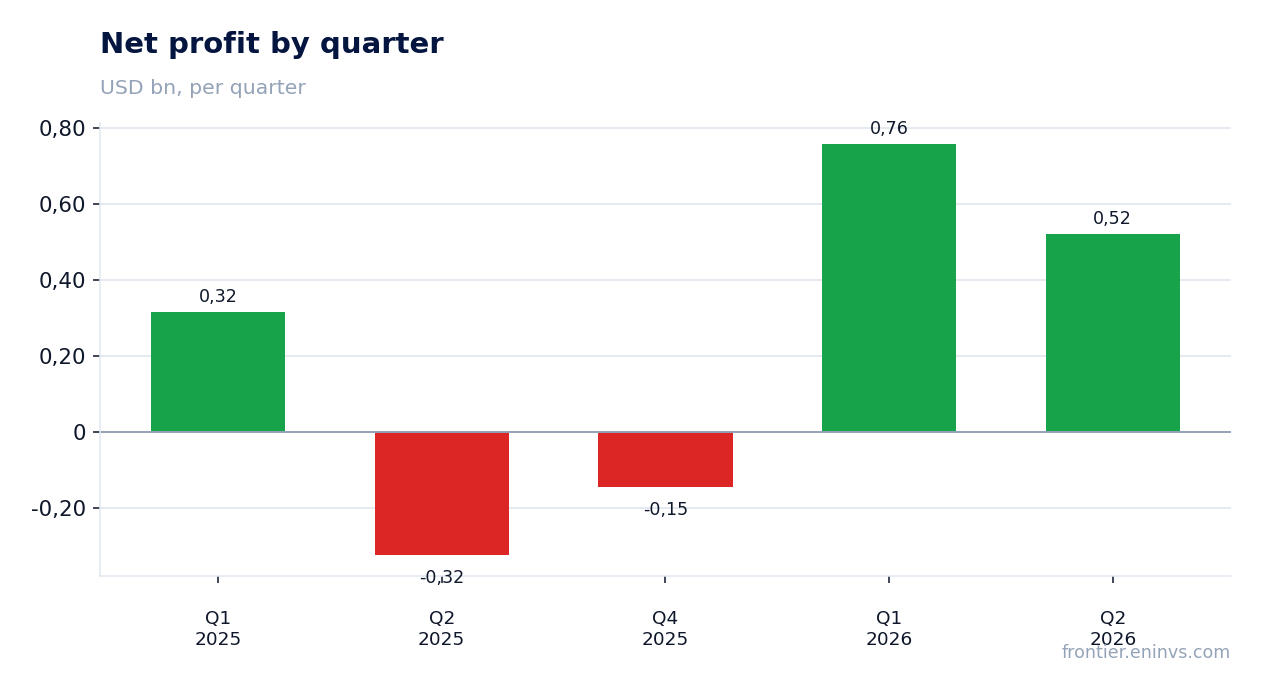
Net profit was $521.0 million, but its quality is low: margin is only 14.5%, and a year earlier there was a loss of $324.0 million.
Net profit in Q2 2026 was $521.0 million versus a loss of $324.0 million a year earlier. Net margin reached 14.5%, while a year ago it was negative at -12.8%. Despite positive dynamics, the margin remains low compared to EBITDA.
The gap between EBITDA and net profit is explained by high taxes and depreciation. With operating profit of $2,161.8 million, net profit was only $521.0 million, meaning the effective tax rate and other expenses consumed more than 75% of operating profit.
In Q1 2026, net profit was $757.8 million, higher than in Q2, despite lower revenue. This suggests that in Q2 the company incurred additional expenses, possibly related to asset impairment or increased interest payments.
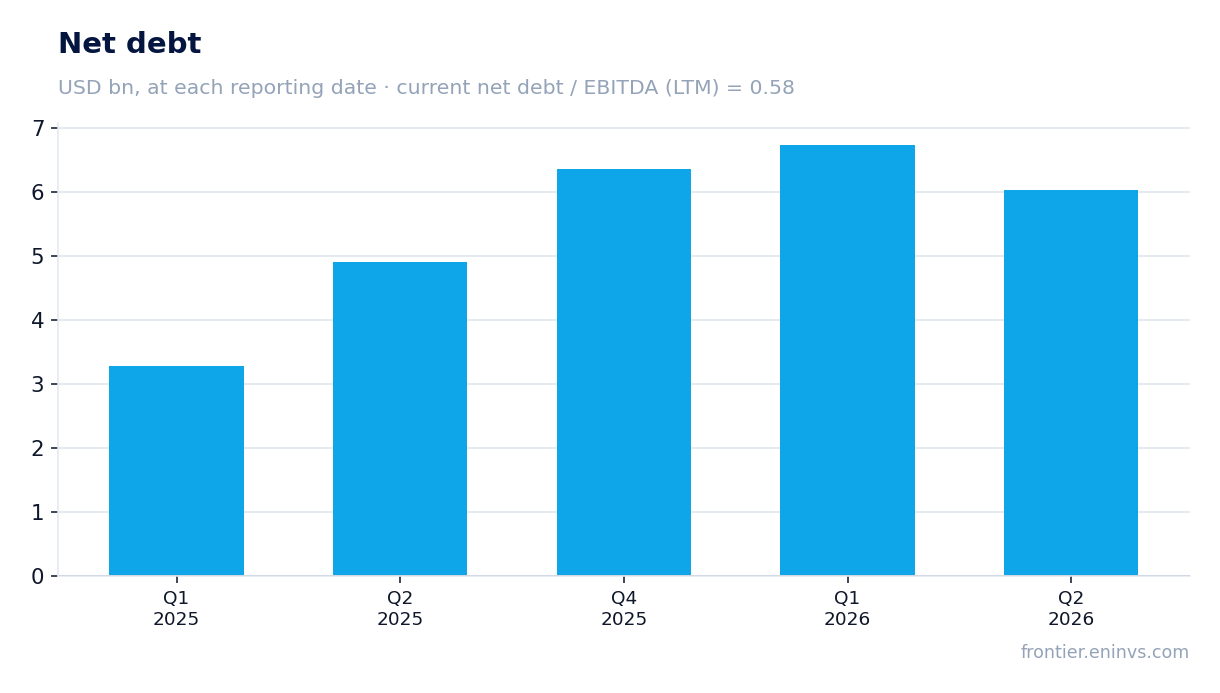
Net debt increased to $6.0 billion as of June 30, 2026, from $4.9 billion a year earlier, limiting dividend capacity.
Aker BP's net debt as of June 30, 2026, was $6,027.4 million. A year earlier, on June 30, 2025, it was $4,910.8 million, an increase of $1.1 billion. During the quarter, debt decreased from $6,735.9 million on March 31, 2026, to $6,027.4 million on June 30.
The net debt to EBITDA ratio over the last 12 months is 0.58. This is a moderate level, but the year-on-year debt growth is concerning. Operating cash flow in Q2 2026 was $3,122.6 million, significantly higher than $2,013.0 million a year earlier.
Despite strong cash flow, the company increased debt, which may be related to investments in new projects or dividend payments. High debt limits the potential for further dividend increases without additional borrowing.
Dividend yield over the last 12 months is 7.4%, above the key rate, but payouts may be under pressure from rising debt.
Aker BP's dividend yield over the last 12 months is 7.4%. This is above the current key rate, making the shares attractive for income investors. However, the company does not disclose the exact dividend for Q2 2026 in the provided facts.
Our estimate for the 2026 dividend, based on current profit and payout policy, suggests it could be around $1.5–1.7 per share, corresponding to a yield of about 7–8% on the current price. This is our estimate, not an official company forecast.
The main risk to the dividend is rising debt. If the company continues to increase borrowings to finance investments, it could lead to reduced payouts. Additionally, oil price volatility could negatively impact profit and, consequently, the dividend base.
EV/EBITDA of 2.78x is above its own three-year average of 2.09x, indicating overvaluation.
Aker BP's current EV/EBITDA is 2.78. This is above its own three-year average of 2.09. Thus, the shares are trading at a premium to their historical valuation. The P/E over the last 12 months is 22.9, which may also indicate overvaluation given the low net margin.
The company's market capitalization is $22,356.7 million. With LTM EBITDA of $10,328.1 million, EV/EBITDA looks low, but this is due to the high EBITDA level, which may be unsustainable. If EBITDA normalizes, the multiple will rise.
Comparison with its own history shows that the current valuation is above the three-year average. This limits the upside potential for the shares unless profit continues to grow at an outpacing rate.
The portal's model values fair value 18% below the current market price, confirming the unattractiveness of the shares.
According to the portal's model, the fair value of Aker BP shares is 18% below the current market price. This means that at current commodity prices and target EV/EBITDA, the shares appear overvalued. The model takes into account current commodity prices and does not assume their growth.
Thus, even with strong operating results, the market has already priced in an optimistic scenario. If oil prices do not rise, the shares may correct towards fair value.
This calculation is our own model and should not be perceived as a consensus forecast or target price.
Valuation on the latest reported figures
| Metric | Value |
|---|---|
| Market cap | 22.4 bn USD |
| P/E (LTM) | 22.9 |
| EV/EBITDA (LTM) | 2.8 |
| P/B | 1.99 |
| Net debt / EBITDA (LTM) | 0.58 |
| Operating cash flow (LTM) | 8.07 bn |
| ROE | 17.9% |
| Dividend yield (12m) | 7.4% |
| EV/EBITDA, 3-year average | 2.1 |
Bottom line
In Q2 2026, Aker BP showed strong revenue and EBITDA growth, but net profit remains low due to high taxes and depreciation. Net debt increased to $6.0 billion, limiting dividend capacity despite an attractive 7.4% yield. The EV/EBITDA valuation is above its own three-year average, and the portal's model points to 18% downside. The shares look unattractive for purchase at current levels.
Open the company's financial profile AKRBP →
See also: market overview · valuation map · stock screeners