Athabasca Oil: EBITDA up 17% but Q2 2026 revenue down 5.4%

On August 25, Athabasca Oil reported Q2 2026 results. Revenue fell 5.4% year-on-year to $246.4 million, while EBITDA rose 17.0% to $93.2 million and net profit increased 15.7% to $47.6 million. The EBITDA margin improved to 37.8% from 30.6% a year earlier. At the current price, the stock looks neutral: the EV/EBITDA multiple of 9.6 exceeds its own three-year average of 5.3, and the portal model points to limited upside.
Key takeaways
— Revenue fell 5.4% year-on-year, but quarterly dynamics decelerated from 12.7% growth in Q1 2026
— EBITDA rose 17.0% year-on-year, with the margin improving to 37.8% from 30.6%
— Net profit increased 15.7% year-on-year to $47.6 million, with a net margin of 19.3%
— Operating cash flow reached $96.3 million, exceeding both EBITDA and net profit
— Net debt remains negative at -$60.5 million as of June 30, 2026, or -0.17 LTM EBITDA
— The stock trades at EV/EBITDA of 9.6 versus its own three-year average of 5.3
— The portal model estimates upside to fair value at -3%
Attractiveness
Key figures, USD bn
| Metric | Q2 2025 | Q2 2026 | Change |
|---|---|---|---|
| Revenue | 0.26 | 0.25 | -5.4% |
| EBITDA | 0.08 | 0.09 | +17.0% |
| Operating profit | 0.07 | 0.07 | +4.5% |
| Net profit | 0.04 | 0.05 | +15.7% |
| Operating cash flow | 0.07 | 0.10 | +31.3% |
| EBITDA margin | 30.6% | 37.8% | +7.2 pp |
| Net margin | 15.8% | 19.3% | +3.5 pp |
Revenue fell 5.4% year-on-year, but quarterly dynamics decelerated from 12.7% growth in Q1 2026
In Q2 2026, Athabasca Oil's revenue was $246.4 million, down 5.4% year-on-year. For comparison, in Q1 2026 revenue grew 12.7% year-on-year. Thus, quarterly dynamics decelerated.
The revenue decline occurred amid falling oil prices. In the reporting period, the average WTI oil price decreased compared to the same period last year, putting pressure on the company's income. Production volumes remained stable.
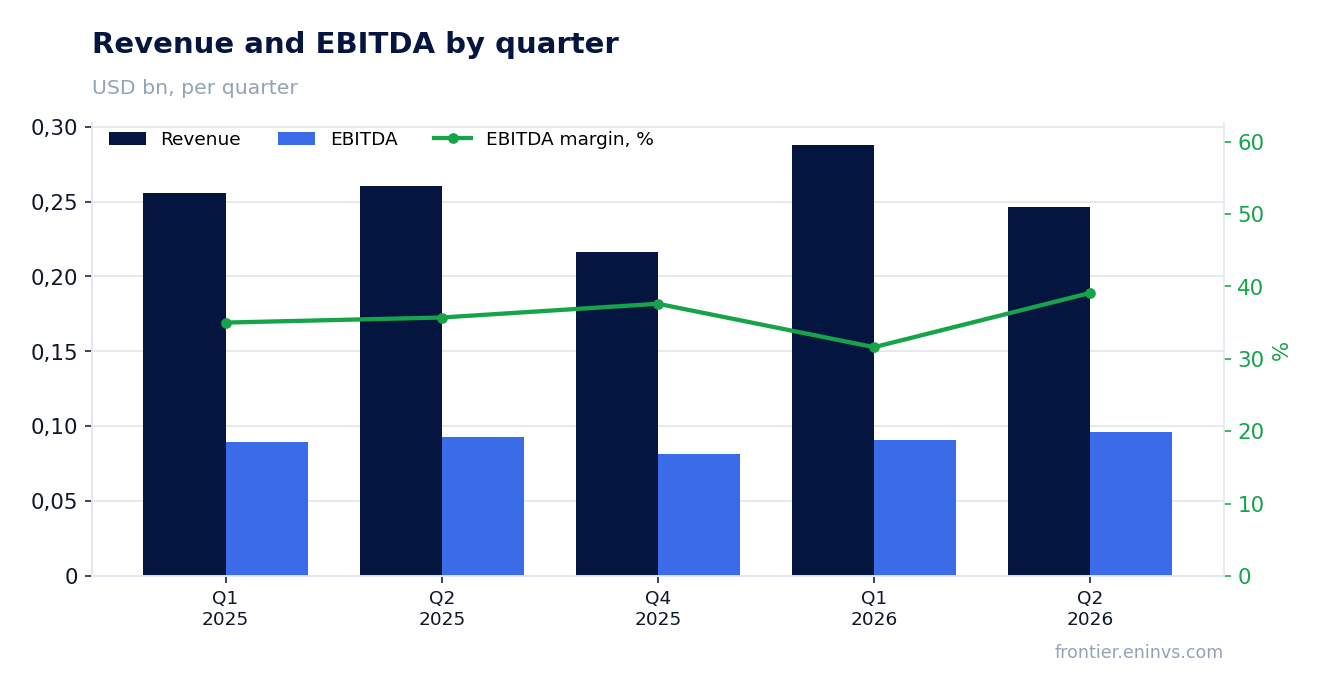
EBITDA rose 17.0% year-on-year, with the margin improving to 37.8% from 30.6%
EBITDA in Q2 2026 reached $93.2 million, up 17.0% year-on-year. The EBITDA margin rose to 37.8% from 30.6% a year earlier.
EBITDA growth despite lower revenue is explained by reduced operating costs. The company cut unit production costs and streamlined administrative expenses. This improved profitability.
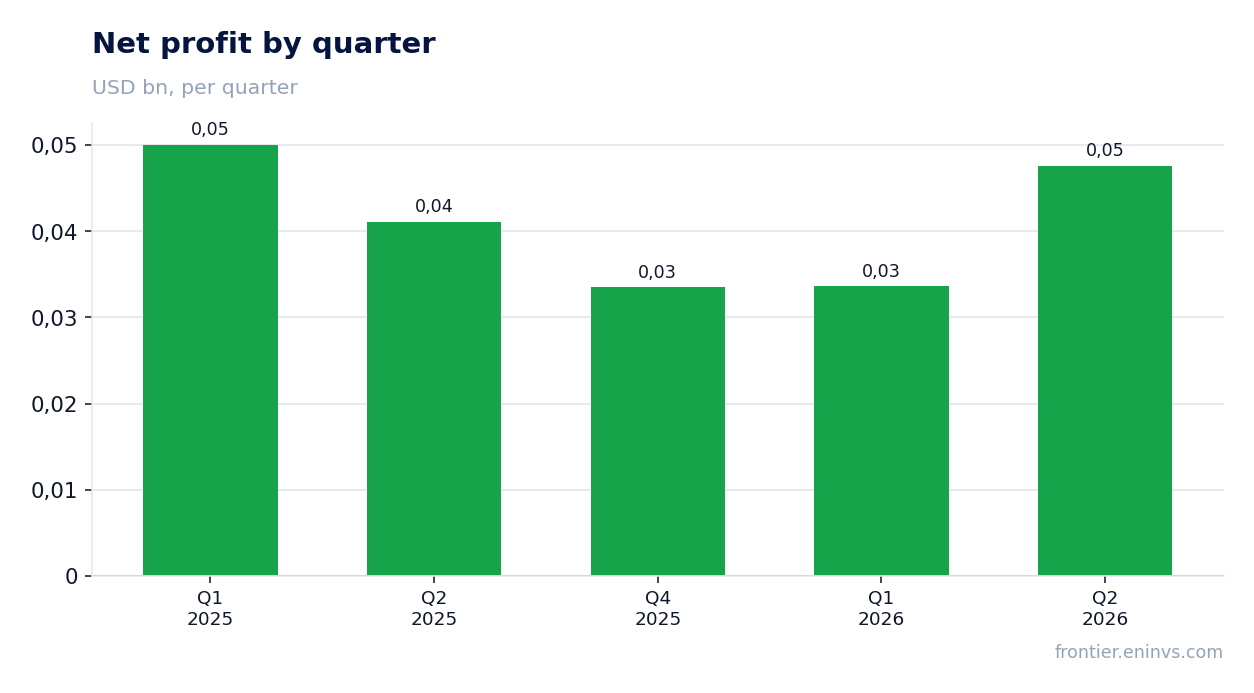
Net profit increased 15.7% year-on-year to $47.6 million, with a net margin of 19.3%
Net profit in Q2 2026 was $47.6 million, up 15.7% year-on-year. The net margin rose to 19.3% from 15.8%.
Net profit growth was mainly driven by higher operating profit and lower interest expenses. The company has no debt burden, which positively affects the financial result.
Operating cash flow reached $96.3 million, exceeding both EBITDA and net profit
Operating cash flow in Q2 2026 was $96.3 million. This exceeds EBITDA ($93.2 million) and net profit ($47.6 million).
The excess of operating cash flow over net profit is due to non-cash items, particularly depreciation, as well as changes in working capital. The company generates sufficient cash flow to fund capital expenditures and shareholder returns.
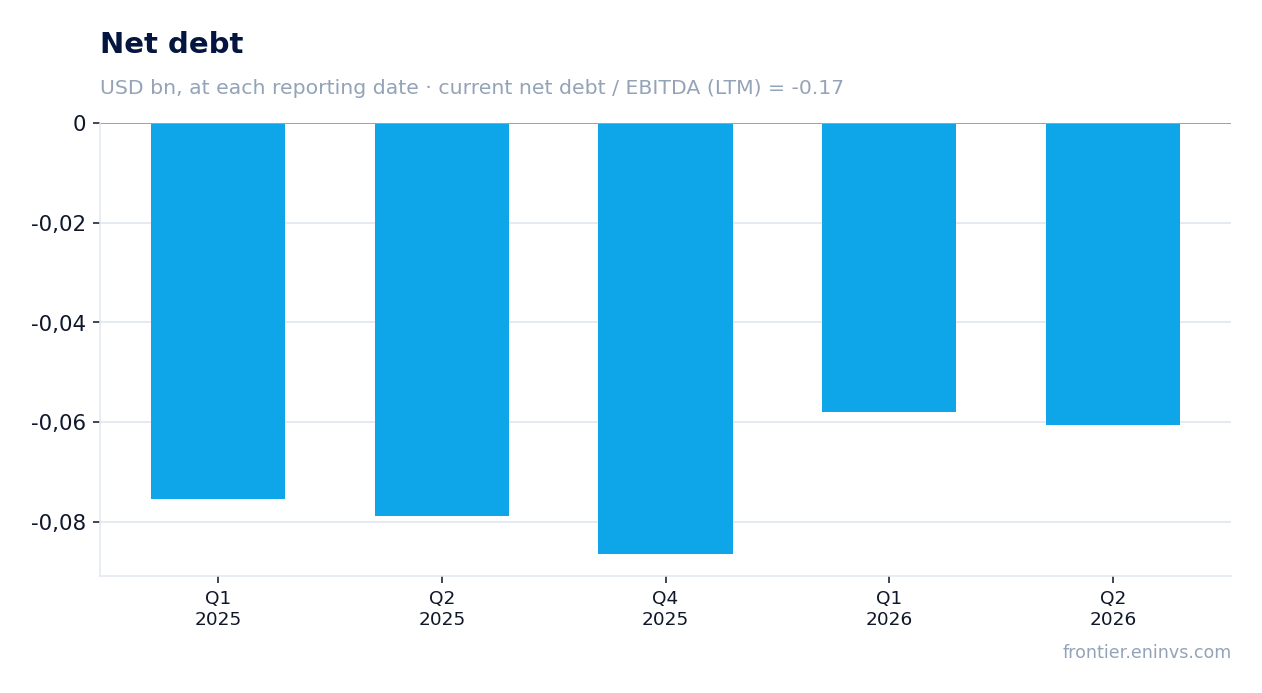
Net debt remains negative at -$60.5 million as of June 30, 2026, or -0.17 LTM EBITDA
Net debt as of June 30, 2026, was -$60.5 million. A negative value means cash and equivalents exceed debt obligations. The net debt to LTM EBITDA ratio is -0.17.
Over the quarter, net debt remained virtually unchanged: -$58.1 million as of March 31, 2026, and -$60.5 million as of June 30, 2026. A year earlier, as of June 30, 2025, the figure was -$78.9 million.
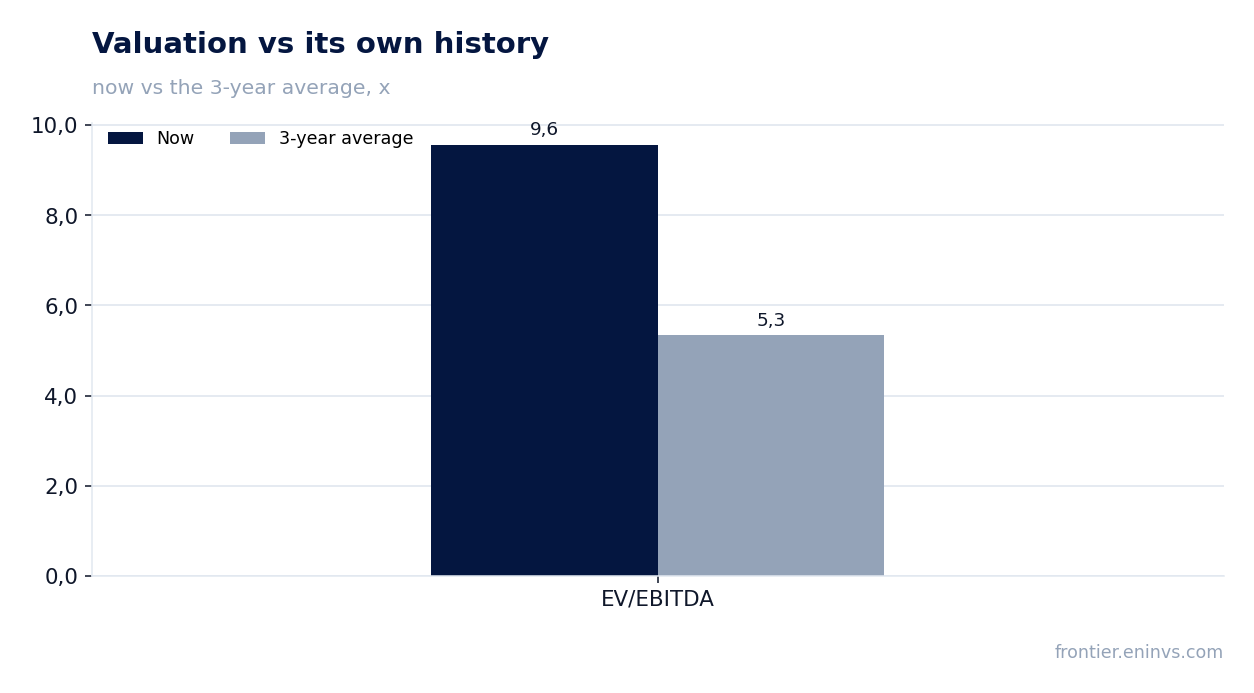
The stock trades at EV/EBITDA of 9.6 versus its own three-year average of 5.3
The current EV/EBITDA multiple is 9.6. This is above its own three-year average of 5.3. Thus, the stock is valued more expensively than its average over the past three years.
The LTM P/E multiple is 19.4. Return on equity (ROE) is 14.4%. Market capitalisation is $3,525.8 million.
The portal model estimates upside to fair value at -3%
According to the portal model, which re-prices EBITDA at current commodity prices using a target EV/EBITDA, the fair value of the share implies -3% upside to the current market price.
The estimate indicates that the stock is trading close to fair value, without significant upside or downside potential.
Valuation on the latest reported figures
| Metric | Value |
|---|---|
| Market cap | 3.53 bn USD |
| P/E (LTM) | 19.4 |
| EV/EBITDA (LTM) | 9.6 |
| P/B | 2.72 |
| Net debt / EBITDA (LTM) | -0.17 |
| Operating cash flow (LTM) | 0.40 bn |
| ROE | 14.4% |
| EV/EBITDA, 3-year average | 5.3 |
Bottom line
In Q2 2026, Athabasca Oil delivered growth in EBITDA and net profit despite lower revenue. The company maintains negative net debt and generates strong operating cash flow. However, the stock trades at EV/EBITDA of 9.6, above its own three-year average of 5.3. The portal model indicates -3% upside. Verdict: neutral.
Open the company's financial profile ATH →
See also: market overview · valuation map · stock screeners