Birchcliff Energy: gas fell 6.2%, but volumes and WTI delivered EBITDA 21.2m above what the price implied
Contents
On 17 November Birchcliff Energy reported results for the third quarter of 2026. Henry Hub averaged 2.893 USD in the period against 3.083 USD a year earlier (–6.2%), while WTI rose 31.7% to 85.4 USD. Revenue reached 133.61m USD (+22.6% year on year), EBITDA 67.58m USD (+54.8%) and net profit 7.41m USD. At the year-ago volumes and costs, our calculation shows the gas price decline alone would have produced EBITDA of just 46.3m USD, so the company earned 21.2m USD more than the price implied. Our conclusion: the share is fairly valued – the portal model puts the upside to fair value at –10%. Our view: the share is fairly valued; upside on the portal model -10%.
Our view: is there upside
Our view in numbers
| Metric | Our read |
|---|---|
| Verdict | Neutral |
| Upside on the portal model | -10% |
| How the model works | spot model: EBITDA re-priced to current commodity prices at the target EV/EBITDA, against market cap |
| Dividend yield, 12m | 1.7% |
| Net debt / EBITDA | 1.06 – low leverage |
| Strongest case for | The company earned EBITDA of 67.58m USD – 21.2m USD more than the gas price implied – with leverage of just 1.06x LTM EBITDA. |
| Strongest case against | The portal model puts the upside to fair value at –10%, and a 1.7% dividend yield gives the holder little income. |
| What would change the view | The verdict would move up to rather attractive if Henry Hub holds above 3.5 USD and EBITDA at current prices exceeds 350m USD. |
Key takeaways
— Gas fell 6.2% while WTI rose 31.7% – the quarter's price backdrop was mixed
— At the year-ago volumes and costs, the price implied EBITDA of 46.3m USD; the company earned 67.6m – a 21.2m gap
— Revenue growth accelerated from 4.1% in the second quarter to 22.6% in the third
— EBITDA margin rose to 50.6% from 40.1% a year earlier, and net profit turned a loss into 7.4m USD
— Leverage of 1.06x LTM EBITDA against 65.2m USD of quarterly operating cash flow is moderate
— A 1.7% dividend yield with payouts the company can only grow if gas holds above 2.893 USD
— On the portal's spot model, EBITDA at current prices is 326.9m USD against 316.1m LTM, and EV/EBITDA is 5.1
Key figures, USD bn
| Metric | Q3 2025 | Q3 2026 | Change |
|---|---|---|---|
| Revenue | 0.11 | 0.13 | +22.6% |
| EBITDA | 0.04 | 0.07 | +54.8% |
| Operating profit | 0.00 | 0.02 | +527.1% |
| Net profit | -0.01 | 0.01 | to profit |
| Operating cash flow | 0.06 | 0.07 | +14.4% |
| EBITDA margin | 40.1% | 50.6% | +10.5 pp |
| Net margin | -9.4% | 5.5% | +14.9 pp |
Gas fell 6.2% while WTI rose 31.7% – the quarter's price backdrop was mixed
Henry Hub averaged 2.893 USD in the third quarter of 2026 against 3.083 USD a year earlier, a decline of 6.2%. Gas also fell 1.1% quarter on quarter from 2.926 USD. As of 17 November the spot price is 3.12 USD, 7.8% above the reported-period average.
Oil moved the other way: WTI averaged 85.4 USD against 64.9 USD a year earlier, up 31.7%. But it weakened 7.9% quarter on quarter from 92.8 USD and now stands at 84.6 USD, 0.9% below the period average. Propane rose 5.8% year on year to 0.73 USD, though it fell 8.6% quarter on quarter; spot is now 1.061 USD, 45.3% above the average.
For Birchcliff this means the main revenue component – gas, about 60% of sales in the portal model – was cheaper in the period than a year earlier. Oil, about 18% of sales, provided support. The price backdrop was therefore neither bad nor good: it was mixed, and the quarter's outcome was not decided by gas alone.
Commodity prices: period average and now
| Benchmark | Year ago | Q3 2026 | YoY | Spot 2026-11-17 |
|---|---|---|---|---|
| Henry Hub, USD | 3,08 | 2,89 | -6,2% | 3,12 |
| WTI, USD | 64,9 | 85,4 | +31,7% | 84,6 |
| Propane, USD | 0,69 | 0,73 | +5,8% | 1,06 |
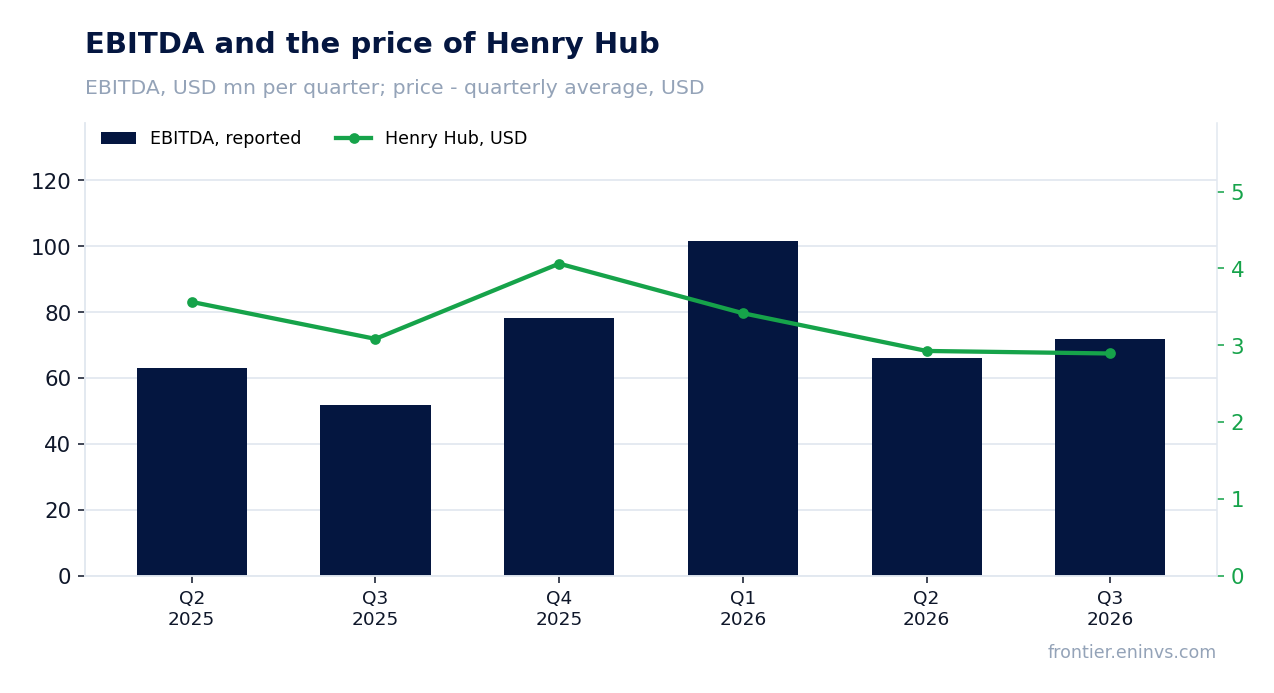
At the year-ago volumes and costs, the price implied EBITDA of 46.3m USD; the company earned 67.6m – a 21.2m gap
Holding the volumes and non-commodity costs of the third quarter of 2025 and moving only prices to the reported period gives revenue of 111.6m USD and EBITDA of 46.3m USD. The company actually reported 133.61m USD of revenue and 67.58m USD of EBITDA. The gap is 21.2m USD of EBITDA, or 45.8% above the implied figure.
The gap cannot be explained by price: on gas, price worked against the company. Its source is volumes and costs, and possibly the realised price against the benchmark and one-off items, but the facts do not disclose the specific causes. We therefore state plainly: the company sold more or at a better unit realisation than a year earlier, and that outweighed the gas price decline.
Against the previous quarter the sign is the same: at the second quarter's volumes and costs, prices would have produced 125.3m USD of revenue and 62.5m USD of EBITDA, against actual 133.61m and 67.58m USD. The gap is +8.3m USD of revenue and +5.1m USD of EBITDA. The excess over the price-implied level has therefore held for two quarters in a row, not just once.
What the prices implied and what the company earned
| Base (Q3 2025) | Implied at period prices | Reported | Reported vs implied | |
|---|---|---|---|---|
| Revenue, USD mn | 108,9 | 111,6 | 133,6 | +19,7% |
| EBITDA, USD mn | 43,7 | 46,3 | 67,6 | +45,8% |
Revenue and EBITDA by quarter
| Period | Measure | bn USD |
|---|---|---|
| Q2 2025 | Revenue | 0.12380100000000001 |
| Q3 2025 | Revenue | 0.108936 |
| Q4 2025 | Revenue | 0.138971 |
| Q1 2026 | Revenue | 0.163825 |
| Q2 2026 | Revenue | 0.128869 |
| Q3 2026 | Revenue | 0.13361 |
| Q2 2025 | EBITDA | 0.06315000000000001 |
| Q3 2025 | EBITDA | 0.052001000000000006 |
| Q4 2025 | EBITDA | 0.07817 |
| Q1 2026 | EBITDA | 0.101765 |
| Q2 2026 | EBITDA | 0.06611700000000001 |
| Q3 2026 | EBITDA | 0.071772 |
EBITDA margin
| Period | Measure | % |
|---|---|---|
| Q2 2025 | EBITDA margin | 51.0 |
| Q3 2025 | EBITDA margin | 47.7 |
| Q4 2025 | EBITDA margin | 56.2 |
| Q1 2026 | EBITDA margin | 62.1 |
| Q2 2026 | EBITDA margin | 51.3 |
| Q3 2026 | EBITDA margin | 53.7 |
Revenue growth accelerated from 4.1% in the second quarter to 22.6% in the third
Revenue in the third quarter of 2026 was 133.61m USD, 22.6% above a year earlier. In the second quarter growth was more modest at 4.1%, to 128.87m USD. The acceleration is clear: the rate rose more than fivefold.
The acceleration coincided with revenue being almost flat quarter on quarter: 128.87m USD in the second quarter against 133.61m USD in the third, a gain of 3.7%. Year on year, therefore, the company is pushing off a weak base – third-quarter 2025 revenue of 108.94m USD. The low base is what produces the high annual rate.
For an investor the rate itself matters less than the fact that it holds while gas falls. Without higher volumes or better realisation, revenue at 2.893 USD would have been lower. The next quarter will show whether that advantage survives with spot at 3.12 USD.
EBITDA margin rose to 50.6% from 40.1% a year earlier, and net profit turned a loss into 7.4m USD
EBITDA in the third quarter was 67.58m USD on revenue of 133.61m USD, a margin of 50.6%. A year earlier, on revenue of 108.94m USD and EBITDA of 52.0m USD, the margin was 40.1%. The 10.5 percentage point rise follows from EBITDA growing 54.8% while revenue grew 22.6%.
Operating profit for the quarter was 20.2m USD against 3.22m USD a year earlier. Net profit was 7.41m USD against a loss of 10.25m USD, a margin of 5.5% against –9.4%. The improvement comes from the operating result, not from one-off items: the facts name no one-off gains or charges.
Such a margin with gas below the year-ago level means the company either cut unit costs or sold more per unit of cost. The facts do not disclose the specific cost line, so we state only what is visible: EBITDA growth outpaced revenue growth more than twofold.
Leverage of 1.06x LTM EBITDA against 65.2m USD of quarterly operating cash flow is moderate
Net debt at 30 September 2026 was 343.53m USD. Against LTM EBITDA of 324.8m USD that is 1.06x. The facts do not disclose the direction of the ratio, so we state the level only: a little over one year's EBITDA.
Operating cash flow for the quarter was 65.18m USD, almost matching EBITDA of 67.58m USD. Capital expenditure was minimal at 0.192m USD for the quarter. The main outflow, judging by scale, is debt service and repayment rather than investment, though the facts do not give the detailed structure.
For a gas company with this debt and this cash flow, the burden does not look threatening: annual EBITDA covers the debt almost entirely. The question is whether EBITDA holds if gas stays near 2.9 USD. At spot of 3.12 USD, the portal model puts net debt to EBITDA at 1.05x.
A 1.7% dividend yield with payouts the company can only grow if gas holds above 2.893 USD
The trailing twelve-month dividend yield is 1.7%. That is modest both for a gas company and against current money-market yields. Payouts are covered by profit: LTM net profit of 87.0m USD on a market capitalisation of 1,324.0m USD gives a P/E of 15.2, meaning the market pays a fairly high price for earnings.
Our estimate of the current-year dividend starts from LTM profit and a payout ratio the facts do not specify. If the company pays out half of LTM profit, the yield would be about 3.3%, double the actual figure. But that is our estimate, not company policy, and it rests on profit earned at higher gas prices.
The main risk to payouts is the gas price. At an average of 2.893 USD the quarter produced 7.4m USD of profit; below 2.8 USD profit could compress and the dividend would have to be cut. For an income buyer 1.7% is little; for a buyer seeking capital growth, valuation and the gas price matter more.
Share price, three years
close, last point 2026-11-16
| Period | Measure | USD per share |
|---|---|---|
| 2025-11-17 | Closing price | 6.889999866485596 |
| 2025-11-18 | Closing price | 7.260000228881836 |
| 2025-11-19 | Closing price | 7.349999904632568 |
| 2025-11-20 | Closing price | 7.340000152587891 |
| 2025-11-21 | Closing price | 7.239999771118164 |
| 2025-11-24 | Closing price | 7.239999771118164 |
| 2025-11-25 | Closing price | 7.449999809265137 |
| 2025-11-26 | Closing price | 7.550000190734863 |
| 2025-11-27 | Closing price | 7.539999961853027 |
| 2025-11-28 | Closing price | 7.860000133514404 |
| 2025-12-01 | Closing price | 7.769999980926514 |
| 2025-12-02 | Closing price | 7.599999904632568 |
| 2025-12-03 | Closing price | 7.78000020980835 |
| 2025-12-04 | Closing price | 7.820000171661377 |
| 2025-12-05 | Closing price | 7.989999771118164 |
| 2025-12-08 | Closing price | 7.71999979019165 |
| 2025-12-09 | Closing price | 7.519999980926514 |
| 2025-12-10 | Closing price | 7.53000020980835 |
| 2025-12-11 | Closing price | 7.440000057220459 |
| 2025-12-12 | Closing price | 7.360000133514404 |
| 2025-12-15 | Closing price | 7.420000076293945 |
| 2025-12-16 | Closing price | 7.190000057220459 |
| 2025-12-17 | Closing price | 7.139999866485596 |
| 2025-12-18 | Closing price | 7.119999885559082 |
| 2025-12-19 | Closing price | 7.269999980926514 |
| 2025-12-22 | Closing price | 7.260000228881836 |
| 2025-12-23 | Closing price | 7.559999942779541 |
| 2025-12-24 | Closing price | 7.449999809265137 |
| 2025-12-29 | Closing price | 7.539999961853027 |
| 2025-12-30 | Closing price | 7.539999961853027 |
| 2025-12-31 | Closing price | 7.46999979019165 |
| 2026-01-02 | Closing price | 7.420000076293945 |
| 2026-01-05 | Closing price | 7.230000019073486 |
| 2026-01-06 | Closing price | 7.139999866485596 |
| 2026-01-07 | Closing price | 7.019999980926514 |
| 2026-01-08 | Closing price | 7.03000020980835 |
| 2026-01-09 | Closing price | 7.130000114440918 |
| 2026-01-12 | Closing price | 7.21999979019165 |
| 2026-01-13 | Closing price | 7.090000152587891 |
| 2026-01-14 | Closing price | 6.880000114440918 |
| 2026-01-15 | Closing price | 6.829999923706055 |
| 2026-01-16 | Closing price | 6.869999885559082 |
| 2026-01-19 | Closing price | 7.010000228881836 |
| 2026-01-20 | Closing price | 7.070000171661377 |
| 2026-01-21 | Closing price | 7.28000020980835 |
| 2026-01-22 | Closing price | 7.119999885559082 |
| 2026-01-23 | Closing price | 7.300000190734863 |
| 2026-01-26 | Closing price | 7.349999904632568 |
| 2026-01-27 | Closing price | 7.320000171661377 |
| 2026-01-28 | Closing price | 7.25 |
| 2026-01-29 | Closing price | 7.289999961853027 |
| 2026-01-30 | Closing price | 7.320000171661377 |
| 2026-02-02 | Closing price | 7.119999885559082 |
| 2026-02-03 | Closing price | 7.119999885559082 |
| 2026-02-04 | Closing price | 7.309999942779541 |
| 2026-02-05 | Closing price | 7.059999942779541 |
| 2026-02-06 | Closing price | 7.139999866485596 |
| 2026-02-09 | Closing price | 7.099999904632568 |
| 2026-02-10 | Closing price | 7.099999904632568 |
| 2026-02-11 | Closing price | 7.199999809265137 |
| 2026-02-12 | Closing price | 6.820000171661377 |
| 2026-02-13 | Closing price | 6.920000076293945 |
| 2026-02-17 | Closing price | 6.889999866485596 |
| 2026-02-18 | Closing price | 7.010000228881836 |
| 2026-02-19 | Closing price | 7.010000228881836 |
| 2026-02-20 | Closing price | 6.940000057220459 |
| 2026-02-23 | Closing price | 6.710000038146973 |
| 2026-02-24 | Closing price | 6.670000076293945 |
| 2026-02-25 | Closing price | 6.590000152587891 |
| 2026-02-26 | Closing price | 6.610000133514404 |
| 2026-02-27 | Closing price | 6.849999904632568 |
| 2026-03-02 | Closing price | 6.800000190734863 |
| 2026-03-03 | Closing price | 6.889999866485596 |
| 2026-03-04 | Closing price | 6.960000038146973 |
| 2026-03-05 | Closing price | 6.949999809265137 |
| 2026-03-06 | Closing price | 7.039999961853027 |
| 2026-03-09 | Closing price | 6.980000019073486 |
| 2026-03-10 | Closing price | 6.940000057220459 |
| 2026-03-11 | Closing price | 7.130000114440918 |
| 2026-03-12 | Closing price | 7.179999828338623 |
| 2026-03-13 | Closing price | 7.190000057220459 |
| 2026-03-16 | Closing price | 7.309999942779541 |
| 2026-03-17 | Closing price | 7.400000095367432 |
| 2026-03-18 | Closing price | 7.380000114440918 |
| 2026-03-19 | Closing price | 7.559999942779541 |
| 2026-03-20 | Closing price | 7.630000114440918 |
| 2026-03-23 | Closing price | 7.75 |
| 2026-03-24 | Closing price | 8.010000228881836 |
| 2026-03-25 | Closing price | 7.650000095367432 |
| 2026-03-26 | Closing price | 7.550000190734863 |
| 2026-03-27 | Closing price | 7.869999885559082 |
| 2026-03-30 | Closing price | 7.809999942779541 |
| 2026-03-31 | Closing price | 7.639999866485596 |
| 2026-04-01 | Closing price | 6.769999980926514 |
| 2026-04-02 | Closing price | 6.71999979019165 |
| 2026-04-06 | Closing price | 6.670000076293945 |
| 2026-04-07 | Closing price | 6.539999961853027 |
| 2026-04-08 | Closing price | 6.179999828338623 |
| 2026-04-09 | Closing price | 6.139999866485596 |
| 2026-04-10 | Closing price | 6.050000190734863 |
| 2026-04-13 | Closing price | 6.210000038146973 |
| 2026-04-14 | Closing price | 6.019999980926514 |
| 2026-04-15 | Closing price | 6.050000190734863 |
| 2026-04-16 | Closing price | 6.03000020980835 |
| 2026-04-17 | Closing price | 5.840000152587891 |
| 2026-04-20 | Closing price | 5.769999980926514 |
| 2026-04-21 | Closing price | 5.789999961853027 |
| 2026-04-22 | Closing price | 5.849999904632568 |
| 2026-04-23 | Closing price | 5.860000133514404 |
| 2026-04-24 | Closing price | 5.869999885559082 |
| 2026-04-27 | Closing price | 6.230000019073486 |
| 2026-04-28 | Closing price | 6.230000019073486 |
| 2026-04-29 | Closing price | 6.369999885559082 |
| 2026-04-30 | Closing price | 6.429999828338623 |
| 2026-05-01 | Closing price | 6.409999847412109 |
| 2026-05-04 | Closing price | 6.510000228881836 |
| 2026-05-05 | Closing price | 6.610000133514404 |
| 2026-05-06 | Closing price | 6.400000095367432 |
| 2026-05-07 | Closing price | 6.400000095367432 |
| 2026-05-08 | Closing price | 6.320000171661377 |
| 2026-05-11 | Closing price | 6.360000133514404 |
| 2026-05-12 | Closing price | 6.429999828338623 |
| 2026-05-13 | Closing price | 6.320000171661377 |
| 2026-05-14 | Closing price | 6.590000152587891 |
| 2026-05-15 | Closing price | 6.590000152587891 |
| 2026-05-19 | Closing price | 6.909999847412109 |
| 2026-05-20 | Closing price | 6.860000133514404 |
| 2026-05-21 | Closing price | 6.849999904632568 |
| 2026-05-22 | Closing price | 6.849999904632568 |
| 2026-05-25 | Closing price | 6.539999961853027 |
| 2026-05-26 | Closing price | 6.420000076293945 |
| 2026-05-27 | Closing price | 6.300000190734863 |
| 2026-05-28 | Closing price | 6.440000057220459 |
| 2026-05-29 | Closing price | 6.440000057220459 |
| 2026-06-01 | Closing price | 6.539999961853027 |
| 2026-06-02 | Closing price | 6.75 |
| 2026-06-03 | Closing price | 6.869999885559082 |
| 2026-06-04 | Closing price | 6.800000190734863 |
| 2026-06-05 | Closing price | 6.460000038146973 |
| 2026-06-08 | Closing price | 6.909999847412109 |
| 2026-06-09 | Closing price | 6.679999828338623 |
| 2026-06-10 | Closing price | 6.789999961853027 |
| 2026-06-11 | Closing price | 6.630000114440918 |
| 2026-06-12 | Closing price | 6.5 |
| 2026-06-15 | Closing price | 6.239999771118164 |
| 2026-06-16 | Closing price | 6.239999771118164 |
| 2026-06-17 | Closing price | 6.28000020980835 |
| 2026-06-18 | Closing price | 6.300000190734863 |
| 2026-06-19 | Closing price | 6.440000057220459 |
| 2026-06-22 | Closing price | 6.480000019073486 |
| 2026-06-23 | Closing price | 6.480000019073486 |
| 2026-06-24 | Closing price | 6.300000190734863 |
| 2026-06-25 | Closing price | 6.300000190734863 |
| 2026-06-26 | Closing price | 6.289999961853027 |
| 2026-06-29 | Closing price | 6.349999904632568 |
| 2026-06-30 | Closing price | 6.190000057220459 |
| 2026-07-02 | Closing price | 6.239999771118164 |
| 2026-07-03 | Closing price | 6.340000152587891 |
| 2026-07-06 | Closing price | 6.289999961853027 |
| 2026-07-07 | Closing price | 6.329999923706055 |
| 2026-07-08 | Closing price | 6.46999979019165 |
| 2026-07-09 | Closing price | 6.360000133514404 |
| 2026-07-10 | Closing price | 6.230000019073486 |
| 2026-07-13 | Closing price | 6.389999866485596 |
| 2026-07-14 | Closing price | 6.340000152587891 |
| 2026-07-15 | Closing price | 6.309999942779541 |
| 2026-07-16 | Closing price | 6.320000171661377 |
| 2026-07-17 | Closing price | 6.300000190734863 |
| 2026-07-20 | Closing price | 6.309999942779541 |
| 2026-07-21 | Closing price | 6.460000038146973 |
| 2026-07-22 | Closing price | 6.550000190734863 |
| 2026-07-23 | Closing price | 6.610000133514404 |
| 2026-07-24 | Closing price | 6.5 |
| 2026-07-27 | Closing price | 6.320000171661377 |
| 2026-07-28 | Closing price | 6.199999809265137 |
| 2026-07-29 | Closing price | 6.329999923706055 |
| 2026-07-30 | Closing price | 6.269999980926514 |
| 2026-07-31 | Closing price | 6.389999866485596 |
| 2026-08-04 | Closing price | 6.21999979019165 |
| 2026-08-05 | Closing price | 6.159999847412109 |
| 2026-08-06 | Closing price | 6.25 |
| 2026-08-07 | Closing price | 6.239999771118164 |
| 2026-08-10 | Closing price | 6.340000152587891 |
| 2026-08-11 | Closing price | 6.409999847412109 |
| 2026-08-12 | Closing price | 6.380000114440918 |
| 2026-08-13 | Closing price | 6.46999979019165 |
| 2026-08-14 | Closing price | 6.389999866485596 |
| 2026-08-17 | Closing price | 6.389999866485596 |
| 2026-08-18 | Closing price | 6.400000095367432 |
| 2026-08-19 | Closing price | 6.340000152587891 |
| 2026-08-20 | Closing price | 6.400000095367432 |
| 2026-08-21 | Closing price | 6.440000057220459 |
| 2026-08-24 | Closing price | 6.380000114440918 |
| 2026-08-25 | Closing price | 6.320000171661377 |
| 2026-08-26 | Closing price | 6.320000171661377 |
| 2026-08-27 | Closing price | 6.449999809265137 |
| 2026-08-28 | Closing price | 6.480000019073486 |
| 2026-08-31 | Closing price | 6.53000020980835 |
| 2026-09-01 | Closing price | 6.630000114440918 |
| 2026-09-02 | Closing price | 6.610000133514404 |
| 2026-09-03 | Closing price | 6.510000228881836 |
| 2026-09-04 | Closing price | 6.5 |
| 2026-09-08 | Closing price | 6.46999979019165 |
| 2026-09-09 | Closing price | 6.349999904632568 |
| 2026-09-10 | Closing price | 6.389999866485596 |
| 2026-09-11 | Closing price | 6.320000171661377 |
| 2026-09-14 | Closing price | 6.389999866485596 |
| 2026-09-15 | Closing price | 6.539999961853027 |
| 2026-09-16 | Closing price | 6.239999771118164 |
| 2026-09-17 | Closing price | 6.289999961853027 |
| 2026-09-18 | Closing price | 6.289999961853027 |
| 2026-09-21 | Closing price | 6.179999828338623 |
| 2026-09-22 | Closing price | 6.190000057220459 |
| 2026-09-23 | Closing price | 6.21999979019165 |
| 2026-09-24 | Closing price | 6.309999942779541 |
| 2026-09-25 | Closing price | 6.300000190734863 |
| 2026-09-28 | Closing price | 6.210000038146973 |
| 2026-09-29 | Closing price | 6.090000152587891 |
| 2026-09-30 | Closing price | 6.199999809265137 |
| 2026-10-01 | Closing price | 6.190000057220459 |
| 2026-10-02 | Closing price | 6.309999942779541 |
| 2026-10-05 | Closing price | 6.480000019073486 |
| 2026-10-06 | Closing price | 6.699999809265137 |
| 2026-10-07 | Closing price | 6.610000133514404 |
| 2026-10-08 | Closing price | 6.699999809265137 |
| 2026-10-09 | Closing price | 6.630000114440918 |
| 2026-10-13 | Closing price | 6.699999809265137 |
| 2026-10-14 | Closing price | 6.590000152587891 |
| 2026-10-15 | Closing price | 6.630000114440918 |
| 2026-10-16 | Closing price | 6.800000190734863 |
| 2026-10-19 | Closing price | 6.75 |
| 2026-10-20 | Closing price | 6.820000171661377 |
| 2026-10-21 | Closing price | 6.769999980926514 |
| 2026-10-22 | Closing price | 6.679999828338623 |
| 2026-10-23 | Closing price | 6.809999942779541 |
| 2026-10-26 | Closing price | 6.980000019073486 |
| 2026-10-27 | Closing price | 7.090000152587891 |
| 2026-10-28 | Closing price | 7.039999961853027 |
| 2026-10-29 | Closing price | 7.139999866485596 |
| 2026-10-30 | Closing price | 7.380000114440918 |
| 2026-11-02 | Closing price | 7.019999980926514 |
| 2026-11-03 | Closing price | 7.119999885559082 |
| 2026-11-04 | Closing price | 6.800000190734863 |
| 2026-11-05 | Closing price | 6.519999980926514 |
| 2026-11-06 | Closing price | 6.570000171661377 |
| 2026-11-09 | Closing price | 6.449999809265137 |
| 2026-11-10 | Closing price | 6.579999923706055 |
| 2026-11-11 | Closing price | 6.78000020980835 |
| 2026-11-12 | Closing price | 6.860000133514404 |
| 2026-11-13 | Closing price | 6.880000114440918 |
| 2026-11-16 | Closing price | 7.03000020980835 |
On the portal's spot model, EBITDA at current prices is 326.9m USD against 316.1m LTM, and EV/EBITDA is 5.1
At current commodity prices – Henry Hub 3.12 USD, WTI 84.6 USD, propane 1.061 USD – the portal's spot model puts annual EBITDA at 326.9m USD against 316.1m USD LTM, 3.4% higher. EV/EBITDA at current prices is 5.1 and net debt to EBITDA is 1.05x.
The historical LTM valuation gives EV/EBITDA of 5.25 and a P/E of 15.2. The facts contain no three-year average, so a comparison with history is not possible. Even so, the market values the company at a little over five times annual EBITDA, which for a gas producer with 32.4 years of reserve life looks neither expensive nor cheap.
The portal model puts the upside to fair value at –10% at current prices. That means even with the higher spot price the share is fairly valued rather than at a discount. Growth requires either a higher gas price or a further cut in unit costs.
Valuation on the latest reported figures
| Metric | Value |
|---|---|
| Market cap | 1.32 bn USD |
| P/E (LTM) | 15.2 |
| EV/EBITDA (LTM) | 5.2 |
| P/B | 0.81 |
| Net debt / EBITDA (LTM) | 1.06 |
| Operating cash flow (LTM) | 0.32 bn |
| ROE | 1.8% |
| Dividend yield (12m) | 1.7% |
Net profit by quarter
| Period | Measure | bn USD |
|---|---|---|
| Q2 2025 | Net profit | −0.010048 |
| Q3 2025 | Net profit | −0.010248 |
| Q4 2025 | Net profit | 0.01952 |
| Q1 2026 | Net profit | 0.050859 |
| Q2 2026 | Net profit | 0.009208000000000001 |
| Q3 2026 | Net profit | 0.007405999999999999 |
Bottom line
The quarter is genuinely strong: EBITDA of 67.58m USD on revenue of 133.61m USD and a 50.6% margin is 21.2m USD more than the gas price implied. But revenue growth of 22.6% rests on a weak year-ago base, and profit of 7.4m USD on a market capitalisation of 1,324.0m USD gives a P/E of 15.2 – the market is already paying for recovery. Leverage of 1.06x LTM EBITDA and quarterly operating cash flow of 65.18m USD leave room, but a 1.7% dividend yield does not compensate for the lack of growth. Our conclusion: the share is fairly valued – the portal model puts the upside to fair value at –10%. Our view: the share is fairly valued; upside on the portal model -10%.