Caledonia Mining: gold rose 23% but EBITDA fell 29% – the gap sits in costs and volumes
Contents
On 17 November Caledonia Mining released its third-quarter 2026 results. The average gold price in the period was USD 4,268 per ounce against USD 3,459 a year earlier (+23.4%), yet revenue rose only 10.5% to USD 78.9m, EBITDA fell 28.7% to USD 24.0m and net profit dropped 80.5% to USD 2.9m. On our calculation, holding year-ago volumes and costs and moving only the price would have produced revenue of USD 88.2m and EBITDA of USD 50.4m; reported EBITDA is USD 26.4m below that, and the gap is explained by volumes and unit costs, not by price. Our verdict: rather unattractive – on the portal's model the share sits 51% below fair value calculated at current gold prices. Our view: the share is rather unattractive at the current price; upside on the portal model -51%.
Our view: is there upside
Our view in numbers
| Metric | Our read |
|---|---|
| Verdict | Rather unattractive |
| Upside on the portal model | -51% |
| How the model works | spot model: EBITDA re-priced to current commodity prices at the target EV/EBITDA, against market cap |
| Dividend yield, 12m | 1.4% |
| Net debt / EBITDA | -0.31 – net cash |
| Strongest case for | Net cash of USD 45.5m and EV/EBITDA of 4.4 at current prices provide a margin of safety most gold miners lack. |
| Strongest case against | With gold up 23.4%, EBITDA fell 28.7%, and on the portal's model the share sits 51% below fair value. |
| What would change the view | A return of gold spot to USD 4,268 per ounce and a recovery in unit costs would move the verdict one step higher. |
Key takeaways
— Gold averaged USD 4,268 per ounce in the quarter – 23.4% above a year earlier but already 5.5% below the previous quarter
— On our calculation, price alone at year-ago volumes and costs would have produced EBITDA of USD 50.4m – USD 24.0m was actually earned
— Revenue rose 10.5% while gold was up 23.4% – so less metal was sold or the realised price lagged the benchmark
— The EBITDA margin compressed from 47.2% to 30.4%: the price gain did not reach profit because of unit costs and volumes
— Net profit of USD 2.9m against operating profit of USD 38.5m – a USD 35.6m gap formed below the operating line
— The company holds net cash of USD 45.5m and net debt/EBITDA LTM of -0.31 – the balance sheet creates no pressure
— On the portal's spot model, EBITDA at today's gold prices is USD 78.1m against USD 123.5m LTM – the current metal price no longer supports past earnings
Key figures, USD bn
| Metric | Q3 2025 | Q3 2026 | Change |
|---|---|---|---|
| Revenue | 0.07 | 0.08 | +10.5% |
| EBITDA | 0.03 | 0.02 | -28.7% |
| Operating profit | 0.03 | 0.04 | +30.5% |
| Net profit | 0.02 | 0.00 | -80.5% |
| Operating cash flow | 0.01 | 0.01 | -1.0% |
| Capex | 0.01 | 0.01 | +114.9% |
| EBITDA margin | 47.2% | 30.4% | -16.8 pp |
| Net margin | 21.2% | 3.7% | -17.5 pp |
Gold averaged USD 4,268 per ounce in the quarter – 23.4% above a year earlier but already 5.5% below the previous quarter
Gold is the main external driver for Caledonia Mining: the metal accounts for 100% of revenue in the portal's model. In the third quarter of 2026 the average price was USD 4,268 per ounce against USD 3,459 a year earlier, up 23.4%. Against the previous quarter the price fell 5.5% from USD 4,514.
Spot on 17 November was USD 3,867, 9.4% below the reported-period average. The quarterly results were therefore built on prices the market no longer confirms: the next report will come against weaker metal unless spot recovers.
Commodity prices: period average and now
| Benchmark | Year ago | Q3 2026 | YoY | Spot 2026-11-17 |
|---|---|---|---|---|
| Gold, USD | 3 459 | 4 268 | +23,4% | 3 867 |
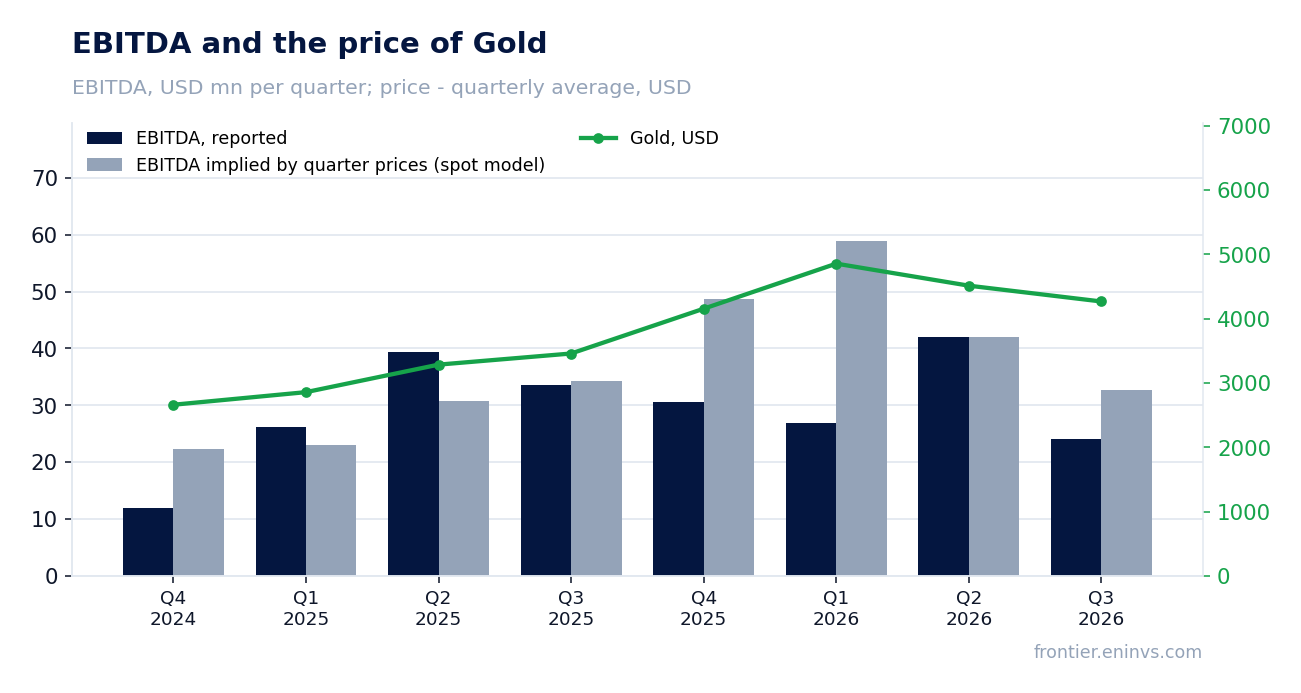
On our calculation, price alone at year-ago volumes and costs would have produced EBITDA of USD 50.4m – USD 24.0m was actually earned
On our calculation, taking third-quarter 2025 volumes and non-commodity costs and substituting only the reported-period gold price would have produced revenue of USD 88.2m and EBITDA of USD 50.4m. Actual revenue was USD 78.9m and EBITDA USD 24.0m.
The revenue gap is USD 9.2m, or 10.5%; the EBITDA gap is USD 26.4m, or 52.4%. The metal price was higher, so the entire gap comes from sales volumes, the realised price against the benchmark and unit costs. Profit did not rise with gold – the company earned less than the price allowed.
What the prices implied and what the company earned
| Base (Q3 2025) | Implied at period prices | Reported | Reported vs implied | |
|---|---|---|---|---|
| Revenue, USD mn | 71,4 | 88,2 | 78,9 | -10,5% |
| EBITDA, USD mn | 33,7 | 50,4 | 24,0 | -52,4% |
| EBITDA, portal spot model, USD mn | — | 32,8 | 24,0 | -26,7% |
Revenue and EBITDA by quarter
| Period | Measure | bn USD |
|---|---|---|
| Q4 2024 | Revenue | 0.051924000000000005 |
| Q1 2025 | Revenue | 0.056178 |
| Q2 2025 | Revenue | 0.06530899999999999 |
| Q3 2025 | Revenue | 0.07144 |
| Q4 2025 | Revenue | 0.07473600000000001 |
| Q1 2026 | Revenue | 0.066433 |
| Q2 2026 | Revenue | 0.075914 |
| Q3 2026 | Revenue | 0.078932 |
| Q4 2024 | EBITDA | 0.011915000000000004 |
| Q1 2025 | EBITDA | 0.026239 |
| Q2 2025 | EBITDA | 0.03946 |
| Q3 2025 | EBITDA | 0.033491 |
| Q4 2025 | EBITDA | 0.030601 |
| Q1 2026 | EBITDA | 0.026928999999999998 |
| Q2 2026 | EBITDA | 0.041971999999999995 |
| Q3 2026 | EBITDA | 0.02401 |
EBITDA margin
| Period | Measure | % |
|---|---|---|
| Q4 2024 | EBITDA margin | 22.9 |
| Q1 2025 | EBITDA margin | 46.7 |
| Q2 2025 | EBITDA margin | 60.4 |
| Q3 2025 | EBITDA margin | 46.9 |
| Q4 2025 | EBITDA margin | 40.9 |
| Q1 2026 | EBITDA margin | 40.5 |
| Q2 2026 | EBITDA margin | 55.3 |
| Q3 2026 | EBITDA margin | 30.4 |
Revenue rose 10.5% while gold was up 23.4% – so less metal was sold or the realised price lagged the benchmark
Reported-quarter revenue was USD 78.9m against USD 71.4m a year earlier, up 10.5%. That is half the pace of the gold price gain over the same period. The slowdown is visible in the sequence too: revenue grew 16.2% in the previous quarter and 10.5% in the reported one.
With the metal price up 23.4%, such revenue growth means fewer ounces were sold or the average realised price lagged the benchmark. In figures: on our calculation price alone should have added USD 16.7m to revenue; the actual increase was USD 7.5m. Volumes and realisation absorbed the rest.
The EBITDA margin compressed from 47.2% to 30.4%: the price gain did not reach profit because of unit costs and volumes
The EBITDA margin in the reported quarter was 30.4% against 47.2% a year earlier. EBITDA fell 28.7% to USD 24.0m while revenue rose 10.5%. This is a direct consequence of the gap between price and costs: with more expensive metal, less profit is earned per ounce.
Operating profit was USD 38.5m – above EBITDA, which is unusual and points to items below the operating line shaping the difference. The margin did not compress because of price: price was in the company's favour. The cause lies in unit costs and volumes, not in realisation.
Net profit of USD 2.9m against operating profit of USD 38.5m – a USD 35.6m gap formed below the operating line
Reported-quarter net profit was USD 2.9m against USD 15.1m a year earlier, down 80.5%. Operating profit was USD 38.5m, so USD 35.6m was absorbed between operating and net profit.
That gap is not explained by operations: it is formed by financial items, taxes and one-off charges below the operating line. For a shareholder this means earnings per share in the period reflect neither the gold price nor production results – they were set by items unrelated to mining.
The company holds net cash of USD 45.5m and net debt/EBITDA LTM of -0.31 – the balance sheet creates no pressure
As of 30 September 2026 the company's net cash position was USD 45.5m and net debt/EBITDA LTM was -0.31. A negative value means cash exceeds debt: the balance sheet creates no pressure on profit through interest.
Reported-quarter operating cash flow was USD 13.6m and capital expenditure USD 13.6m. Free cash flow is close to zero: the company reinvests almost all operating cash flow into sustaining production. With a net cash position this is acceptable, but it leaves no room for dividends above the current level.
Share price, three years
close, last point 2026-11-16
| Period | Measure | USD per share |
|---|---|---|
| 2025-11-17 | Closing price | 28.889999389648438 |
| 2025-11-18 | Closing price | 28.280000686645508 |
| 2025-11-19 | Closing price | 28.219999313354492 |
| 2025-11-20 | Closing price | 27.1200008392334 |
| 2025-11-21 | Closing price | 26.989999771118164 |
| 2025-11-24 | Closing price | 28.200000762939453 |
| 2025-11-25 | Closing price | 28.93000030517578 |
| 2025-11-26 | Closing price | 30.59000015258789 |
| 2025-11-28 | Closing price | 30.809999465942383 |
| 2025-12-01 | Closing price | 26.3700008392334 |
| 2025-12-02 | Closing price | 24.229999542236328 |
| 2025-12-03 | Closing price | 24.93000030517578 |
| 2025-12-04 | Closing price | 25.15999984741211 |
| 2025-12-05 | Closing price | 24.170000076293945 |
| 2025-12-08 | Closing price | 24.139999389648438 |
| 2025-12-09 | Closing price | 24.709999084472656 |
| 2025-12-10 | Closing price | 24.469999313354492 |
| 2025-12-11 | Closing price | 25.579999923706055 |
| 2025-12-12 | Closing price | 25.549999237060547 |
| 2025-12-15 | Closing price | 23.719999313354492 |
| 2025-12-16 | Closing price | 24.09000015258789 |
| 2025-12-17 | Closing price | 24.520000457763672 |
| 2025-12-18 | Closing price | 23.959999084472656 |
| 2025-12-19 | Closing price | 26.8799991607666 |
| 2025-12-22 | Closing price | 26.56999969482422 |
| 2025-12-23 | Closing price | 27.170000076293945 |
| 2025-12-24 | Closing price | 27.09000015258789 |
| 2025-12-26 | Closing price | 27.8799991607666 |
| 2025-12-29 | Closing price | 26.1299991607666 |
| 2025-12-30 | Closing price | 26.739999771118164 |
| 2025-12-31 | Closing price | 26.170000076293945 |
| 2026-01-02 | Closing price | 26.329999923706055 |
| 2026-01-05 | Closing price | 27.15999984741211 |
| 2026-01-06 | Closing price | 28.739999771118164 |
| 2026-01-07 | Closing price | 28.760000228881836 |
| 2026-01-08 | Closing price | 29.15999984741211 |
| 2026-01-09 | Closing price | 29.18000030517578 |
| 2026-01-12 | Closing price | 32.630001068115234 |
| 2026-01-13 | Closing price | 32.849998474121094 |
| 2026-01-14 | Closing price | 32.40999984741211 |
| 2026-01-15 | Closing price | 26.93000030517578 |
| 2026-01-16 | Closing price | 27.219999313354492 |
| 2026-01-20 | Closing price | 27.5 |
| 2026-01-21 | Closing price | 29.1200008392334 |
| 2026-01-22 | Closing price | 29.610000610351562 |
| 2026-01-23 | Closing price | 31.399999618530273 |
| 2026-01-26 | Closing price | 31.56999969482422 |
| 2026-01-27 | Closing price | 30.979999542236328 |
| 2026-01-28 | Closing price | 32.33000183105469 |
| 2026-01-29 | Closing price | 30.75 |
| 2026-01-30 | Closing price | 27.440000534057617 |
| 2026-02-02 | Closing price | 28.100000381469727 |
| 2026-02-03 | Closing price | 29.579999923706055 |
| 2026-02-04 | Closing price | 28.530000686645508 |
| 2026-02-05 | Closing price | 26.530000686645508 |
| 2026-02-06 | Closing price | 28.459999084472656 |
| 2026-02-09 | Closing price | 29.8799991607666 |
| 2026-02-10 | Closing price | 29.600000381469727 |
| 2026-02-11 | Closing price | 30.389999389648438 |
| 2026-02-12 | Closing price | 27.700000762939453 |
| 2026-02-13 | Closing price | 30.0 |
| 2026-02-17 | Closing price | 28.110000610351562 |
| 2026-02-18 | Closing price | 28.309999465942383 |
| 2026-02-19 | Closing price | 28.610000610351562 |
| 2026-02-20 | Closing price | 30.219999313354492 |
| 2026-02-23 | Closing price | 30.780000686645508 |
| 2026-02-24 | Closing price | 30.729999542236328 |
| 2026-02-25 | Closing price | 31.290000915527344 |
| 2026-02-26 | Closing price | 32.59000015258789 |
| 2026-02-27 | Closing price | 31.739999771118164 |
| 2026-03-02 | Closing price | 31.8700008392334 |
| 2026-03-03 | Closing price | 29.790000915527344 |
| 2026-03-04 | Closing price | 29.299999237060547 |
| 2026-03-05 | Closing price | 27.200000762939453 |
| 2026-03-06 | Closing price | 25.979999542236328 |
| 2026-03-09 | Closing price | 26.31999969482422 |
| 2026-03-10 | Closing price | 26.100000381469727 |
| 2026-03-11 | Closing price | 26.239999771118164 |
| 2026-03-12 | Closing price | 26.010000228881836 |
| 2026-03-13 | Closing price | 25.229999542236328 |
| 2026-03-16 | Closing price | 25.549999237060547 |
| 2026-03-17 | Closing price | 24.850000381469727 |
| 2026-03-18 | Closing price | 23.579999923706055 |
| 2026-03-19 | Closing price | 22.15999984741211 |
| 2026-03-20 | Closing price | 21.440000534057617 |
| 2026-03-23 | Closing price | 22.270000457763672 |
| 2026-03-24 | Closing price | 22.31999969482422 |
| 2026-03-25 | Closing price | 22.739999771118164 |
| 2026-03-26 | Closing price | 21.56999969482422 |
| 2026-03-27 | Closing price | 22.270000457763672 |
| 2026-03-30 | Closing price | 22.040000915527344 |
| 2026-03-31 | Closing price | 22.59000015258789 |
| 2026-04-01 | Closing price | 23.530000686645508 |
| 2026-04-02 | Closing price | 23.670000076293945 |
| 2026-04-06 | Closing price | 23.93000030517578 |
| 2026-04-07 | Closing price | 23.969999313354492 |
| 2026-04-08 | Closing price | 24.579999923706055 |
| 2026-04-09 | Closing price | 24.889999389648438 |
| 2026-04-10 | Closing price | 25.34000015258789 |
| 2026-04-13 | Closing price | 25.3799991607666 |
| 2026-04-14 | Closing price | 25.790000915527344 |
| 2026-04-15 | Closing price | 25.06999969482422 |
| 2026-04-16 | Closing price | 25.469999313354492 |
| 2026-04-17 | Closing price | 26.190000534057617 |
| 2026-04-20 | Closing price | 26.139999389648438 |
| 2026-04-21 | Closing price | 24.350000381469727 |
| 2026-04-22 | Closing price | 24.670000076293945 |
| 2026-04-23 | Closing price | 24.600000381469727 |
| 2026-04-24 | Closing price | 25.260000228881836 |
| 2026-04-27 | Closing price | 24.329999923706055 |
| 2026-04-28 | Closing price | 22.850000381469727 |
| 2026-04-29 | Closing price | 22.59000015258789 |
| 2026-04-30 | Closing price | 22.899999618530273 |
| 2026-05-01 | Closing price | 22.6200008392334 |
| 2026-05-04 | Closing price | 21.309999465942383 |
| 2026-05-05 | Closing price | 22.1200008392334 |
| 2026-05-06 | Closing price | 22.770000457763672 |
| 2026-05-07 | Closing price | 23.350000381469727 |
| 2026-05-08 | Closing price | 23.920000076293945 |
| 2026-05-11 | Closing price | 24.280000686645508 |
| 2026-05-12 | Closing price | 24.969999313354492 |
| 2026-05-13 | Closing price | 24.75 |
| 2026-05-14 | Closing price | 23.920000076293945 |
| 2026-05-15 | Closing price | 23.040000915527344 |
| 2026-05-18 | Closing price | 23.690000534057617 |
| 2026-05-19 | Closing price | 23.1200008392334 |
| 2026-05-20 | Closing price | 22.959999084472656 |
| 2026-05-21 | Closing price | 23.09000015258789 |
| 2026-05-22 | Closing price | 22.799999237060547 |
| 2026-05-26 | Closing price | 23.639999389648438 |
| 2026-05-27 | Closing price | 23.110000610351562 |
| 2026-05-28 | Closing price | 23.709999084472656 |
| 2026-05-29 | Closing price | 23.760000228881836 |
| 2026-06-01 | Closing price | 22.309999465942383 |
| 2026-06-02 | Closing price | 21.420000076293945 |
| 2026-06-03 | Closing price | 20.850000381469727 |
| 2026-06-04 | Closing price | 21.299999237060547 |
| 2026-06-05 | Closing price | 19.950000762939453 |
| 2026-06-08 | Closing price | 19.690000534057617 |
| 2026-06-09 | Closing price | 19.0 |
| 2026-06-10 | Closing price | 18.75 |
| 2026-06-11 | Closing price | 19.469999313354492 |
| 2026-06-12 | Closing price | 20.18000030517578 |
| 2026-06-15 | Closing price | 20.979999542236328 |
| 2026-06-16 | Closing price | 21.40999984741211 |
| 2026-06-17 | Closing price | 20.520000457763672 |
| 2026-06-18 | Closing price | 20.860000610351562 |
| 2026-06-22 | Closing price | 20.610000610351562 |
| 2026-06-23 | Closing price | 20.200000762939453 |
| 2026-06-24 | Closing price | 19.59000015258789 |
| 2026-06-25 | Closing price | 19.489999771118164 |
| 2026-06-26 | Closing price | 19.809999465942383 |
| 2026-06-29 | Closing price | 19.43000030517578 |
| 2026-06-30 | Closing price | 19.100000381469727 |
| 2026-07-01 | Closing price | 19.25 |
| 2026-07-02 | Closing price | 20.09000015258789 |
| 2026-07-06 | Closing price | 19.31999969482422 |
| 2026-07-07 | Closing price | 18.90999984741211 |
| 2026-07-08 | Closing price | 18.280000686645508 |
| 2026-07-09 | Closing price | 19.0 |
| 2026-07-10 | Closing price | 17.760000228881836 |
| 2026-07-13 | Closing price | 17.329999923706055 |
| 2026-07-14 | Closing price | 17.049999237060547 |
| 2026-07-15 | Closing price | 17.34000015258789 |
| 2026-07-16 | Closing price | 17.1200008392334 |
| 2026-07-17 | Closing price | 16.979999542236328 |
| 2026-07-20 | Closing price | 16.790000915527344 |
| 2026-07-21 | Closing price | 18.260000228881836 |
| 2026-07-22 | Closing price | 18.6200008392334 |
| 2026-07-23 | Closing price | 18.530000686645508 |
| 2026-07-24 | Closing price | 18.65999984741211 |
| 2026-07-27 | Closing price | 18.90999984741211 |
| 2026-07-28 | Closing price | 18.670000076293945 |
| 2026-07-29 | Closing price | 18.200000762939453 |
| 2026-07-30 | Closing price | 18.8700008392334 |
| 2026-07-31 | Closing price | 18.389999389648438 |
| 2026-08-03 | Closing price | 18.81999969482422 |
| 2026-08-04 | Closing price | 19.350000381469727 |
| 2026-08-05 | Closing price | 20.690000534057617 |
| 2026-08-06 | Closing price | 20.31999969482422 |
| 2026-08-07 | Closing price | 21.75 |
| 2026-08-10 | Closing price | 22.729999542236328 |
| 2026-08-11 | Closing price | 22.90999984741211 |
| 2026-08-12 | Closing price | 22.84000015258789 |
| 2026-08-13 | Closing price | 22.739999771118164 |
| 2026-08-14 | Closing price | 22.469999313354492 |
| 2026-08-17 | Closing price | 23.450000762939453 |
| 2026-08-18 | Closing price | 23.06999969482422 |
| 2026-08-19 | Closing price | 24.350000381469727 |
| 2026-08-20 | Closing price | 24.90999984741211 |
| 2026-08-21 | Closing price | 24.770000457763672 |
| 2026-08-24 | Closing price | 25.0 |
| 2026-08-25 | Closing price | 25.290000915527344 |
| 2026-08-26 | Closing price | 24.899999618530273 |
| 2026-08-27 | Closing price | 25.510000228881836 |
| 2026-08-28 | Closing price | 25.6299991607666 |
| 2026-08-31 | Closing price | 25.309999465942383 |
| 2026-09-01 | Closing price | 25.06999969482422 |
| 2026-09-02 | Closing price | 25.610000610351562 |
| 2026-09-03 | Closing price | 26.31999969482422 |
| 2026-09-04 | Closing price | 26.329999923706055 |
| 2026-09-08 | Closing price | 26.0 |
| 2026-09-09 | Closing price | 25.979999542236328 |
| 2026-09-10 | Closing price | 25.360000610351562 |
| 2026-09-11 | Closing price | 25.700000762939453 |
| 2026-09-14 | Closing price | 25.219999313354492 |
| 2026-09-15 | Closing price | 24.780000686645508 |
| 2026-09-16 | Closing price | 24.139999389648438 |
| 2026-09-17 | Closing price | 24.270000457763672 |
| 2026-09-18 | Closing price | 24.110000610351562 |
| 2026-09-21 | Closing price | 24.139999389648438 |
| 2026-09-22 | Closing price | 24.940000534057617 |
| 2026-09-23 | Closing price | 24.1299991607666 |
| 2026-09-24 | Closing price | 23.8700008392334 |
| 2026-09-25 | Closing price | 23.84000015258789 |
| 2026-09-28 | Closing price | 23.299999237060547 |
| 2026-09-29 | Closing price | 23.420000076293945 |
| 2026-09-30 | Closing price | 23.540000915527344 |
| 2026-10-01 | Closing price | 23.770000457763672 |
| 2026-10-02 | Closing price | 24.010000228881836 |
| 2026-10-05 | Closing price | 24.34000015258789 |
| 2026-10-06 | Closing price | 24.84000015258789 |
| 2026-10-07 | Closing price | 24.149999618530273 |
| 2026-10-08 | Closing price | 24.40999984741211 |
| 2026-10-09 | Closing price | 23.75 |
| 2026-10-12 | Closing price | 24.079999923706055 |
| 2026-10-13 | Closing price | 23.729999542236328 |
| 2026-10-14 | Closing price | 23.3799991607666 |
| 2026-10-15 | Closing price | 23.700000762939453 |
| 2026-10-16 | Closing price | 23.540000915527344 |
| 2026-10-19 | Closing price | 23.40999984741211 |
| 2026-10-20 | Closing price | 23.209999084472656 |
| 2026-10-21 | Closing price | 22.790000915527344 |
| 2026-10-22 | Closing price | 21.860000610351562 |
| 2026-10-23 | Closing price | 21.260000228881836 |
| 2026-10-26 | Closing price | 21.3700008392334 |
| 2026-10-27 | Closing price | 21.809999465942383 |
| 2026-10-28 | Closing price | 21.770000457763672 |
| 2026-10-29 | Closing price | 21.399999618530273 |
| 2026-10-30 | Closing price | 20.25 |
| 2026-11-02 | Closing price | 20.010000228881836 |
| 2026-11-03 | Closing price | 19.020000457763672 |
| 2026-11-04 | Closing price | 20.610000610351562 |
| 2026-11-05 | Closing price | 21.229999542236328 |
| 2026-11-06 | Closing price | 21.299999237060547 |
| 2026-11-09 | Closing price | 21.920000076293945 |
| 2026-11-10 | Closing price | 20.950000762939453 |
| 2026-11-11 | Closing price | 20.0 |
| 2026-11-12 | Closing price | 20.15999984741211 |
| 2026-11-13 | Closing price | 20.969999313354492 |
| 2026-11-16 | Closing price | 20.25 |
On the portal's spot model, EBITDA at today's gold prices is USD 78.1m against USD 123.5m LTM – the current metal price no longer supports past earnings
On the portal's spot model, at today's gold prices annual EBITDA is USD 78.1m against USD 123.5m over the last twelve months – 36.8% less. LTM reflects past, higher prices; the current metal price yields materially lower profit.
On that EBITDA the EV/EBITDA at current prices is 4.4 and net cash to EBITDA is -0.58. Reserve life is 8.1 years at the current production rate. That is a moderate valuation for a gold miner, but it is built on earnings already below their historical level.
Valuation on the latest reported figures
| Metric | Value |
|---|---|
| Market cap | 0.39 bn USD |
| P/E (LTM) | 7.3 |
| EV/EBITDA (LTM) | 2.8 |
| P/B | 1.83 |
| Net debt / EBITDA (LTM) | -0.31 |
| Operating cash flow (LTM) | 0.08 bn |
| ROE | 4.0% |
| Dividend yield (12m) | 1.4% |
Net profit by quarter
| Period | Measure | bn USD |
|---|---|---|
| Q4 2024 | Net profit | 0.005072000000000001 |
| Q1 2025 | Net profit | 0.008915 |
| Q2 2025 | Net profit | 0.020487 |
| Q3 2025 | Net profit | 0.01512 |
| Q4 2025 | Net profit | 0.010698000000000001 |
| Q1 2026 | Net profit | 0.015853 |
| Q2 2026 | Net profit | 0.023806 |
| Q3 2026 | Net profit | 0.002941 |
Bottom line
The balance sheet remains the strong point: net cash of USD 45.5m and net debt/EBITDA of -0.31. Operationally the quarter is weak: with gold up 23.4%, EBITDA fell 28.7%, the margin compressed from 47.2% to 30.4%, and net profit of USD 2.9m is not comparable with operating profit of USD 38.5m. On the portal's model the share sits 51% below fair value calculated at current prices, and that outweighs the moderate EV/EBITDA of 4.4 at current prices. Our verdict: rather unattractive – on the portal's model the downside is 51%. Our view: the share is rather unattractive at the current price; upside on the portal model -51%.