Gold Resource Corporation: gold and silver rallied, yet EBITDA is half of what last year's prices implied
Contents

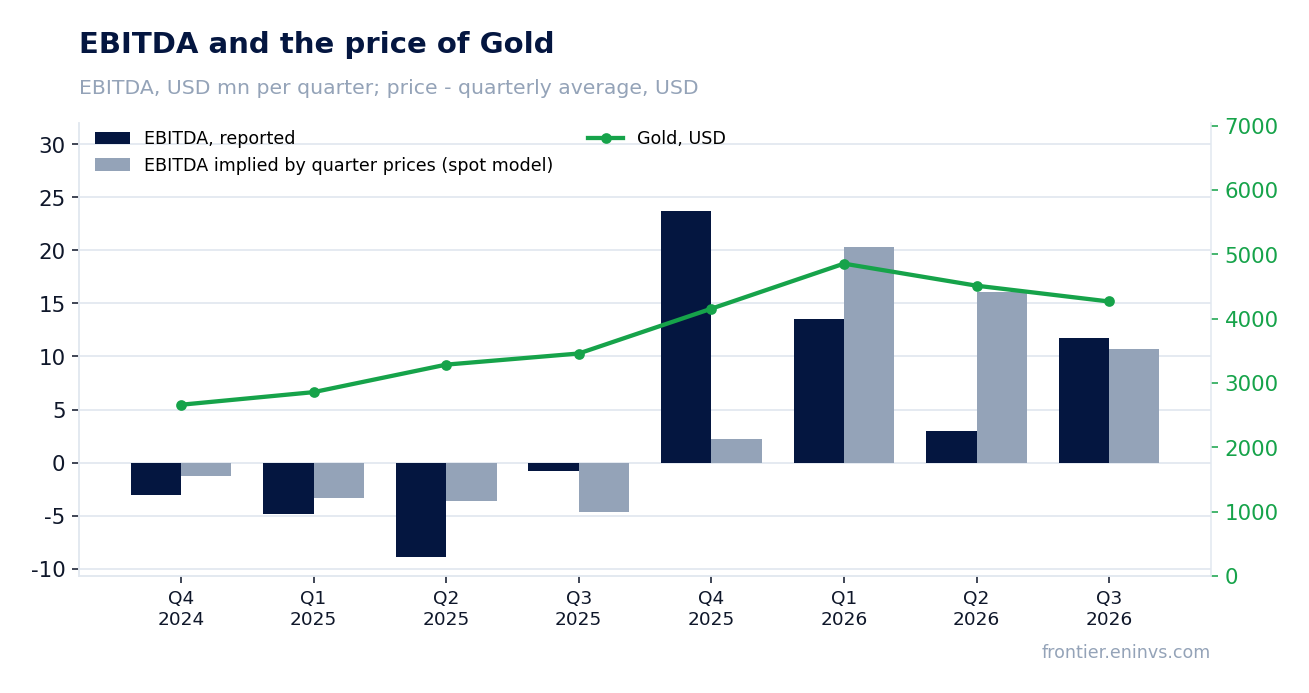
Gold Resource Corporation reported third-quarter 2026 results. The average gold price in the period was 4268 dollars per ounce against 3459 a year earlier (+23.4%), silver 62.8 against 39.9 dollars (+57.6%). At the year-ago quarter's volumes and costs and only the new prices, our calculation puts revenue at 34.5 million dollars and EBITDA at 8.8 million; the company reported revenue of 57.06 million and EBITDA of 11.733 million, 22.5 and 2.9 million above the price-implied figure respectively. Our conclusion: the share is rather unattractive – the portal model puts its upside to fair value at minus 81%. Our view: the share is rather unattractive at the current price; upside on the portal model -81%.
Our view: is there upside
Our view in numbers
| Metric | Our read |
|---|---|
| Verdict | Rather unattractive |
| Upside on the portal model | -81% |
| How the model works | spot model: EBITDA re-priced to current commodity prices at the target EV/EBITDA, against market cap |
| Net debt / EBITDA | -3.14 – net cash |
| Strongest case for | Net cash of 163.158 million dollars against a market capitalisation of 213.5 million means the enterprise is worth about 50 million, and trailing EV/EBITDA is 0.97 – the market values the business at little more than the cash on its balance sheet. |
| Strongest case against | On the portal model annual EBITDA at current prices falls to 1.7 million against 56.8 million over the last twelve months, EV/EBITDA is 30.5, and the share's upside to fair value is minus 81%. |
| What would change the view | A return of gold to 4268 dollars and silver to 62.8 dollars – the reported-period averages – would lift EBITDA at current prices towards the reported level and move the verdict one step up, to neutral. |
Key takeaways
— Gold and silver cost 23.4% and 57.6% more in the reported quarter than a year earlier, but spot is already 17.2% and 34.4% below the period average
— Revenue of 57.06 million dollars is 22.5 million above what year-ago volumes at these prices would have produced – the gap comes from volumes and realised prices, not the market alone
— EBITDA of 11.733 million is only 2.9 million above the 8.8 million price-implied figure, so the price rally barely reached profit
— An operating loss of 21.232 million alongside positive EBITDA means depreciation of 33 million absorbs the entire operating result
— A net loss of 10.237 million against EBITDA of 11.733 million – items outside EBITDA pushed the bottom line below the operating result
— Net cash of 163.158 million dollars against trailing-twelve-month EBITDA of 52.0 million gives a ratio of minus 3.14 – the balance sheet has room
— On the portal model, annual EBITDA at today's prices is 1.7 million against 56.8 million over the last twelve months, and EV/EBITDA is 30.5, which drives the valuation
Key figures, USD bn
| Metric | Q3 2025 | Q3 2026 | Change |
|---|---|---|---|
| Revenue | 0.02 | 0.06 | +129.4% |
| EBITDA | -0.00 | 0.01 | to profit |
| Operating profit | -0.00 | -0.02 | — |
| Net profit | -0.00 | -0.01 | — |
| Operating cash flow | -0.00 | 0.01 | to profit |
| Capex | 0.01 | — | — |
| EBITDA margin | -3.3% | 20.6% | +23.9 pp |
| Net margin | -18.7% | -17.9% | +0.8 pp |
Gold and silver cost 23.4% and 57.6% more in the reported quarter than a year earlier, but spot is already 17.2% and 34.4% below the period average
The average gold price in the third quarter of 2026 was 4268 dollars per ounce against 3459 a year earlier, up 23.4%. Silver rose more – from 39.9 to 62.8 dollars, up 57.6%. In the portal model gold accounts for 55% of sales and silver for 45%, so both metals matter equally to revenue.
Against the previous quarter the metals fell: gold by 5.5% to 4514 dollars, silver by 14.1% to 73.1 dollars. The quarterly revenue growth therefore rested on volumes and realised prices, not on the market.
As of 22 November 2026 gold trades at 3533 dollars, 17.2% below the reported-period average, and silver at 41.2 dollars, 34.4% below. For a producer this matters more than the reported figures: next quarter's profit will be calculated from these levels.
Commodity prices: period average and now
| Benchmark | Year ago | Q3 2026 | YoY | Spot 2026-11-22 |
|---|---|---|---|---|
| Gold, USD | 3 459 | 4 268 | +23,4% | 3 533 |
| Silver, USD | 39,9 | 62,8 | +57,6% | 41,2 |
Revenue of 57.06 million dollars is 22.5 million above what year-ago volumes at these prices would have produced – the gap comes from volumes and realised prices, not the market alone
At the year-ago quarter's volumes and non-price costs and only the new prices, our calculation puts revenue at 34.5 million dollars, so the price effect alone would have added 9.6 million, or 38.8%. The company reported 57.06 million – 22.5 million, or 65.3%, above the price-implied figure.
Year on year revenue grew 129.4%, an acceleration from 88.0% in the second quarter of 2026. The gap to the price-implied figure means the company sold more metal or realised it above the period average; the facts and the source name no other cause.
Against the previous quarter the picture is sharper: at second-quarter 2026 volumes the prices would have produced revenue of 19.1 million, while the company reported 57.06 million – 37.9 million more. Here growth came almost entirely from volumes and realised prices, since the metals themselves fell quarter on quarter.
What the prices implied and what the company earned
| Base (Q3 2025) | Implied at period prices | Reported | Reported vs implied | |
|---|---|---|---|---|
| Revenue, USD mn | 24,9 | 34,5 | 57,1 | +65,3% |
| EBITDA, USD mn | -0,80 | 8,80 | 11,7 | +32,8% |
| EBITDA, portal spot model, USD mn | — | 10,7 | 11,7 | +9,5% |
Revenue and EBITDA by quarter
| Period | Measure | bn USD |
|---|---|---|
| Q4 2024 | Revenue | 0.01297 |
| Q1 2025 | Revenue | 0.012353999999999999 |
| Q2 2025 | Revenue | 0.011228 |
| Q3 2025 | Revenue | 0.024878 |
| Q4 2025 | Revenue | 0.051299 |
| Q1 2026 | Revenue | 0.043942999999999996 |
| Q2 2026 | Revenue | 0.021106000000000003 |
| Q3 2026 | Revenue | 0.05706 |
| Q4 2024 | EBITDA | −0.003073 |
| Q1 2025 | EBITDA | −0.004874 |
| Q2 2025 | EBITDA | −0.008898 |
| Q3 2025 | EBITDA | −0.0008100000000000001 |
| Q4 2025 | EBITDA | 0.0237 |
| Q1 2026 | EBITDA | 0.013539 |
| Q2 2026 | EBITDA | 0.0029829999999999995 |
| Q3 2026 | EBITDA | 0.011733000000000004 |
EBITDA margin
| Period | Measure | % |
|---|---|---|
| Q4 2024 | EBITDA margin | −23.7 |
| Q1 2025 | EBITDA margin | −39.5 |
| Q2 2025 | EBITDA margin | −79.2 |
| Q3 2025 | EBITDA margin | −3.3 |
| Q4 2025 | EBITDA margin | 46.2 |
| Q1 2026 | EBITDA margin | 30.8 |
| Q2 2026 | EBITDA margin | 14.1 |
| Q3 2026 | EBITDA margin | 20.6 |
EBITDA of 11.733 million is only 2.9 million above the 8.8 million price-implied figure, so the price rally barely reached profit
At the year-ago quarter's volumes and costs, the new prices would have produced EBITDA of 8.8 million dollars, our calculation shows. Reported EBITDA is 11.733 million, 2.9 million or 32.8% higher. Revenue beat the price-implied figure by 65.3%, so the extra volume earned less per unit than the base.
The EBITDA margin in the reported quarter was 20.6% against minus 3.3% a year earlier. There is an improvement, but 20.6% is a modest level for a precious-metals producer at these gold and silver prices.
The portal's spot model, built from the average of the previous four quarters, expected EBITDA of 10.7 million and revenue of 35.6 million; actual EBITDA beat by 9.5% and revenue by 60.5%. The model relied on past volumes, so the revenue miss points to unusually high volumes in the reported quarter.
An operating loss of 21.232 million alongside positive EBITDA means depreciation of 33 million absorbs the entire operating result
The operating loss for the third quarter of 2026 was 21.232 million dollars. EBITDA in these facts is defined as operating profit plus depreciation, depletion and amortisation of 33 million, which gives 11.733 million. In other words, before depreciation the business is profitable, after it is not.
Depreciation of 33 million on revenue of 57.06 million is 58% of revenue. Such a charge is typical for a mine with a short reserve life, but it means accounting profit does not reflect cash flow: operating cash flow for the quarter was positive at 6.854 million dollars.
For the equity this matters: profit multiples say little here, while EBITDA and cash flow say more. EBITDA is already stripped of depreciation, so the operating loss does not cancel the company's ability to service debt.
A net loss of 10.237 million against EBITDA of 11.733 million – items outside EBITDA pushed the bottom line below the operating result
The net loss for the third quarter of 2026 was 10.237 million dollars at a margin of minus 17.9% against minus 18.7% a year earlier. The loss is smaller than the operating loss of 21.232 million, so items below the operating line that are outside EBITDA – other income, interest or FX – worked in its favour. The facts do not break them out.
Over the last twelve months the company is profitable: net profit of 6.4 million dollars on EBITDA of 52.0 million and revenue of 173.4 million. The quarterly loss reflects one-off or non-operating items rather than persistent unprofitability.
The net margin for the quarter barely changed year on year – minus 17.9% against minus 18.7% – even though EBITDA went from negative to 11.733 million. That gap is explained only by items below the operating line, and they determine what the shareholder sees in the report.
Net cash of 163.158 million dollars against trailing-twelve-month EBITDA of 52.0 million gives a ratio of minus 3.14 – the balance sheet has room
As of 30 September 2026 the company had net cash of 163.158 million dollars: cash exceeds debt. Net debt to trailing-twelve-month EBITDA is minus 3.14 – a level, not a direction, and it says there is no debt burden.
Operating cash flow was 6.854 million dollars for the quarter and 47.2 million over the last twelve months. Capital expenditure was 9.802 million for the quarter, so reinvestment exceeded quarterly cash flow; over twelve months capex was covered by cash flow.
Market capitalisation is 213.5 million dollars. With net cash of 163.158 million the enterprise is worth about 50 million dollars, and EV/EBITDA on trailing twelve months is 0.97. That multiple reflects not cheapness but the market's doubt about the durability of earnings at current metal prices.
Share price, three years
close, last point 2026-11-20
| Period | Measure | USD per share |
|---|---|---|
| 2025-11-21 | Closing price | 3.2799999713897705 |
| 2025-11-24 | Closing price | 3.1600000858306885 |
| 2025-11-25 | Closing price | 3.359999895095825 |
| 2025-11-26 | Closing price | 3.0799999237060547 |
| 2025-11-28 | Closing price | 3.200000047683716 |
| 2025-12-01 | Closing price | 3.319999933242798 |
| 2025-12-02 | Closing price | 3.4000000953674316 |
| 2025-12-03 | Closing price | 3.359999895095825 |
| 2025-12-04 | Closing price | 3.200000047683716 |
| 2025-12-05 | Closing price | 3.5999999046325684 |
| 2025-12-08 | Closing price | 3.200000047683716 |
| 2025-12-09 | Closing price | 3.359999895095825 |
| 2025-12-10 | Closing price | 3.200000047683716 |
| 2025-12-11 | Closing price | 3.240000009536743 |
| 2025-12-12 | Closing price | 3.359999895095825 |
| 2025-12-15 | Closing price | 3.4000000953674316 |
| 2025-12-16 | Closing price | 3.4000000953674316 |
| 2025-12-17 | Closing price | 3.680000066757202 |
| 2025-12-18 | Closing price | 3.880000114440918 |
| 2025-12-19 | Closing price | 4.039999961853027 |
| 2025-12-22 | Closing price | 4.199999809265137 |
| 2025-12-23 | Closing price | 4.400000095367432 |
| 2025-12-24 | Closing price | 4.400000095367432 |
| 2025-12-26 | Closing price | 5.119999885559082 |
| 2025-12-29 | Closing price | 4.480000019073486 |
| 2025-12-30 | Closing price | 4.480000019073486 |
| 2025-12-31 | Closing price | 4.559999942779541 |
| 2026-01-02 | Closing price | 4.480000019073486 |
| 2026-01-05 | Closing price | 4.559999942779541 |
| 2026-01-06 | Closing price | 4.760000228881836 |
| 2026-01-07 | Closing price | 4.880000114440918 |
| 2026-01-08 | Closing price | 4.639999866485596 |
| 2026-01-09 | Closing price | 4.400000095367432 |
| 2026-01-12 | Closing price | 4.960000038146973 |
| 2026-01-13 | Closing price | 4.840000152587891 |
| 2026-01-14 | Closing price | 4.71999979019165 |
| 2026-01-15 | Closing price | 5.400000095367432 |
| 2026-01-16 | Closing price | 5.239999771118164 |
| 2026-01-20 | Closing price | 5.440000057220459 |
| 2026-01-21 | Closing price | 5.360000133514404 |
| 2026-01-22 | Closing price | 5.400000095367432 |
| 2026-01-23 | Closing price | 6.28000020980835 |
| 2026-01-26 | Closing price | 6.039999961853027 |
| 2026-01-27 | Closing price | 5.840000152587891 |
| 2026-01-28 | Closing price | 5.440000057220459 |
| 2026-01-29 | Closing price | 5.039999961853027 |
| 2026-01-30 | Closing price | 4.71999979019165 |
| 2026-02-02 | Closing price | 4.840000152587891 |
| 2026-02-03 | Closing price | 4.880000114440918 |
| 2026-02-04 | Closing price | 4.840000152587891 |
| 2026-02-05 | Closing price | 4.440000057220459 |
| 2026-02-06 | Closing price | 4.679999828338623 |
| 2026-02-09 | Closing price | 4.71999979019165 |
| 2026-02-10 | Closing price | 4.760000228881836 |
| 2026-02-11 | Closing price | 4.760000228881836 |
| 2026-02-12 | Closing price | 4.760000228881836 |
| 2026-02-13 | Closing price | 5.039999961853027 |
| 2026-02-17 | Closing price | 4.480000019073486 |
| 2026-02-18 | Closing price | 4.800000190734863 |
| 2026-02-19 | Closing price | 4.920000076293945 |
| 2026-02-20 | Closing price | 4.519999980926514 |
| 2026-02-23 | Closing price | 4.559999942779541 |
| 2026-02-24 | Closing price | 4.559999942779541 |
| 2026-02-25 | Closing price | 4.400000095367432 |
| 2026-02-26 | Closing price | 4.519999980926514 |
| 2026-02-27 | Closing price | 4.599999904632568 |
| 2026-03-02 | Closing price | 4.519999980926514 |
| 2026-03-03 | Closing price | 4.480000019073486 |
| 2026-03-04 | Closing price | 4.480000019073486 |
| 2026-03-05 | Closing price | 4.440000057220459 |
| 2026-03-06 | Closing price | 4.400000095367432 |
| 2026-03-09 | Closing price | 4.440000057220459 |
| 2026-03-10 | Closing price | 4.480000019073486 |
| 2026-03-11 | Closing price | 4.400000095367432 |
| 2026-03-12 | Closing price | 4.400000095367432 |
| 2026-03-13 | Closing price | 4.159999847412109 |
| 2026-03-16 | Closing price | 3.9200000762939453 |
| 2026-03-17 | Closing price | 3.9600000381469727 |
| 2026-03-18 | Closing price | 3.8399999141693115 |
| 2026-03-19 | Closing price | 3.640000104904175 |
| 2026-03-20 | Closing price | 3.5199999809265137 |
| 2026-03-23 | Closing price | 3.5999999046325684 |
| 2026-03-24 | Closing price | 3.640000104904175 |
| 2026-03-25 | Closing price | 3.559999942779541 |
| 2026-03-26 | Closing price | 3.559999942779541 |
| 2026-03-27 | Closing price | 3.7200000286102295 |
| 2026-03-30 | Closing price | 3.8399999141693115 |
| 2026-03-31 | Closing price | 4.039999961853027 |
| 2026-04-01 | Closing price | 4.0 |
| 2026-04-02 | Closing price | 4.119999885559082 |
| 2026-04-06 | Closing price | 4.239999771118164 |
| 2026-04-07 | Closing price | 4.119999885559082 |
| 2026-04-08 | Closing price | 4.199999809265137 |
| 2026-04-09 | Closing price | 4.239999771118164 |
| 2026-04-10 | Closing price | 4.320000171661377 |
| 2026-04-13 | Closing price | 4.199999809265137 |
| 2026-04-14 | Closing price | 4.320000171661377 |
| 2026-04-15 | Closing price | 4.239999771118164 |
| 2026-04-16 | Closing price | 4.28000020980835 |
| 2026-04-17 | Closing price | 4.400000095367432 |
| 2026-04-20 | Closing price | 4.400000095367432 |
| 2026-04-21 | Closing price | 4.079999923706055 |
| 2026-04-22 | Closing price | 4.360000133514404 |
| 2026-04-23 | Closing price | 4.119999885559082 |
| 2026-04-24 | Closing price | 4.519999980926514 |
| 2026-04-27 | Closing price | 4.440000057220459 |
| 2026-04-28 | Closing price | 4.28000020980835 |
| 2026-04-29 | Closing price | 4.079999923706055 |
| 2026-04-30 | Closing price | 4.119999885559082 |
| 2026-05-01 | Closing price | 4.119999885559082 |
| 2026-05-04 | Closing price | 4.239999771118164 |
| 2026-05-05 | Closing price | 4.400000095367432 |
| 2026-05-06 | Closing price | 4.239999771118164 |
| 2026-05-07 | Closing price | 4.559999942779541 |
| 2026-05-08 | Closing price | 4.28000020980835 |
| 2026-05-11 | Closing price | 4.360000133514404 |
| 2026-05-12 | Closing price | 4.559999942779541 |
| 2026-05-13 | Closing price | 4.480000019073486 |
| 2026-05-14 | Closing price | 4.400000095367432 |
| 2026-05-15 | Closing price | 4.320000171661377 |
| 2026-05-18 | Closing price | 4.239999771118164 |
| 2026-05-19 | Closing price | 4.480000019073486 |
| 2026-05-20 | Closing price | 4.679999828338623 |
| 2026-05-21 | Closing price | 4.760000228881836 |
| 2026-05-22 | Closing price | 4.639999866485596 |
| 2026-05-26 | Closing price | 4.440000057220459 |
| 2026-05-27 | Closing price | 4.639999866485596 |
| 2026-05-28 | Closing price | 4.840000152587891 |
| 2026-05-29 | Closing price | 4.760000228881836 |
| 2026-06-01 | Closing price | 4.159999847412109 |
| 2026-06-02 | Closing price | 4.800000190734863 |
| 2026-06-03 | Closing price | 4.199999809265137 |
| 2026-06-04 | Closing price | 4.239999771118164 |
| 2026-06-05 | Closing price | 4.480000019073486 |
| 2026-06-08 | Closing price | 4.519999980926514 |
| 2026-06-09 | Closing price | 4.440000057220459 |
| 2026-06-10 | Closing price | 4.28000020980835 |
| 2026-06-11 | Closing price | 4.199999809265137 |
| 2026-06-12 | Closing price | 4.320000171661377 |
| 2026-06-15 | Closing price | 4.559999942779541 |
| 2026-06-16 | Closing price | 4.639999866485596 |
| 2026-06-17 | Closing price | 4.760000228881836 |
| 2026-06-18 | Closing price | 4.639999866485596 |
| 2026-06-22 | Closing price | 4.480000019073486 |
| 2026-06-23 | Closing price | 4.559999942779541 |
| 2026-06-24 | Closing price | 4.599999904632568 |
| 2026-06-25 | Closing price | 4.559999942779541 |
| 2026-06-26 | Closing price | 4.559999942779541 |
| 2026-06-29 | Closing price | 4.519999980926514 |
| 2026-06-30 | Closing price | 4.599999904632568 |
| 2026-07-01 | Closing price | 5.239999771118164 |
| 2026-07-02 | Closing price | 4.440000057220459 |
| 2026-07-06 | Closing price | 4.440000057220459 |
| 2026-07-07 | Closing price | 4.480000019073486 |
| 2026-07-08 | Closing price | 4.400000095367432 |
| 2026-07-09 | Closing price | 4.28000020980835 |
| 2026-07-10 | Closing price | 4.789999961853027 |
| 2026-07-13 | Closing price | 4.659999847412109 |
| 2026-07-14 | Closing price | 4.619999885559082 |
| 2026-07-15 | Closing price | 4.610000133514404 |
| 2026-07-16 | Closing price | 3.880000114440918 |
| 2026-07-17 | Closing price | 4.25 |
| 2026-07-20 | Closing price | 3.2899999618530273 |
| 2026-07-21 | Closing price | 2.5799999237060547 |
| 2026-07-22 | Closing price | 2.569999933242798 |
| 2026-07-23 | Closing price | 2.2899999618530273 |
| 2026-07-24 | Closing price | 2.0 |
| 2026-07-27 | Closing price | 2.1500000953674316 |
| 2026-07-28 | Closing price | 2.009999990463257 |
| 2026-07-29 | Closing price | 2.059999942779541 |
| 2026-07-30 | Closing price | 2.2300000190734863 |
| 2026-07-31 | Closing price | 2.0799999237060547 |
| 2026-08-03 | Closing price | 2.180000066757202 |
| 2026-08-04 | Closing price | 2.190000057220459 |
| 2026-08-05 | Closing price | 2.1600000858306885 |
| 2026-08-06 | Closing price | 2.119999885559082 |
| 2026-08-07 | Closing price | 2.5299999713897705 |
| 2026-08-10 | Closing price | 2.4700000286102295 |
| 2026-08-11 | Closing price | 2.440000057220459 |
| 2026-08-12 | Closing price | 2.799999952316284 |
| 2026-08-13 | Closing price | 2.799999952316284 |
| 2026-08-14 | Closing price | 2.75 |
| 2026-08-17 | Closing price | 2.759999990463257 |
| 2026-08-18 | Closing price | 2.690000057220459 |
| 2026-08-19 | Closing price | 2.8299999237060547 |
| 2026-08-20 | Closing price | 3.0 |
| 2026-08-21 | Closing price | 3.190000057220459 |
| 2026-08-24 | Closing price | 3.5299999713897705 |
| 2026-08-25 | Closing price | 3.869999885559082 |
| 2026-08-26 | Closing price | 3.559999942779541 |
| 2026-08-27 | Closing price | 3.7899999618530273 |
| 2026-08-28 | Closing price | 3.6500000953674316 |
| 2026-08-31 | Closing price | 3.690000057220459 |
| 2026-09-01 | Closing price | 3.5799999237060547 |
| 2026-09-02 | Closing price | 3.869999885559082 |
| 2026-09-03 | Closing price | 4.050000190734863 |
| 2026-09-04 | Closing price | 4.150000095367432 |
| 2026-09-08 | Closing price | 3.8399999141693115 |
| 2026-09-09 | Closing price | 3.619999885559082 |
| 2026-09-10 | Closing price | 3.569999933242798 |
| 2026-09-11 | Closing price | 3.5999999046325684 |
| 2026-09-14 | Closing price | 3.569999933242798 |
| 2026-09-15 | Closing price | 3.5199999809265137 |
| 2026-09-16 | Closing price | 3.4800000190734863 |
| 2026-09-17 | Closing price | 3.509999990463257 |
| 2026-09-18 | Closing price | 3.5899999141693115 |
| 2026-09-21 | Closing price | 3.5299999713897705 |
| 2026-09-22 | Closing price | 3.549999952316284 |
| 2026-09-23 | Closing price | 3.6500000953674316 |
| 2026-09-24 | Closing price | 3.5199999809265137 |
| 2026-09-25 | Closing price | 3.5 |
| 2026-09-28 | Closing price | 3.359999895095825 |
| 2026-09-29 | Closing price | 3.200000047683716 |
| 2026-09-30 | Closing price | 3.190000057220459 |
| 2026-10-01 | Closing price | 3.190000057220459 |
| 2026-10-02 | Closing price | 3.259999990463257 |
| 2026-10-05 | Closing price | 3.25 |
| 2026-10-06 | Closing price | 3.369999885559082 |
| 2026-10-07 | Closing price | 3.2799999713897705 |
| 2026-10-08 | Closing price | 3.190000057220459 |
| 2026-10-09 | Closing price | 3.4100000858306885 |
| 2026-10-12 | Closing price | 3.430000066757202 |
| 2026-10-13 | Closing price | 3.369999885559082 |
| 2026-10-14 | Closing price | 3.2200000286102295 |
| 2026-10-15 | Closing price | 3.3299999237060547 |
| 2026-10-16 | Closing price | 3.390000104904175 |
| 2026-10-19 | Closing price | 3.4000000953674316 |
| 2026-10-20 | Closing price | 3.4100000858306885 |
| 2026-10-21 | Closing price | 3.4800000190734863 |
| 2026-10-22 | Closing price | 3.3499999046325684 |
| 2026-10-23 | Closing price | 3.299999952316284 |
| 2026-10-26 | Closing price | 3.119999885559082 |
| 2026-10-27 | Closing price | 3.200000047683716 |
| 2026-10-28 | Closing price | 3.319999933242798 |
| 2026-10-29 | Closing price | 3.2799999713897705 |
| 2026-10-30 | Closing price | 3.1600000858306885 |
| 2026-11-02 | Closing price | 2.809999942779541 |
| 2026-11-03 | Closing price | 2.8399999141693115 |
| 2026-11-04 | Closing price | 3.0799999237060547 |
| 2026-11-05 | Closing price | 3.140000104904175 |
| 2026-11-06 | Closing price | 3.1500000953674316 |
| 2026-11-09 | Closing price | 3.390000104904175 |
| 2026-11-10 | Closing price | 3.4800000190734863 |
| 2026-11-11 | Closing price | 3.359999895095825 |
| 2026-11-12 | Closing price | 3.2799999713897705 |
| 2026-11-13 | Closing price | 3.2200000286102295 |
| 2026-11-16 | Closing price | 3.25 |
| 2026-11-17 | Closing price | 3.2100000381469727 |
| 2026-11-18 | Closing price | 3.319999933242798 |
| 2026-11-19 | Closing price | 2.859999895095825 |
| 2026-11-20 | Closing price | 2.9200000762939453 |
On the portal model, annual EBITDA at today's prices is 1.7 million against 56.8 million over the last twelve months, and EV/EBITDA is 30.5, which drives the valuation
The portal's spot model re-prices EBITDA to current prices: at gold of 3533 and silver of 41.2 dollars annual EBITDA would be 1.7 million dollars against 56.8 million over the last twelve months, a fall of 97.1%. EV/EBITDA at current prices is 30.5 and net debt to EBITDA is minus 98.8.
That figure, not the reported EBITDA of 11.733 million, drives the valuation: the last twelve months were earned at average prices above today's. On the portal model the share's fair value is 81% below the market – our own calculation, not a consensus or a target price.
The trailing-twelve-month EV/EBITDA is 0.97 and P/E is 33.2. The gap between them is explained by trailing earnings including quarters with high prices, while market capitalisation already reflects their fall. For a commodity producer the starting point should be EBITDA at current prices, and it gives 30.5 on EV/EBITDA.
Valuation on the latest reported figures
| Metric | Value |
|---|---|
| Market cap | 0.21 bn USD |
| P/E (LTM) | 33.2 |
| EV/EBITDA (LTM) | 1.0 |
| P/B | 4.85 |
| Net debt / EBITDA (LTM) | -3.14 |
| Operating cash flow (LTM) | 0.05 bn |
| ROE | -7.7% |
Net profit by quarter
| Period | Measure | bn USD |
|---|---|---|
| Q4 2024 | Net profit | −0.011141999999999996 |
| Q1 2025 | Net profit | −0.008319 |
| Q2 2025 | Net profit | −0.011486000000000001 |
| Q3 2025 | Net profit | −0.004655 |
| Q4 2025 | Net profit | 0.018 |
| Q1 2026 | Net profit | 0.004739 |
| Q2 2026 | Net profit | −0.00608 |
| Q3 2026 | Net profit | −0.010237 |
Bottom line
The balance sheet remains the strong point: net cash of 163.158 million dollars and net debt to EBITDA of minus 3.14 give the company time to ride out a price fall. Operationally the quarter was uneven: EBITDA of 11.733 million is only 2.9 million above what year-ago volumes at these prices would have produced, and the operating loss of 21.232 million shows how large depreciation is. Revenue of 57.06 million is 22.5 million above the price-implied figure, and that advantage rests on volumes that may not repeat. The real question for a holder is not the reported quarter but what happens at current prices: on the portal model annual EBITDA falls to 1.7 million and the share's upside to fair value is minus 81%. Our conclusion: the share is rather unattractive – the portal model puts its upside at minus 81%. Our view: the share is rather unattractive at the current price; upside on the portal model -81%.