Holmen: revenue up 3.3% but profit and margin retreat to year-ago levels
Holmen reported second-quarter 2026 results. Revenue reached $596.5 million, up 3.3% year on year, but EBITDA fell 8.1% to $111.3 million and net profit declined 13.4% to $54.0 million. The EBITDA margin narrowed to 18.8% from 21.1% a year earlier. At the current price the stock looks unattractive: the EV/EBITDA multiple of 8.76x exceeds its own three-year average, and the portal's model points to 23% downside.
Key takeaways
— Revenue grew 3.3% year on year but decelerated from 4.8% in Q1 2026
— EBITDA fell 8.1% year on year and the margin narrowed to 18.8% from 21.1%
— Net profit declined 13.4% year on year to $54.0 million
— Operating cash flow for the quarter was $40.0 million, well below last year's $128.9 million
— Leverage at 1.07x EBITDA LTM remains moderate, but capital expenditure is not disclosed
— Dividend yield of 2.94% looks modest relative to the current share price
— EV/EBITDA of 8.76x exceeds its own three-year average of 8.93x, and the portal's model implies 23% downside
Attractiveness
Key figures, USD bn
| Metric | Q2 2025 | Q2 2026 | Change |
|---|---|---|---|
| Revenue | 0.58 | 0.60 | +3.3% |
| EBITDA | 0.12 | 0.11 | -8.1% |
| Operating profit | 0.08 | 0.07 | -12.5% |
| Net profit | 0.06 | 0.05 | -13.4% |
| Operating cash flow | 0.13 | 0.04 | -68.9% |
| EBITDA margin | 21.1% | 18.8% | -2.3 pp |
| Net margin | 10.8% | 9.1% | -1.7 pp |
Revenue grew 3.3% year on year but decelerated from 4.8% in Q1 2026
Holmen's revenue in Q2 2026 was $596.5 million, up 3.3% from a year earlier. This continues growth but at a slower pace: in Q1 2026 revenue grew 4.8% year on year. The deceleration may reflect both a high base effect and changing market conditions.
The company does not disclose revenue breakdown by segment or business line in the provided data, so it is impossible to say exactly which business drove growth or, conversely, slowed it down. However, the very fact of deceleration while maintaining positive dynamics suggests that demand for Holmen's products remains, but its intensity is decreasing.
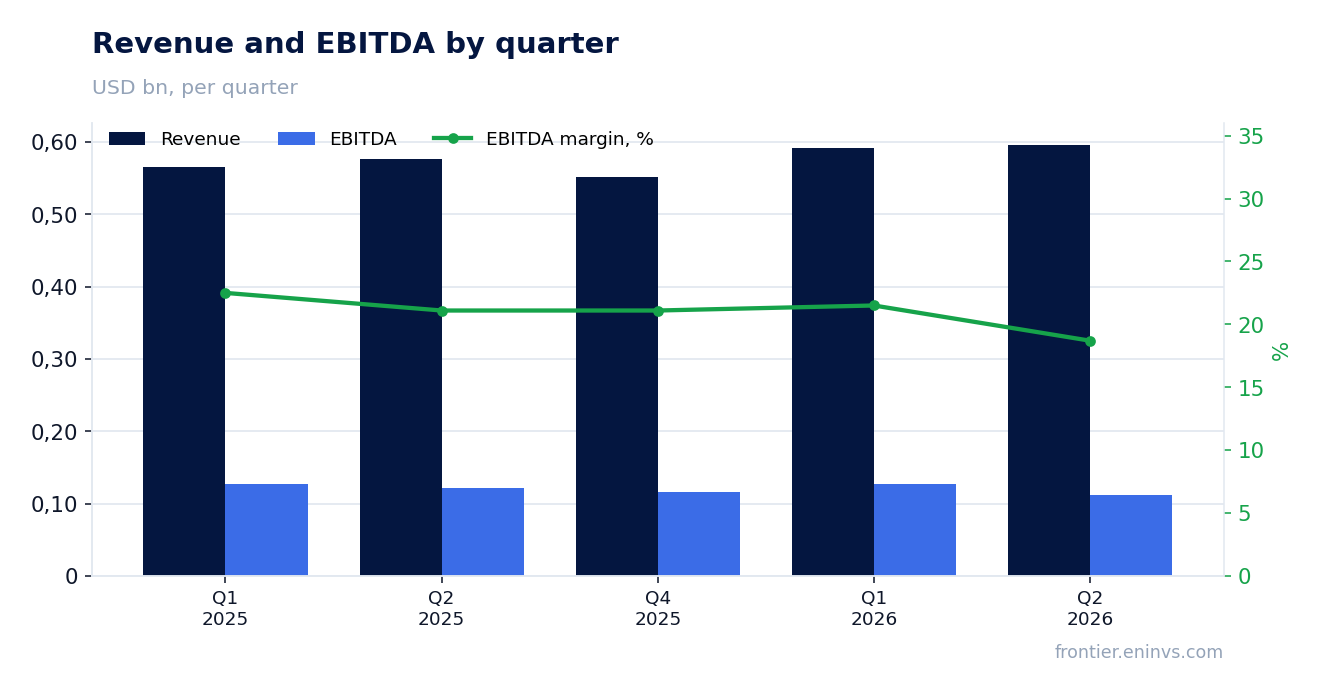
EBITDA fell 8.1% year on year and the margin narrowed to 18.8% from 21.1%
EBITDA in Q2 2026 was $111.3 million, down 8.1% from a year earlier. The EBITDA margin narrowed to 18.8% from 21.1% in the same period last year. This means revenue growth did not translate into profit growth: the company faced faster cost increases.
The 2.3 percentage point margin contraction is a significant change for one quarter. It could be related to higher raw material, energy, or logistics costs, but the exact reason is not disclosed in the provided data. For investors, this signals pressure on operational efficiency.
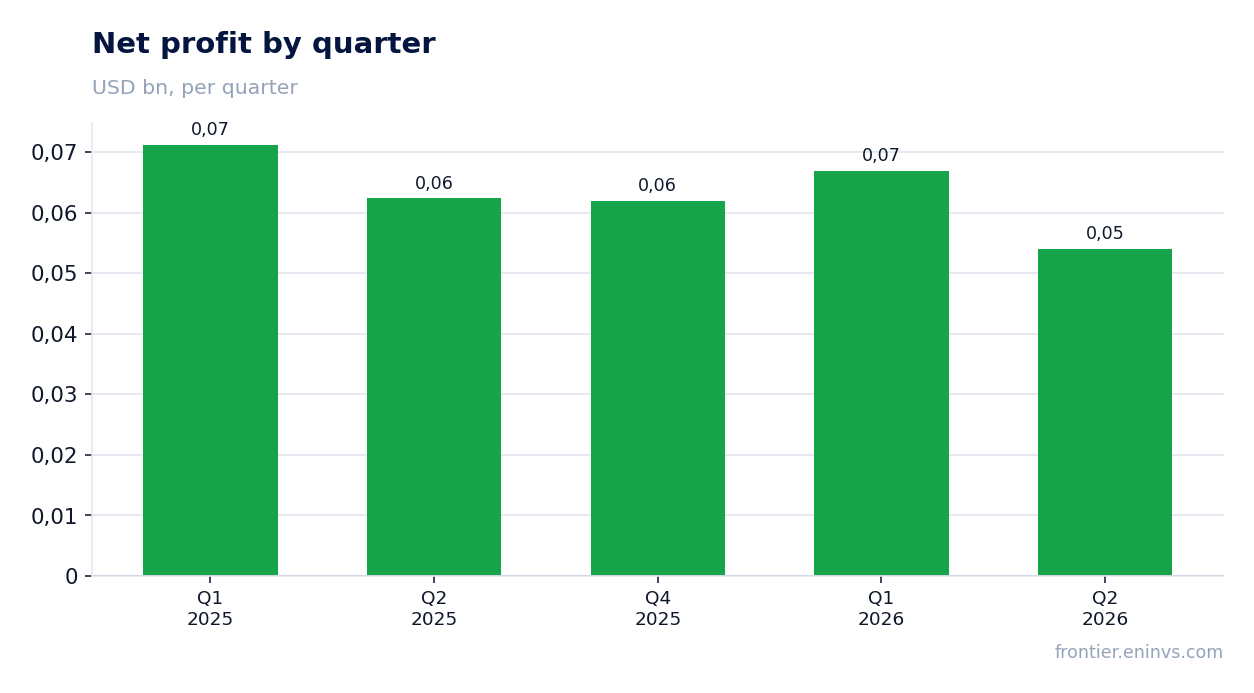
Net profit declined 13.4% year on year to $54.0 million
Net profit in Q2 2026 was $54.0 million, down 13.4% from a year earlier. The net margin declined to 9.1% from 10.8%. The profit decline is deeper than the EBITDA drop, which may indicate higher expenses below the operating line – such as interest payments or taxes.
Falling net profit amid rising revenue is a warning signal. The company does not disclose details, but investors should monitor interest expenses and tax burden in the next report.
Operating cash flow for the quarter was $40.0 million, well below last year's $128.9 million
Operating cash flow in Q2 2026 was $40.0 million versus $128.9 million a year earlier. This is a sharp decline – more than threefold. Meanwhile, revenue grew and EBITDA fell only 8.1%, suggesting the gap arose from changes in working capital or other non-cash items.
Such weak cash flow despite positive profit may indicate an increase in inventories or receivables, but the exact reason is not disclosed. For investors, this means the company's ability to generate cash in this quarter has significantly decreased, which could limit funding for capital expenditures or dividends.
Leverage at 1.07x EBITDA LTM remains moderate, but capital expenditure is not disclosed
Net debt at the latest reporting date was $486.4 million, and the net debt to EBITDA ratio for the trailing twelve months was 1.07. This is a moderate level that does not raise concerns. However, the provided data lacks information on capital expenditures, making it difficult to assess the company's investment program.
Without capex data, it is impossible to understand how much the company reinvests to maintain or expand its business. This limits the analysis of free cash flow and dividend sustainability.
Dividend yield of 2.94% looks modest relative to the current share price
The dividend yield over the trailing twelve months is 2.94%. This is not a high level, especially considering that the company operates in a capital-intensive industry and its profit declined in the latest quarter. At the current share price, the dividend is not a primary factor of attractiveness.
The company does not disclose its dividend policy or payout plans in the provided data. However, weak operating cash flow in the quarter could limit its ability to maintain or increase dividends in the future.
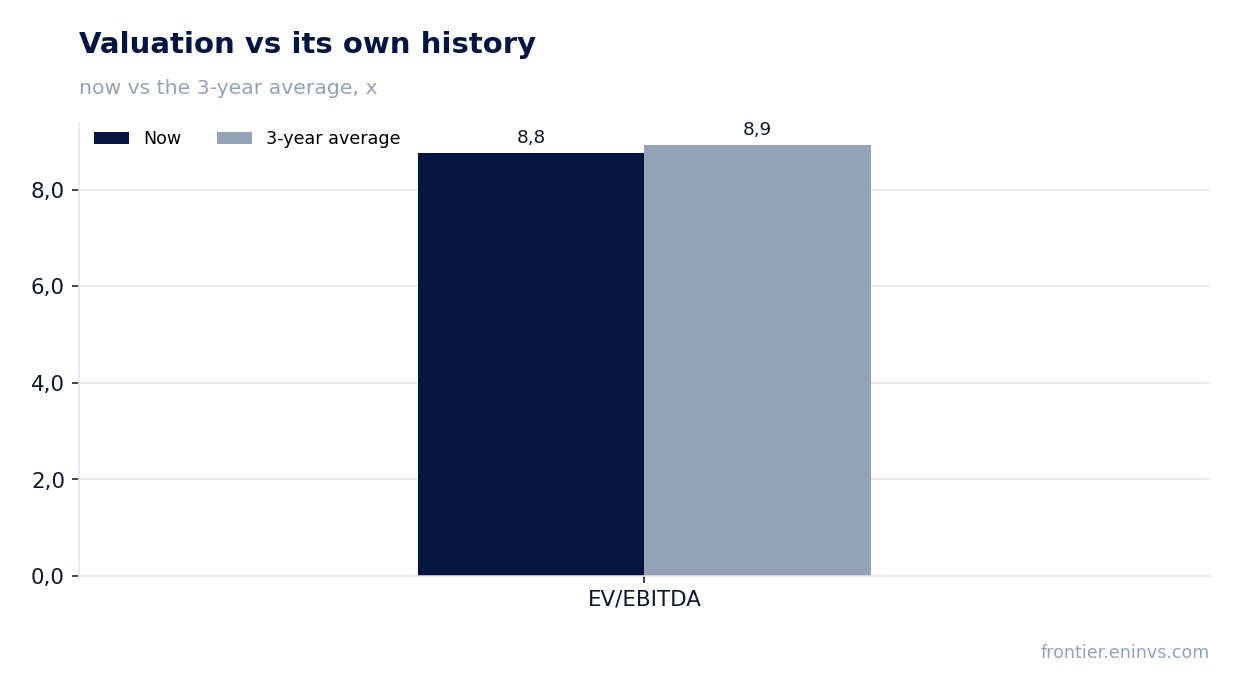
EV/EBITDA of 8.76x exceeds its own three-year average of 8.93x, and the portal's model implies 23% downside
The current EV/EBITDA multiple is 8.76x, slightly below its own three-year average of 8.93x. However, the portal's model, which reprices EBITDA at current commodity prices at the target EV/EBITDA, implies 23% downside from the current market capitalization. This means the market values the company higher than our model suggests.
The P/E LTM is 12.25x, which also does not look cheap given the profit decline. Return on equity (ROE) is 3.82%, low for a company with this market capitalization. Together, these factors suggest the stock trades at a premium to its fundamentals.
Valuation on the latest reported figures
| Metric | Value |
|---|---|
| Market cap | 3.50 bn USD |
| P/E (LTM) | 12.3 |
| EV/EBITDA (LTM) | 8.8 |
| P/B | 0.58 |
| Net debt / EBITDA (LTM) | 1.07 |
| Operating cash flow (LTM) | 0.30 bn |
| ROE | 3.8% |
| Dividend yield (12m) | 2.9% |
| EV/EBITDA, 3-year average | 8.9 |
Bottom line
Holmen's revenue grew 3.3%, but this did not save profit: EBITDA fell 8.1%, net profit declined 13.4%, and the margin narrowed to 18.8%. Operating cash flow collapsed to $40.0 million, well below last year's $128.9 million. Leverage at 1.07x EBITDA LTM is moderate, but without capex data it is difficult to assess business sustainability. Dividend yield of 2.94% does not compensate for the risks. At the current price the stock looks unattractive: the EV/EBITDA multiple is near its three-year average, and the portal's model implies 23% downside.
Open the company's financial profile HOLM →
See also: market overview · valuation map · stock screeners