Headwater Exploration: revenue jumped 63.3%, but the entire gain came from prices, not volumes
Headwater Exploration has reported its Q2 2026 results. Revenue rose 63.3% year on year to $171.1 million, EBITDA – by 70.3% to $99.7 million, net profit – by 123.4% to $61.4 million. The EBITDA margin improved to 59.3% from 56.9%, and the net margin to 35.9% from 26.2%. The company remains in a net cash position: net debt / EBITDA LTM stands at -0.22, and free cash flow is solid. The shares trade at EV/EBITDA LTM of 7.8 and P/E LTM of 15.6, which does not look cheap for an oil and gas producer, while the portal's model implies only 2% upside to fair value. Against this backdrop, our verdict is neutral: the profit growth is impressive but almost entirely price-driven rather than operational.
Key takeaways
— Revenue rose 63.3% year on year to $171.1 million, but the entire gain came from prices, not volumes
— EBITDA margin improved to 59.3% from 56.9% – rising oil prices outpaced cost growth
— Net profit jumped 123.4% to $61.4 million, but the gap with EBITDA points to one-off factors
— The company remains in a net cash position: net debt / EBITDA LTM of -0.22, with operating cash flow of $96.8 million in the quarter
— EV/EBITDA LTM of 7.8 and P/E LTM of 15.6 – the valuation does not look cheap for an oil and gas producer
— The portal's model implies only 2% upside to fair value, limiting the potential for further gains
Attractiveness
Key figures, USD bn
| Metric | Q2 2025 | Q2 2026 | Change |
|---|---|---|---|
| Revenue | 0.10 | 0.17 | +63.3% |
| EBITDA | 0.06 | 0.10 | +70.3% |
| Operating profit | 0.03 | 0.08 | +127.7% |
| Net profit | 0.03 | 0.06 | +123.4% |
| Operating cash flow | 0.05 | 0.10 | +94.9% |
| EBITDA margin | 56.9% | 59.3% | +2.4 pp |
| Net margin | 26.2% | 35.9% | +9.7 pp |
Revenue rose 63.3% year on year to $171.1 million, but the entire gain came from prices, not volumes
Revenue in Q2 2026 came in at $171.1 million, up 63.3% year on year. This marks an acceleration from the 8.6% growth seen in Q1 2026. However, such a jump is almost entirely explained by favourable oil price conditions rather than higher production or sales volumes. The company does not disclose volumetric data in the provided facts, but such a sharp revenue increase against a relatively stable base last year points to a decisive price contribution.
For comparison: in Q1 2026 revenue grew only 8.6% year on year, while in Q4 2025 it declined. Thus, Q2 was a turning point, but it was driven by external conditions rather than internal improvements. If oil prices remain at current levels, revenue may hold, but further acceleration is unlikely without production growth.
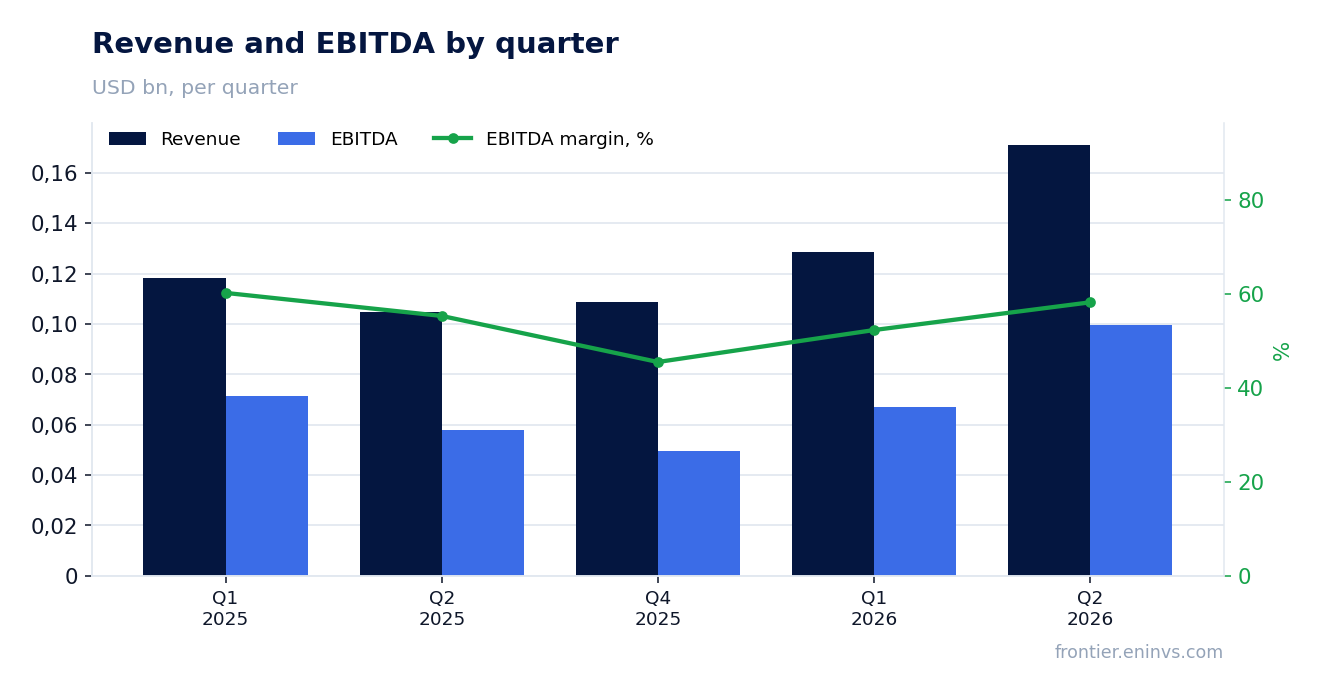
EBITDA margin improved to 59.3% from 56.9% – rising oil prices outpaced cost growth
EBITDA in Q2 2026 reached $99.7 million, up 70.3% year on year. The EBITDA margin came in at 59.3% versus 56.9% a year earlier. The 2.4 percentage point margin expansion indicates that revenue grew faster than costs. In a rising oil price environment, this is expected: operating costs are typically less volatile than commodity prices.
However, the margin improvement was not uniform: in Q1 2026 the EBITDA margin was around 52.3% ($67.2 million on revenue of $128.5 million), lower than in Q2. This confirms that the Q2 improvement was driven by the price factor. If oil prices correct, the margin could revert to lower levels.
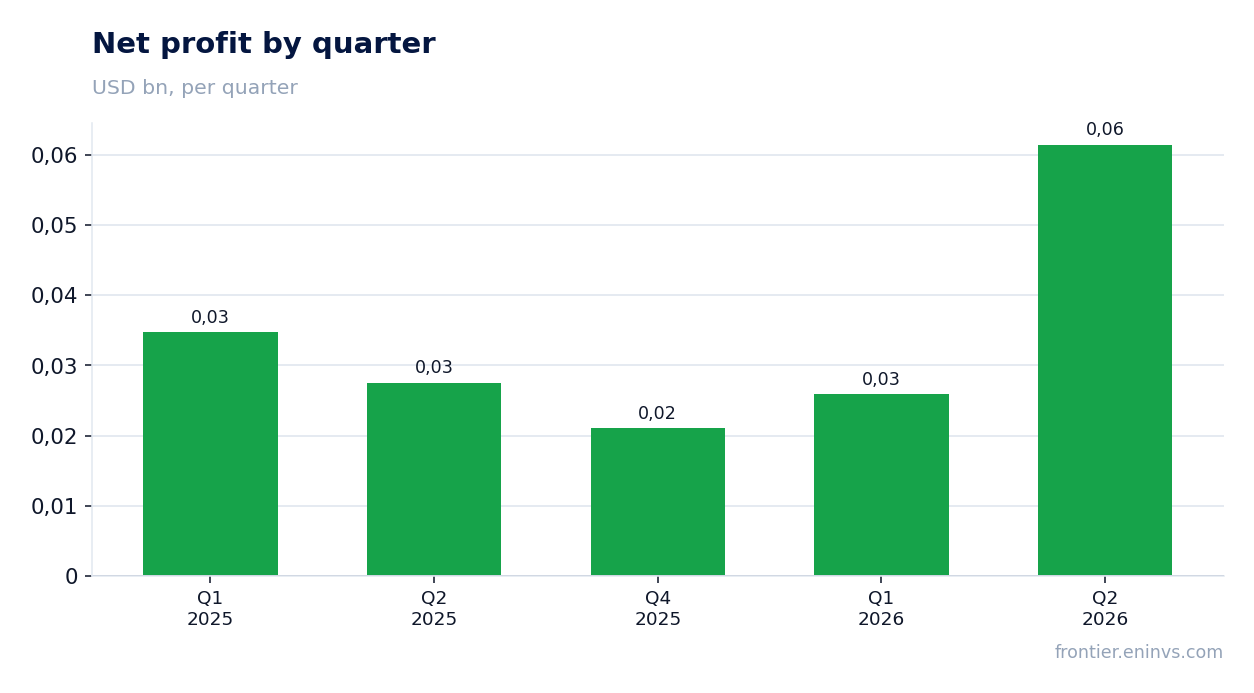
Net profit jumped 123.4% to $61.4 million, but the gap with EBITDA points to one-off factors
Net profit in Q2 2026 was $61.4 million, up 123.4% year on year. This is significantly faster than the growth in EBITDA (+70.3%) and revenue (+63.3%). Such outperformance in net profit could be explained by several factors: lower interest expenses, operating leverage, and possible one-off items that the company does not detail in the provided facts.
The net margin rose to 35.9% from 26.2% a year earlier. Such a sharp improvement in net profitability against a more modest EBITDA margin expansion suggests that non-operating income or a lower tax burden may have been present in the reporting period. Without additional information from the company's report, it is impossible to pinpoint the cause, but the sustainability of this net profit level is questionable.
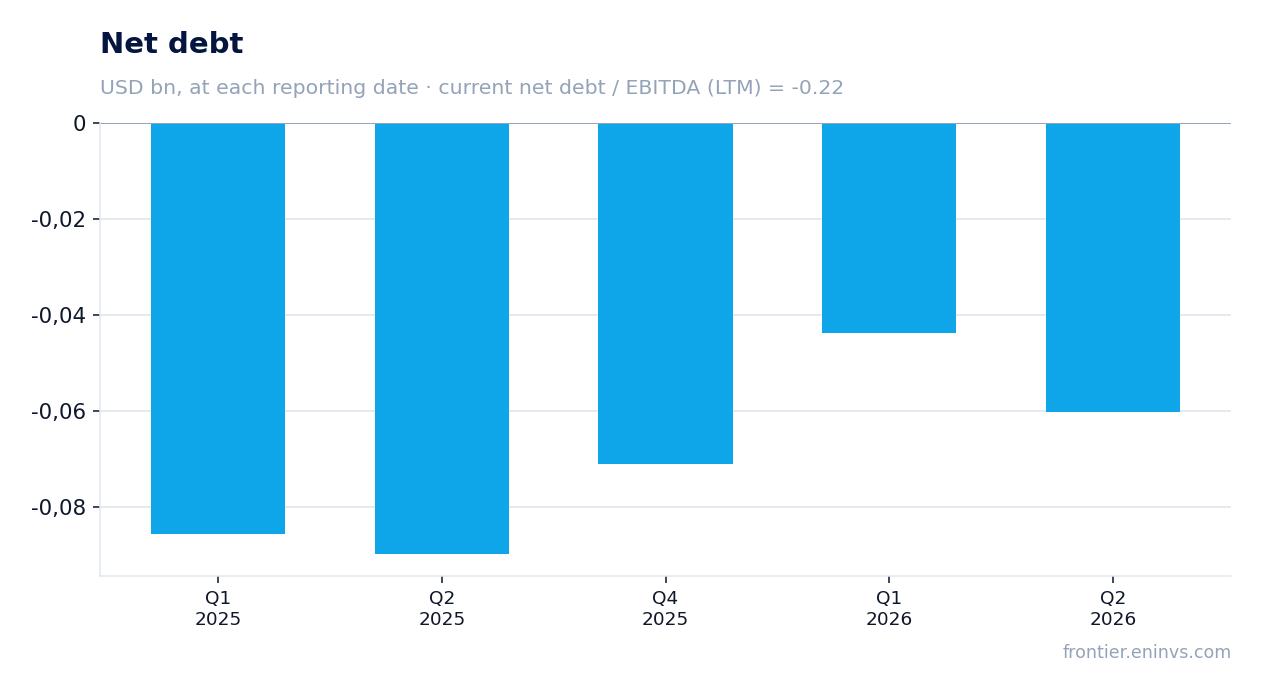
The company remains in a net cash position: net debt / EBITDA LTM of -0.22, with operating cash flow of $96.8 million in the quarter
As of the end of Q2 2026, Headwater Exploration's net debt remains negative at -$60.3 million. This means cash and equivalents exceed debt obligations. The net debt / EBITDA LTM ratio stands at -0.22, confirming a strong balance sheet. Operating cash flow for the quarter was $96.8 million, significantly higher than in Q1 2026 ($29.1 million) and Q2 2025 ($49.7 million).
The increase in operating cash flow reflects both higher revenue and effective working capital management. However, it is worth noting that with oil prices above historical averages, cash flow may be volatile. Nevertheless, the current net cash position provides the company with financial flexibility for investments or returning capital to shareholders.
EV/EBITDA LTM of 7.8 and P/E LTM of 15.6 – the valuation does not look cheap for an oil and gas producer
Based on the trailing twelve months, Headwater Exploration's EV/EBITDA stands at 7.8, and P/E at 15.6. For an oil and gas company, especially given commodity price volatility, these multiples appear relatively high. The market is likely already pricing in sustained high oil prices, which creates a risk of re-rating if prices decline.
A comparison with the three-year average multiples is not possible due to the absence of historical data in the provided facts. However, an EV/EBITDA around 8 for an exploration and production company is generally considered the upper end of the comfortable range. At the same time, ROE is 44.0%, indicating high capital efficiency, but this metric is also influenced by the price factor.
The portal's model implies only 2% upside to fair value, limiting the potential for further gains
According to our model, which re-prices EBITDA at current commodity prices against a target EV/EBITDA, the fair value of Headwater Exploration shares implies only 2% upside from the current market capitalisation. This means the market has already largely priced in favourable price conditions. Further upside is limited unless oil prices continue to rise or the company increases production.
The portal's model is not a consensus forecast and reflects only our own calculation. Nevertheless, it shows that at current oil prices the shares are valued close to fair value. A significant upward re-rating would require either sustained production growth or higher commodity prices, which is unlikely without a change in market conditions.
Valuation on the latest reported figures
| Metric | Value |
|---|---|
| Market cap | 2.24 bn USD |
| P/E (LTM) | 15.6 |
| EV/EBITDA (LTM) | 7.8 |
| P/B | 4.10 |
| Net debt / EBITDA (LTM) | -0.22 |
| Operating cash flow (LTM) | 0.26 bn |
| ROE | 44.0% |
Bottom line
Bottom line: Headwater Exploration delivered a strong quarter – revenue rose 63.3%, EBITDA margin reached 59.3%, and net profit more than doubled. However, this growth was almost entirely driven by favourable oil prices rather than operational improvements. The company maintains a solid balance sheet with a net cash position and strong operating cash flow, but the valuation already reflects current conditions: EV/EBITDA LTM of 7.8 and P/E LTM of 15.6 do not look cheap, and the portal's model implies only 2% upside. For an investor, the key question is the sustainability of oil prices; without further gains, the upside for the shares is limited. Our verdict is neutral.
Open the company's financial profile HWX →
See also: market overview · valuation map · stock screeners