KGHM Polska Miedz: copper and silver were priced high, yet EBITDA fell short of what the quotes implied, and spot is already lower
Contents
KGHM Polska Miedz reported results for the third quarter of 2026. The average copper price in the period was 14,408 USD per tonne, 33.1% above a year earlier, and silver rose 57.6% to 62.8 USD per ounce. At those quotes, holding year-ago volumes and non-commodity costs, our calculation implies revenue of 3,061.2 million and EBITDA of 1,058.7 million; actual revenue reached 3,201.5 million, but EBITDA was only 924.4 million, 12.7% below the implied figure. Our conclusion: rather unattractive – the portal's spot model puts the share 32% below fair value, because today's copper is 15.2% and silver 34.4% below the reported-period averages. Our view: the share is rather unattractive at the current price; upside on the portal model -32%.
Our view: is there upside
Our view in numbers
| Metric | Our read |
|---|---|
| Verdict | Rather unattractive |
| Upside on the portal model | -32% |
| How the model works | spot model: EBITDA re-priced to current commodity prices at the target EV/EBITDA, against market cap |
| EV/EBITDA now and 3-year average | 4.2 vs 7.9 – a 47% discount to its history |
| Dividend yield, 12m | 0.6% |
| Net debt / EBITDA | 0.31 – low leverage |
| Strongest case for | Net debt of 975.2 million, or 0.31 times trailing-twelve-month EBITDA, and positive operating cash flow of 516.6 million give the company a cushion many commodity producers lack. |
| Strongest case against | The portal's spot model values the share 32% below the current price, because at today's quotes EBITDA falls to 1,202.9 million from 3,358.2 million over the last twelve months. |
| What would change the view | A return of copper to 14,408 USD per tonne or above, sustained at that level, would move the verdict one step up, to neutral. |
Key takeaways
— Copper rose 33.1% year on year and silver 57.6%, but spot is already 15.2% and 34.4% below the quarterly averages
— At the period's prices our calculation implies EBITDA of 1,058.7 million, but the company delivered 924.4 million – 12.7% less
— Revenue of 3,201.5 million came in 4.6% above the implied figure while EBITDA was below it: realised prices trailed the benchmark or costs rose
— Top-line growth slowed from 51.8% in the second quarter to 40.3% in the third
— The EBITDA margin rose to 28.9% from 19.9%, a modest result given how much the metals appreciated
— Leverage is low – net debt of 975.2 million, or 0.31 times trailing-twelve-month EBITDA
— On the portal's spot model, EBITDA at today's prices is 1,202.9 million against 3,358.2 million over the last twelve months, and EV/EBITDA at current prices is 11
Key figures, USD bn
| Metric | Q3 2025 | Q3 2026 | Change |
|---|---|---|---|
| Revenue | 2.28 | 3.20 | +40.3% |
| EBITDA | 0.45 | 0.92 | +103.5% |
| Operating profit | 0.24 | 0.58 | +143.7% |
| Net profit | 0.12 | 0.52 | +333.8% |
| Operating cash flow | 0.24 | 0.52 | +117.9% |
| EBITDA margin | 19.9% | 28.9% | +9.0 pp |
| Net margin | 5.2% | 16.1% | +10.9 pp |
Copper rose 33.1% year on year and silver 57.6%, but spot is already 15.2% and 34.4% below the quarterly averages
The average copper price in the third quarter of 2026 was 14,408 USD per tonne against 10,825 USD a year earlier, up 33.1%. Copper rose 5.3% from the previous quarter. Silver averaged 62.8 USD per ounce against 39.9 USD a year earlier, up 57.6%, but fell 14.1% from the previous quarter.
For KGHM this is the main revenue driver: in the portal's model copper accounts for 72% of sales and silver for 18%. The metals' appreciation explains the 40.3% year-on-year rise in revenue to 3,201.5 million.
On 21 November 2026, however, copper trades at 12,217 USD, 15.2% below the reported-period average, and silver at 41.2 USD, 34.4% below. The market no longer confirms the prices on which the reported quarter was built, and that is the main risk to future earnings.
Commodity prices: period average and now
| Benchmark | Year ago | Q3 2026 | YoY | Spot 2026-11-21 |
|---|---|---|---|---|
| Copper, USD | 10 825 | 14 408 | +33,1% | 12 217 |
| Silver, USD | 39,9 | 62,8 | +57,6% | 41,2 |
| US Diesel Index (EIA) (input cost), USD | 3,75 | 5,45 | +45,3% | 5,94 |
| Electricity Spot (input cost), USD | 62,9 | 102,8 | +63,3% | 78,8 |
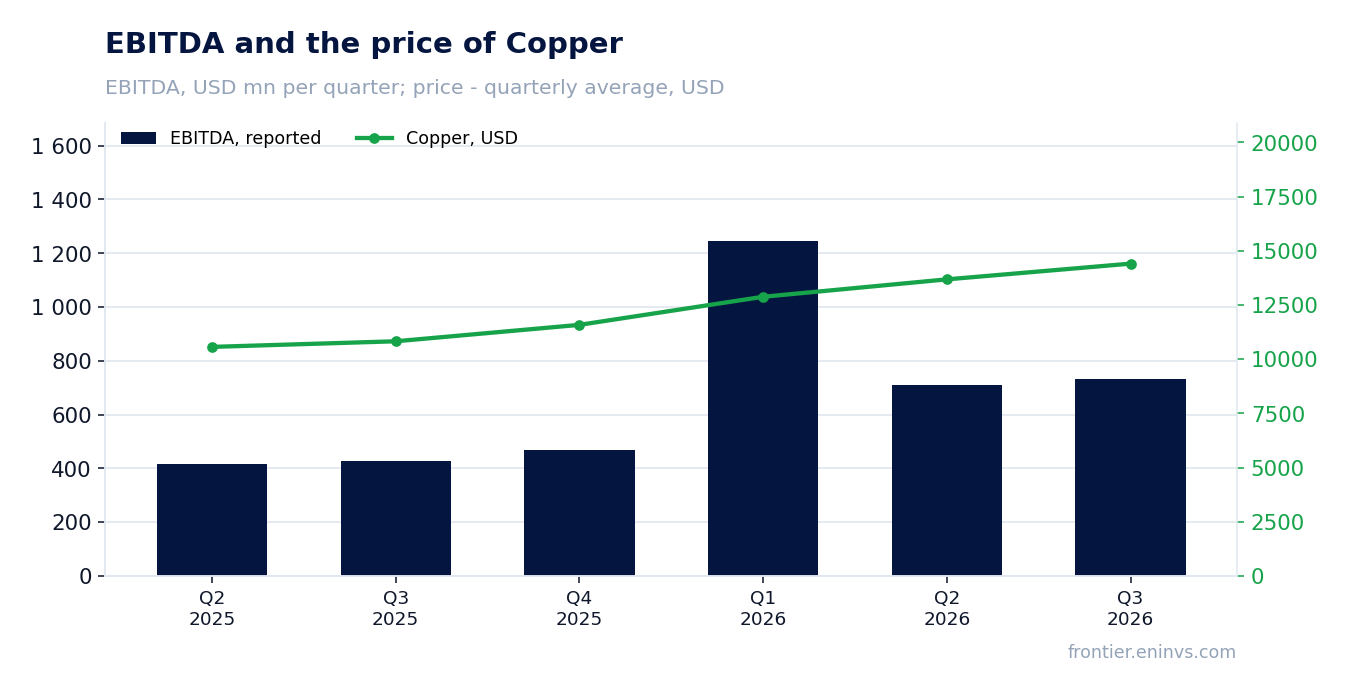
At the period's prices our calculation implies EBITDA of 1,058.7 million, but the company delivered 924.4 million – 12.7% less
Holding third-quarter 2025 volumes and non-commodity costs and moving only the reported period's prices, revenue would have been 3,061.2 million and EBITDA 1,058.7 million. The price effect would have added 780.0 million to revenue, while higher diesel and electricity would have taken 175.5 million off costs.
Actual revenue of 3,201.5 million came in 140.3 million, or 4.6%, above the implied figure. But EBITDA of 924.4 million was 134.3 million, or 12.7%, below it. In other words, the company sold more than the prices implied but earned less on each unit.
The facts do not name the reason for the gap. Revenue above the implied figure with EBITDA below it means either realised prices trailed the benchmark quotes, or unit costs rose, or revenue contained low-margin non-commodity items. The provided data give no reported explanation, and we do not invent one.
What the prices implied and what the company earned
| Base (Q3 2025) | Implied at period prices | Reported | Reported vs implied | |
|---|---|---|---|---|
| Revenue, USD mn | 2 281 | 3 061 | 3 202 | +4,6% |
| EBITDA, USD mn | 454,3 | 1 059 | 924,4 | -12,7% |
Revenue and EBITDA by quarter
| Period | Measure | bn USD |
|---|---|---|
| Q2 2025 | Revenue | 2.298294 |
| Q3 2025 | Revenue | 2.281247 |
| Q4 2025 | Revenue | 2.883433 |
| Q1 2026 | Revenue | 3.247372 |
| Q2 2026 | Revenue | 3.488924 |
| Q3 2026 | Revenue | 3.201509 |
| Q2 2025 | EBITDA | 0.41568900000000003 |
| Q3 2025 | EBITDA | 0.42607100000000003 |
| Q4 2025 | EBITDA | 0.467614 |
| Q1 2026 | EBITDA | 1.2473059999999998 |
| Q2 2026 | EBITDA | 0.710883 |
| Q3 2026 | EBITDA | 0.733673 |
EBITDA margin
| Period | Measure | % |
|---|---|---|
| Q2 2025 | EBITDA margin | 18.1 |
| Q3 2025 | EBITDA margin | 18.7 |
| Q4 2025 | EBITDA margin | 16.2 |
| Q1 2026 | EBITDA margin | 38.4 |
| Q2 2026 | EBITDA margin | 20.4 |
| Q3 2026 | EBITDA margin | 22.9 |
Revenue of 3,201.5 million came in 4.6% above the implied figure while EBITDA was below it: realised prices trailed the benchmark or costs rose
The comparison with the previous quarter gives the same picture. At second-quarter volumes and costs and third-quarter prices, revenue would have been 3,533.3 million and EBITDA 680.9 million. Actual revenue of 3,201.5 million was 331.8 million, or 9.4%, below, while EBITDA of 924.4 million was 243.5 million, or 35.8%, above.
Here the picture is reversed: fewer sales than the prices implied, but more profit. That could point to lower unit costs or to one-off items in EBITDA, but the facts give no specific cause.
Taken together, the two calculations show that the link between quotes and KGHM's profit was not direct this quarter. Metals rose, yet the company earned less than the benchmark arithmetic promised, while versus the previous quarter it earned more. For an investor this means copper alone is not a reliable guide to earnings.
Top-line growth slowed from 51.8% in the second quarter to 40.3% in the third
In the second quarter of 2026 revenue grew 51.8% year on year; in the third, 40.3%. The slowdown reflects the high base: a year earlier the third quarter was stronger than the second, so the low-base effect was smaller.
Third-quarter revenue of 3,201.5 million is below the 3,488.9 million of the second quarter, even though copper prices were higher. That is further evidence that sales volumes or the revenue mix changed.
For valuation the pace matters less than the fact that it rests on high metals prices that have already retreated. If spot holds, year-on-year revenue growth will slow next quarter.
The EBITDA margin rose to 28.9% from 19.9%, a modest result given how much the metals appreciated
The EBITDA margin in the reported quarter was 28.9% against 19.9% a year earlier. A 9-percentage-point rise looks substantial, but it is less than one might expect with copper up 33.1% and silver up 57.6%.
Diesel costs rose 45.3% year on year to 5.454 USD, and electricity 63.3% to 102.8 USD. In the portal's model diesel accounts for 10% of costs and electricity for 5%, and their appreciation ate into part of the price gain.
The net margin rose to 16.1% from 5.2%, and net profit to 515.3 million from 118.8 million a year earlier. Such profit growth on a modest EBITDA margin gain suggests favourable changes below the operating line too, but the facts do not disclose their source.
Valuation vs its own history
now vs the 3-year average
| Period | Measure | × |
|---|---|---|
| EV/EBITDA | Now | 4.1816464981297425 |
| EV/EBITDA | 3-year average | 7.906190748070847 |
Leverage is low – net debt of 975.2 million, or 0.31 times trailing-twelve-month EBITDA
As of 30 September 2026 KGHM's net debt was 975.2 million. Against trailing-twelve-month EBITDA of 3,159.5 million that gives a ratio of 0.31, a low level for a commodity company.
Operating cash flow in the reported quarter was positive at 516.6 million, and capital expenditure was 320.3 million. Free cash flow therefore remains positive, though we do not calculate it separately.
Low leverage provides a cushion if prices fall. But it also means debt is not the main valuation factor: at 4.2 times trailing-twelve-month EV/EBITDA the market is paying for earnings, not for the balance sheet.
Share price, three years
close, last point 2026-11-20
| Period | Measure | USD per share |
|---|---|---|
| 2025-11-20 | Closing price | 195.10000610351562 |
| 2025-11-21 | Closing price | 191.0500030517578 |
| 2025-11-24 | Closing price | 195.89999389648438 |
| 2025-11-25 | Closing price | 198.35000610351562 |
| 2025-11-26 | Closing price | 205.0 |
| 2025-11-27 | Closing price | 205.39999389648438 |
| 2025-11-28 | Closing price | 211.6999969482422 |
| 2025-12-01 | Closing price | 217.89999389648438 |
| 2025-12-02 | Closing price | 218.0 |
| 2025-12-03 | Closing price | 222.89999389648438 |
| 2025-12-04 | Closing price | 225.10000610351562 |
| 2025-12-05 | Closing price | 235.0 |
| 2025-12-08 | Closing price | 234.39999389648438 |
| 2025-12-09 | Closing price | 235.8000030517578 |
| 2025-12-10 | Closing price | 241.5 |
| 2025-12-11 | Closing price | 245.0 |
| 2025-12-12 | Closing price | 244.5 |
| 2025-12-15 | Closing price | 250.8000030517578 |
| 2025-12-16 | Closing price | 253.6999969482422 |
| 2025-12-17 | Closing price | 259.6000061035156 |
| 2025-12-18 | Closing price | 256.29998779296875 |
| 2025-12-19 | Closing price | 261.0 |
| 2025-12-22 | Closing price | 272.3999938964844 |
| 2025-12-23 | Closing price | 273.79998779296875 |
| 2025-12-29 | Closing price | 273.1000061035156 |
| 2025-12-30 | Closing price | 280.79998779296875 |
| 2026-01-02 | Closing price | 283.5 |
| 2026-01-05 | Closing price | 296.5 |
| 2026-01-07 | Closing price | 294.3999938964844 |
| 2026-01-08 | Closing price | 280.29998779296875 |
| 2026-01-09 | Closing price | 297.79998779296875 |
| 2026-01-12 | Closing price | 303.0 |
| 2026-01-13 | Closing price | 308.70001220703125 |
| 2026-01-14 | Closing price | 315.8999938964844 |
| 2026-01-15 | Closing price | 325.6000061035156 |
| 2026-01-16 | Closing price | 310.70001220703125 |
| 2026-01-19 | Closing price | 319.8999938964844 |
| 2026-01-20 | Closing price | 319.8999938964844 |
| 2026-01-21 | Closing price | 319.8999938964844 |
| 2026-01-22 | Closing price | 313.5 |
| 2026-01-23 | Closing price | 328.29998779296875 |
| 2026-01-26 | Closing price | 355.79998779296875 |
| 2026-01-27 | Closing price | 332.0 |
| 2026-01-28 | Closing price | 352.70001220703125 |
| 2026-01-29 | Closing price | 371.8999938964844 |
| 2026-01-30 | Closing price | 332.1000061035156 |
| 2026-02-02 | Closing price | 312.20001220703125 |
| 2026-02-03 | Closing price | 340.0 |
| 2026-02-04 | Closing price | 333.8999938964844 |
| 2026-02-05 | Closing price | 310.20001220703125 |
| 2026-02-06 | Closing price | 311.0 |
| 2026-02-09 | Closing price | 321.20001220703125 |
| 2026-02-10 | Closing price | 304.6000061035156 |
| 2026-02-11 | Closing price | 320.0 |
| 2026-02-12 | Closing price | 322.3999938964844 |
| 2026-02-13 | Closing price | 317.3999938964844 |
| 2026-02-16 | Closing price | 305.0 |
| 2026-02-17 | Closing price | 285.29998779296875 |
| 2026-02-18 | Closing price | 302.20001220703125 |
| 2026-02-19 | Closing price | 299.0 |
| 2026-02-20 | Closing price | 305.5 |
| 2026-02-23 | Closing price | 315.70001220703125 |
| 2026-02-24 | Closing price | 321.8999938964844 |
| 2026-02-25 | Closing price | 342.0 |
| 2026-02-26 | Closing price | 321.79998779296875 |
| 2026-02-27 | Closing price | 335.5 |
| 2026-03-02 | Closing price | 326.5 |
| 2026-03-03 | Closing price | 299.5 |
| 2026-03-04 | Closing price | 310.70001220703125 |
| 2026-03-05 | Closing price | 296.5 |
| 2026-03-06 | Closing price | 290.8999938964844 |
| 2026-03-09 | Closing price | 289.3999938964844 |
| 2026-03-10 | Closing price | 303.0 |
| 2026-03-11 | Closing price | 293.0 |
| 2026-03-12 | Closing price | 288.20001220703125 |
| 2026-03-13 | Closing price | 282.6000061035156 |
| 2026-03-16 | Closing price | 283.5 |
| 2026-03-17 | Closing price | 280.5 |
| 2026-03-18 | Closing price | 273.8999938964844 |
| 2026-03-19 | Closing price | 259.79998779296875 |
| 2026-03-20 | Closing price | 257.20001220703125 |
| 2026-03-23 | Closing price | 266.29998779296875 |
| 2026-03-24 | Closing price | 264.0 |
| 2026-03-25 | Closing price | 272.70001220703125 |
| 2026-03-26 | Closing price | 260.20001220703125 |
| 2026-03-27 | Closing price | 259.79998779296875 |
| 2026-03-30 | Closing price | 261.29998779296875 |
| 2026-03-31 | Closing price | 267.8999938964844 |
| 2026-04-01 | Closing price | 287.6000061035156 |
| 2026-04-02 | Closing price | 284.5 |
| 2026-04-07 | Closing price | 277.20001220703125 |
| 2026-04-08 | Closing price | 304.5 |
| 2026-04-09 | Closing price | 303.20001220703125 |
| 2026-04-10 | Closing price | 313.20001220703125 |
| 2026-04-13 | Closing price | 305.3999938964844 |
| 2026-04-14 | Closing price | 316.79998779296875 |
| 2026-04-15 | Closing price | 325.0 |
| 2026-04-16 | Closing price | 322.54998779296875 |
| 2026-04-17 | Closing price | 341.6499938964844 |
| 2026-04-20 | Closing price | 335.3500061035156 |
| 2026-04-21 | Closing price | 320.54998779296875 |
| 2026-04-22 | Closing price | 324.0 |
| 2026-04-23 | Closing price | 323.3500061035156 |
| 2026-04-24 | Closing price | 318.1000061035156 |
| 2026-04-27 | Closing price | 312.0 |
| 2026-04-28 | Closing price | 299.20001220703125 |
| 2026-04-29 | Closing price | 299.8999938964844 |
| 2026-04-30 | Closing price | 302.79998779296875 |
| 2026-05-04 | Closing price | 294.6000061035156 |
| 2026-05-05 | Closing price | 301.25 |
| 2026-05-06 | Closing price | 332.8500061035156 |
| 2026-05-07 | Closing price | 334.0 |
| 2026-05-08 | Closing price | 338.6499938964844 |
| 2026-05-11 | Closing price | 356.6499938964844 |
| 2026-05-12 | Closing price | 352.0 |
| 2026-05-13 | Closing price | 380.0 |
| 2026-05-14 | Closing price | 367.8999938964844 |
| 2026-05-15 | Closing price | 336.1499938964844 |
| 2026-05-18 | Closing price | 339.45001220703125 |
| 2026-05-19 | Closing price | 320.3500061035156 |
| 2026-05-20 | Closing price | 326.20001220703125 |
| 2026-05-21 | Closing price | 323.25 |
| 2026-05-22 | Closing price | 330.5 |
| 2026-05-25 | Closing price | 341.5 |
| 2026-05-26 | Closing price | 334.70001220703125 |
| 2026-05-27 | Closing price | 337.1499938964844 |
| 2026-05-28 | Closing price | 344.79998779296875 |
| 2026-05-29 | Closing price | 349.54998779296875 |
| 2026-06-01 | Closing price | 350.8999938964844 |
| 2026-06-02 | Closing price | 376.5 |
| 2026-06-03 | Closing price | 370.1000061035156 |
| 2026-06-05 | Closing price | 345.45001220703125 |
| 2026-06-08 | Closing price | 340.0 |
| 2026-06-09 | Closing price | 335.45001220703125 |
| 2026-06-10 | Closing price | 326.1499938964844 |
| 2026-06-11 | Closing price | 333.79998779296875 |
| 2026-06-12 | Closing price | 360.8500061035156 |
| 2026-06-15 | Closing price | 377.54998779296875 |
| 2026-06-16 | Closing price | 384.25 |
| 2026-06-17 | Closing price | 392.0 |
| 2026-06-18 | Closing price | 374.29998779296875 |
| 2026-06-19 | Closing price | 365.5 |
| 2026-06-22 | Closing price | 368.04998779296875 |
| 2026-06-23 | Closing price | 349.70001220703125 |
| 2026-06-24 | Closing price | 324.20001220703125 |
| 2026-06-25 | Closing price | 329.5 |
| 2026-06-26 | Closing price | 327.75 |
| 2026-06-29 | Closing price | 321.0 |
| 2026-06-30 | Closing price | 331.25 |
| 2026-07-01 | Closing price | 328.6499938964844 |
| 2026-07-02 | Closing price | 332.04998779296875 |
| 2026-07-03 | Closing price | 335.0 |
| 2026-07-06 | Closing price | 328.54998779296875 |
| 2026-07-07 | Closing price | 319.04998779296875 |
| 2026-07-08 | Closing price | 297.70001220703125 |
| 2026-07-09 | Closing price | 304.6000061035156 |
| 2026-07-10 | Closing price | 308.95001220703125 |
| 2026-07-13 | Closing price | 305.45001220703125 |
| 2026-07-14 | Closing price | 319.3999938964844 |
| 2026-07-15 | Closing price | 313.3999938964844 |
| 2026-07-16 | Closing price | 303.0 |
| 2026-07-17 | Closing price | 293.70001220703125 |
| 2026-07-20 | Closing price | 293.45001220703125 |
| 2026-07-21 | Closing price | 306.45001220703125 |
| 2026-07-22 | Closing price | 314.5 |
| 2026-07-23 | Closing price | 302.0 |
| 2026-07-24 | Closing price | 303.5 |
| 2026-07-27 | Closing price | 302.5 |
| 2026-07-28 | Closing price | 292.54998779296875 |
| 2026-07-29 | Closing price | 294.3500061035156 |
| 2026-07-30 | Closing price | 309.25 |
| 2026-07-31 | Closing price | 307.95001220703125 |
| 2026-08-03 | Closing price | 312.8500061035156 |
| 2026-08-04 | Closing price | 339.04998779296875 |
| 2026-08-05 | Closing price | 346.1000061035156 |
| 2026-08-06 | Closing price | 350.8500061035156 |
| 2026-08-07 | Closing price | 352.95001220703125 |
| 2026-08-10 | Closing price | 358.79998779296875 |
| 2026-08-11 | Closing price | 364.5 |
| 2026-08-12 | Closing price | 367.1499938964844 |
| 2026-08-13 | Closing price | 355.79998779296875 |
| 2026-08-14 | Closing price | 352.5 |
| 2026-08-17 | Closing price | 345.20001220703125 |
| 2026-08-18 | Closing price | 334.5 |
| 2026-08-19 | Closing price | 348.0 |
| 2026-08-20 | Closing price | 332.45001220703125 |
| 2026-08-21 | Closing price | 342.3500061035156 |
| 2026-08-24 | Closing price | 358.3999938964844 |
| 2026-08-25 | Closing price | 366.0 |
| 2026-08-26 | Closing price | 364.3500061035156 |
| 2026-08-27 | Closing price | 361.6000061035156 |
| 2026-08-28 | Closing price | 362.0 |
| 2026-08-31 | Closing price | 357.20001220703125 |
| 2026-09-01 | Closing price | 347.0 |
| 2026-09-02 | Closing price | 344.1499938964844 |
| 2026-09-03 | Closing price | 352.20001220703125 |
| 2026-09-04 | Closing price | 356.0 |
| 2026-09-07 | Closing price | 358.0 |
| 2026-09-08 | Closing price | 374.70001220703125 |
| 2026-09-09 | Closing price | 378.0 |
| 2026-09-10 | Closing price | 347.04998779296875 |
| 2026-09-11 | Closing price | 351.8999938964844 |
| 2026-09-14 | Closing price | 333.75 |
| 2026-09-15 | Closing price | 326.95001220703125 |
| 2026-09-16 | Closing price | 331.6499938964844 |
| 2026-09-17 | Closing price | 340.8999938964844 |
| 2026-09-18 | Closing price | 337.04998779296875 |
| 2026-09-21 | Closing price | 344.8999938964844 |
| 2026-09-22 | Closing price | 347.25 |
| 2026-09-23 | Closing price | 342.6499938964844 |
| 2026-09-24 | Closing price | 335.8500061035156 |
| 2026-09-25 | Closing price | 330.5 |
| 2026-09-28 | Closing price | 321.5 |
| 2026-09-29 | Closing price | 323.0 |
| 2026-09-30 | Closing price | 329.54998779296875 |
| 2026-10-01 | Closing price | 321.20001220703125 |
| 2026-10-02 | Closing price | 335.29998779296875 |
| 2026-10-05 | Closing price | 335.29998779296875 |
| 2026-10-06 | Closing price | 335.29998779296875 |
| 2026-10-07 | Closing price | 334.6000061035156 |
| 2026-10-08 | Closing price | 328.3500061035156 |
| 2026-10-09 | Closing price | 347.0 |
| 2026-10-12 | Closing price | 349.70001220703125 |
| 2026-10-13 | Closing price | 344.6499938964844 |
| 2026-10-14 | Closing price | 331.1000061035156 |
| 2026-10-15 | Closing price | 324.25 |
| 2026-10-16 | Closing price | 327.75 |
| 2026-10-19 | Closing price | 318.04998779296875 |
| 2026-10-20 | Closing price | 320.0 |
| 2026-10-21 | Closing price | 311.29998779296875 |
| 2026-10-22 | Closing price | 296.70001220703125 |
| 2026-10-23 | Closing price | 293.20001220703125 |
| 2026-10-26 | Closing price | 300.0 |
| 2026-10-27 | Closing price | 305.54998779296875 |
| 2026-10-28 | Closing price | 303.8500061035156 |
| 2026-10-29 | Closing price | 303.04998779296875 |
| 2026-10-30 | Closing price | 281.6000061035156 |
| 2026-11-02 | Closing price | 287.8500061035156 |
| 2026-11-03 | Closing price | 275.3500061035156 |
| 2026-11-04 | Closing price | 286.8999938964844 |
| 2026-11-05 | Closing price | 279.79998779296875 |
| 2026-11-06 | Closing price | 276.79998779296875 |
| 2026-11-09 | Closing price | 289.3999938964844 |
| 2026-11-10 | Closing price | 288.0 |
| 2026-11-12 | Closing price | 284.29998779296875 |
| 2026-11-13 | Closing price | 276.0 |
| 2026-11-16 | Closing price | 267.0 |
| 2026-11-17 | Closing price | 264.29998779296875 |
| 2026-11-18 | Closing price | 248.1999969482422 |
| 2026-11-19 | Closing price | 255.75 |
| 2026-11-20 | Closing price | 241.6999969482422 |
On the portal's spot model, EBITDA at today's prices is 1,202.9 million against 3,358.2 million over the last twelve months, and EV/EBITDA at current prices is 11
Over the last twelve months KGHM earned 3,358.2 million of EBITDA, but that money was earned at high metals prices. On the portal's spot model, at today's quotes annual EBITDA would be 1,202.9 million, 64.2% less.
On that base EV/EBITDA at current prices is 11, not the historical 4.2. The ratio of net debt to EBITDA at current prices is 0.81, still comfortable but no longer so small.
The trailing-twelve-month EV/EBITDA is 4.2 against a three-year average of 7.9, a 47% discount. At first glance the share is cheaper than its own history, but that history was built on different copper prices. On the portal's spot model fair value is 32% below the current price.
Valuation on the latest reported figures
| Metric | Value |
|---|---|
| Market cap | 12.2 bn USD |
| P/E (LTM) | 4.4 |
| EV/EBITDA (LTM) | 4.2 |
| P/B | 1.34 |
| Net debt / EBITDA (LTM) | 0.31 |
| Operating cash flow (LTM) | 1.58 bn |
| ROE | 19.3% |
| Dividend yield (12m) | 0.6% |
| EV/EBITDA, 3-year average | 7.9 |
Net profit by quarter
| Period | Measure | bn USD |
|---|---|---|
| Q2 2025 | Net profit | 0.06643500000000001 |
| Q3 2025 | Net profit | 0.118795 |
| Q4 2025 | Net profit | 0.734939 |
| Q1 2026 | Net profit | 0.965294 |
| Q2 2026 | Net profit | 0.557076 |
| Q3 2026 | Net profit | 0.515274 |
Bottom line
The report's strength remains the balance sheet: net debt of 975.2 million, or 0.31 times trailing-twelve-month EBITDA, and positive operating cash flow of 516.6 million. But the key ratio for a commodity company – price versus cost – worked out worse than the quotes promised: EBITDA of 924.4 million was 12.7% below the price-implied figure. Profit growth of 4.3 times year on year is impressive, but it rests on prices that have already retreated: spot copper is 15.2% and silver 34.4% below the quarterly averages. On the portal's spot model the share trades 32% above fair value, and that gap outweighs the 47% discount to its own three-year EV/EBITDA history. Our conclusion: rather unattractive. Our view: the share is rather unattractive at the current price; upside on the portal model -32%.