Meren Energy: Brent rose 34.2% but EBITDA fell 23.6% – the price did not reach the P&L
Contents
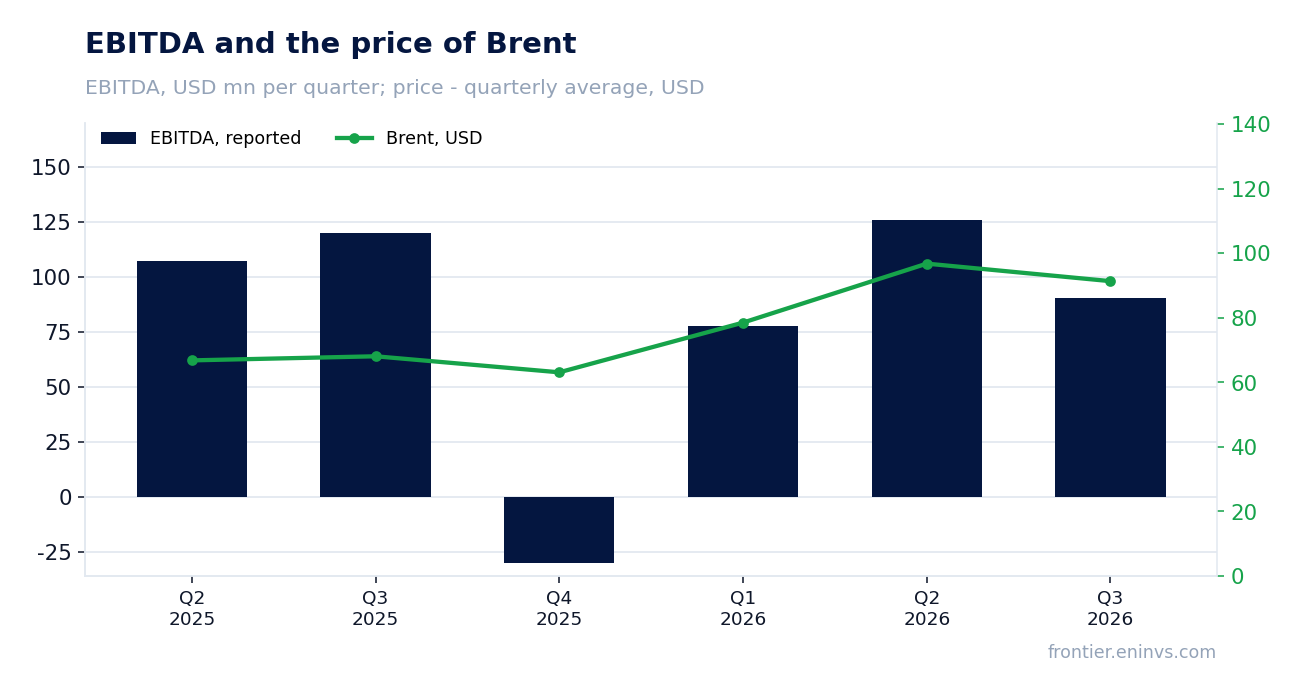
On 17 November Meren Energy released its third-quarter 2026 results. The average Brent price in the period was 91.3 dollars against 68 dollars a year earlier (+34.2%), yet revenue fell 11.2% to 192.4 million, EBITDA fell 23.6% to 90.5 million and net profit fell 75.0% to 1.3 million. At the year-ago volumes and costs and moving only the oil price, our calculation implies revenue of 287.1 million and EBITDA of 188.8 million – the company earned 98.3 million of EBITDA less than the price allowed. Our conclusion: rather attractive – an EV/EBITDA of 3.0 against the portal spot model's 416.6 million of EBITDA at current prices leaves room, but the gap between price and the report has to close. Our view: the share is rather attractive at the current price.
Our view: is there upside
Our view in numbers
| Metric | Our read |
|---|---|
| Verdict | Rather attractive |
| Upside on the portal model | no portal model for this share |
| Dividend yield, 12m | 11.1% |
| Net debt / EBITDA | 0.46 – low leverage |
| Strongest case for | The portal spot model puts annual EBITDA at 416.6 million at current prices, 20.4% above the LTM figure and equivalent to EV/EBITDA of 2.5 – there is room if the gap closes. |
| Strongest case against | Revenue fell 11.2% while Brent rose 34.2% and EBITDA fell 23.6%, and the 98.3 million gap against the implied figure shows the price is not reaching profit. |
| What would change the view | If the next report shows EBITDA at the same prices close to the implied 188.8 million, the verdict moves to attractive; if the gap persists, it moves to fairly valued. |
Key takeaways
— Brent rose 34.2% year on year, yet revenue fell 11.2% – the price did not reach the P&L
— At the period's prices our calculation implies EBITDA of 188.8 million; the company reported 90.5 million – a gap of 98.3 million
— The EBITDA margin compressed from 54.6% to 47.0%, and price is no help here – the cause lies in volumes and unit costs
— Net profit almost vanished – 1.3 million against 5.2 million a year earlier, even though EBITDA stayed positive
— Operating cash flow of 72.7 million against capex of 14.4 million – there is enough cash for both investment and dividends
— Leverage of 0.46 LTM EBITDA – a level that falls to 0.37 at current prices
— An 11.1% dividend yield against the rate the stock has to beat – the main argument for the share
Key figures, USD bn
| Metric | Q3 2025 | Q3 2026 | Change |
|---|---|---|---|
| Revenue | 0.22 | 0.19 | -11.2% |
| EBITDA | 0.12 | 0.09 | -23.6% |
| Operating profit | 0.05 | 0.05 | +1.7% |
| Net profit | 0.01 | 0.00 | -75.0% |
| Operating cash flow | 0.15 | 0.07 | -50.4% |
| Capex | 0.02 | 0.01 | -33.9% |
| EBITDA margin | 54.6% | 47.0% | -7.6 pp |
| Net margin | 2.4% | 0.7% | -1.7 pp |
Brent rose 34.2% year on year, yet revenue fell 11.2% – the price did not reach the P&L
The average Brent price in the third quarter of 2026 was 91.3 dollars against 68 dollars a year earlier, up 34.2%. Against the previous quarter the price fell 5.6%, from 96.8 dollars. Spot now stands at 92.8 dollars, only 1.6% above the period average.
Quarterly revenue was 192.4 million, down 11.2% year on year. That divergence from the price is the main fact of the report: with oil up by a third, the company sold less than a year earlier. The cause lies in volumes and in the realised price against the benchmark, not in Brent itself.
Commodity prices: period average and now
| Benchmark | Year ago | Q3 2026 | YoY | Spot 2026-11-17 |
|---|---|---|---|---|
| Brent, USD | 68,0 | 91,3 | +34,2% | 92,8 |
At the period's prices our calculation implies EBITDA of 188.8 million; the company reported 90.5 million – a gap of 98.3 million
At the year-ago volumes and non-commodity costs and moving only the oil price, our calculation implies revenue of 287.1 million (a price effect of +70.4 million, or +32.5%) and EBITDA of 188.8 million. Actual revenue came in 94.7 million lower and EBITDA 98.3 million lower, a shortfall of 52.1%.
Against the previous quarter the picture reverses: at second-quarter 2026 prices revenue should have been 186.2 million, and the company reported 192.4 million, 6.2 million more. Yet EBITDA was 24.8 million below the implied 115.3 million. That means the company sold above the benchmark or had a different sales mix in the second quarter, and the advantage disappeared in the third.
The gap is explained by volumes, the realised price against Brent and unit costs. The report does not break down which of the three weighs most, so we record the gap itself rather than guess at its composition.
What the prices implied and what the company earned
| Base (Q3 2025) | Implied at period prices | Reported | Reported vs implied | |
|---|---|---|---|---|
| Revenue, USD mn | 216,7 | 287,1 | 192,4 | -33,0% |
| EBITDA, USD mn | 118,4 | 188,8 | 90,5 | -52,1% |
Revenue and EBITDA by quarter
| Period | Measure | bn USD |
|---|---|---|
| Q2 2025 | Revenue | 0.0693 |
| Q3 2025 | Revenue | 0.21669999999999998 |
| Q4 2025 | Revenue | 0.1997 |
| Q1 2026 | Revenue | 0.1143 |
| Q2 2026 | Revenue | 0.19669999999999999 |
| Q3 2026 | Revenue | 0.19240000000000002 |
| Q2 2025 | EBITDA | 0.107 |
| Q3 2025 | EBITDA | 0.1198 |
| Q4 2025 | EBITDA | −0.029900000000000006 |
| Q1 2026 | EBITDA | 0.07759999999999999 |
| Q2 2026 | EBITDA | 0.1258 |
| Q3 2026 | EBITDA | 0.0906 |
EBITDA margin
| Period | Measure | % |
|---|---|---|
| Q2 2025 | EBITDA margin | 154.4 |
| Q3 2025 | EBITDA margin | 55.3 |
| Q4 2025 | EBITDA margin | −15.0 |
| Q1 2026 | EBITDA margin | 67.9 |
| Q2 2026 | EBITDA margin | 64.0 |
| Q3 2026 | EBITDA margin | 47.1 |
The EBITDA margin compressed from 54.6% to 47.0%, and price is no help here – the cause lies in volumes and unit costs
The EBITDA margin for the reported quarter was 47.0% against 54.6% a year earlier. With the price up 34.2%, the margin could not have compressed because of oil – either more cost sits behind each unit or each unit brings less revenue.
EBITDA of 90.5 million is operating profit of 47.3 million plus depreciation of 43.3 million. Operating profit fell faster than revenue, which confirms the issue is costs, not price.
For a producer this is the key question: if unit costs rose one-off, the margin recovers with the price; if it is a shift in the field mix or higher transport costs, the pressure stays even with expensive oil.
Net profit almost vanished – 1.3 million against 5.2 million a year earlier, even though EBITDA stayed positive
Quarterly net profit was 1.3 million against 5.2 million a year earlier, down 75.0%. The net margin was 0.7% against 2.4%. With EBITDA of 90.5 million, almost everything was consumed below operating profit: interest, depreciation and other items.
Depreciation of 43.3 million is already deducted in arriving at operating profit of 47.3 million, so the main gap between operating and net profit comes from lines below operating income. The report does not break them out, so we do not attribute the fall to interest, FX or one-off charges.
For a shareholder this matters: earnings per share are close to zero, and the dividend base rests on cash flow, not on profit.
Operating cash flow of 72.7 million against capex of 14.4 million – there is enough cash for both investment and dividends
Quarterly operating cash flow was 72.7 million and capex 14.4 million. Free cash flow is therefore about 58.3 million, comfortably covering dividend payments at an 11.1% yield.
Capex of 14.4 million is small against EBITDA of 90.5 million – the company spends less than a fifth of its cash flow on sustaining production. That supports the payout but also means production growth is unlikely without higher investment.
Over the last twelve months operating cash flow was 191.7 million on revenue of 703.1 million – cash conversion is high, and that is the main argument for the dividend.
Leverage of 0.46 LTM EBITDA – a level that falls to 0.37 at current prices
Net debt at the end of the reported period was 156.2 million. The ratio of net debt to last-twelve-month EBITDA is 0.46, and 0.37 on the portal spot model at current prices. That is low leverage for a producer and poses no risk to the dividend.
Last-twelve-month EBITDA was 341.1 million on revenue of 703.1 million. The portal spot model puts annual EBITDA at today's prices at 416.6 million, 20.4% above the LTM figure. That means current leverage is if anything understated relative to the forward base.
Interest on debt is not disclosed separately, but at this level of leverage it cannot be the main reason net profit fell to 1.3 million.
Share price, three years
close, last point 2026-11-16
| Period | Measure | USD per share |
|---|---|---|
| 2025-11-17 | Closing price | 1.7999999523162842 |
| 2025-11-18 | Closing price | 1.8300000429153442 |
| 2025-11-19 | Closing price | 1.8200000524520874 |
| 2025-11-20 | Closing price | 1.8300000429153442 |
| 2025-11-21 | Closing price | 1.7400000095367432 |
| 2025-11-24 | Closing price | 1.7100000381469727 |
| 2025-11-25 | Closing price | 1.6799999475479126 |
| 2025-11-26 | Closing price | 1.6799999475479126 |
| 2025-11-27 | Closing price | 1.690000057220459 |
| 2025-11-28 | Closing price | 1.7100000381469727 |
| 2025-12-01 | Closing price | 1.7100000381469727 |
| 2025-12-02 | Closing price | 1.7100000381469727 |
| 2025-12-03 | Closing price | 1.7599999904632568 |
| 2025-12-04 | Closing price | 1.7899999618530273 |
| 2025-12-05 | Closing price | 1.8300000429153442 |
| 2025-12-08 | Closing price | 1.840000033378601 |
| 2025-12-09 | Closing price | 1.809999942779541 |
| 2025-12-10 | Closing price | 1.840000033378601 |
| 2025-12-11 | Closing price | 1.8200000524520874 |
| 2025-12-12 | Closing price | 1.8200000524520874 |
| 2025-12-15 | Closing price | 1.7999999523162842 |
| 2025-12-16 | Closing price | 1.7300000190734863 |
| 2025-12-17 | Closing price | 1.7599999904632568 |
| 2025-12-18 | Closing price | 1.7300000190734863 |
| 2025-12-19 | Closing price | 1.7300000190734863 |
| 2025-12-22 | Closing price | 1.7599999904632568 |
| 2025-12-23 | Closing price | 1.7799999713897705 |
| 2025-12-24 | Closing price | 1.7799999713897705 |
| 2025-12-29 | Closing price | 1.7799999713897705 |
| 2025-12-30 | Closing price | 1.8200000524520874 |
| 2025-12-31 | Closing price | 1.7999999523162842 |
| 2026-01-02 | Closing price | 1.8700000047683716 |
| 2026-01-05 | Closing price | 1.840000033378601 |
| 2026-01-06 | Closing price | 1.7899999618530273 |
| 2026-01-07 | Closing price | 1.7899999618530273 |
| 2026-01-08 | Closing price | 1.8300000429153442 |
| 2026-01-09 | Closing price | 1.840000033378601 |
| 2026-01-12 | Closing price | 1.850000023841858 |
| 2026-01-13 | Closing price | 1.909999966621399 |
| 2026-01-14 | Closing price | 1.940000057220459 |
| 2026-01-15 | Closing price | 1.9199999570846558 |
| 2026-01-16 | Closing price | 1.940000057220459 |
| 2026-01-19 | Closing price | 1.9299999475479126 |
| 2026-01-20 | Closing price | 1.909999966621399 |
| 2026-01-21 | Closing price | 1.9700000286102295 |
| 2026-01-22 | Closing price | 1.9500000476837158 |
| 2026-01-23 | Closing price | 2.0 |
| 2026-01-26 | Closing price | 2.0199999809265137 |
| 2026-01-27 | Closing price | 2.0799999237060547 |
| 2026-01-28 | Closing price | 2.140000104904175 |
| 2026-01-29 | Closing price | 2.1700000762939453 |
| 2026-01-30 | Closing price | 2.130000114440918 |
| 2026-02-02 | Closing price | 2.140000104904175 |
| 2026-02-03 | Closing price | 2.180000066757202 |
| 2026-02-04 | Closing price | 2.1500000953674316 |
| 2026-02-05 | Closing price | 2.0899999141693115 |
| 2026-02-06 | Closing price | 2.0999999046325684 |
| 2026-02-09 | Closing price | 2.0899999141693115 |
| 2026-02-10 | Closing price | 2.0399999618530273 |
| 2026-02-11 | Closing price | 2.240000009536743 |
| 2026-02-12 | Closing price | 2.2699999809265137 |
| 2026-02-13 | Closing price | 2.380000114440918 |
| 2026-02-17 | Closing price | 2.259999990463257 |
| 2026-02-18 | Closing price | 2.25 |
| 2026-02-19 | Closing price | 2.25 |
| 2026-02-20 | Closing price | 2.2799999713897705 |
| 2026-02-23 | Closing price | 2.309999942779541 |
| 2026-02-24 | Closing price | 2.2799999713897705 |
| 2026-02-25 | Closing price | 2.059999942779541 |
| 2026-02-26 | Closing price | 2.119999885559082 |
| 2026-02-27 | Closing price | 2.180000066757202 |
| 2026-03-02 | Closing price | 2.190000057220459 |
| 2026-03-03 | Closing price | 2.180000066757202 |
| 2026-03-04 | Closing price | 2.1500000953674316 |
| 2026-03-05 | Closing price | 2.190000057220459 |
| 2026-03-06 | Closing price | 2.25 |
| 2026-03-09 | Closing price | 2.180000066757202 |
| 2026-03-10 | Closing price | 2.1500000953674316 |
| 2026-03-11 | Closing price | 2.2100000381469727 |
| 2026-03-12 | Closing price | 2.2200000286102295 |
| 2026-03-13 | Closing price | 2.2699999809265137 |
| 2026-03-16 | Closing price | 2.2200000286102295 |
| 2026-03-17 | Closing price | 2.190000057220459 |
| 2026-03-18 | Closing price | 2.200000047683716 |
| 2026-03-19 | Closing price | 2.2699999809265137 |
| 2026-03-20 | Closing price | 2.190000057220459 |
| 2026-03-23 | Closing price | 2.119999885559082 |
| 2026-03-24 | Closing price | 2.240000009536743 |
| 2026-03-25 | Closing price | 2.2200000286102295 |
| 2026-03-26 | Closing price | 2.2699999809265137 |
| 2026-03-27 | Closing price | 2.4100000858306885 |
| 2026-03-30 | Closing price | 2.450000047683716 |
| 2026-03-31 | Closing price | 2.440000057220459 |
| 2026-04-01 | Closing price | 2.299999952316284 |
| 2026-04-02 | Closing price | 2.390000104904175 |
| 2026-04-06 | Closing price | 2.440000057220459 |
| 2026-04-07 | Closing price | 2.4600000381469727 |
| 2026-04-08 | Closing price | 2.359999895095825 |
| 2026-04-09 | Closing price | 2.3499999046325684 |
| 2026-04-10 | Closing price | 2.390000104904175 |
| 2026-04-13 | Closing price | 2.4700000286102295 |
| 2026-04-14 | Closing price | 2.390000104904175 |
| 2026-04-15 | Closing price | 2.4000000953674316 |
| 2026-04-16 | Closing price | 2.4600000381469727 |
| 2026-04-17 | Closing price | 2.309999942779541 |
| 2026-04-20 | Closing price | 2.369999885559082 |
| 2026-04-21 | Closing price | 2.4100000858306885 |
| 2026-04-22 | Closing price | 2.4100000858306885 |
| 2026-04-23 | Closing price | 2.450000047683716 |
| 2026-04-24 | Closing price | 2.4000000953674316 |
| 2026-04-27 | Closing price | 2.440000057220459 |
| 2026-04-28 | Closing price | 2.450000047683716 |
| 2026-04-29 | Closing price | 2.5299999713897705 |
| 2026-04-30 | Closing price | 2.490000009536743 |
| 2026-05-01 | Closing price | 2.450000047683716 |
| 2026-05-04 | Closing price | 2.509999990463257 |
| 2026-05-05 | Closing price | 2.4600000381469727 |
| 2026-05-06 | Closing price | 2.3499999046325684 |
| 2026-05-07 | Closing price | 2.3499999046325684 |
| 2026-05-08 | Closing price | 2.3299999237060547 |
| 2026-05-11 | Closing price | 2.3399999141693115 |
| 2026-05-12 | Closing price | 2.430000066757202 |
| 2026-05-13 | Closing price | 2.309999942779541 |
| 2026-05-14 | Closing price | 2.3399999141693115 |
| 2026-05-15 | Closing price | 2.3399999141693115 |
| 2026-05-19 | Closing price | 2.380000114440918 |
| 2026-05-20 | Closing price | 2.3499999046325684 |
| 2026-05-21 | Closing price | 2.319999933242798 |
| 2026-05-22 | Closing price | 2.359999895095825 |
| 2026-05-25 | Closing price | 2.2799999713897705 |
| 2026-05-26 | Closing price | 2.309999942779541 |
| 2026-05-27 | Closing price | 2.319999933242798 |
| 2026-05-28 | Closing price | 2.359999895095825 |
| 2026-05-29 | Closing price | 2.2899999618530273 |
| 2026-06-01 | Closing price | 2.3399999141693115 |
| 2026-06-02 | Closing price | 2.299999952316284 |
| 2026-06-03 | Closing price | 2.2699999809265137 |
| 2026-06-04 | Closing price | 2.2899999618530273 |
| 2026-06-05 | Closing price | 2.190000057220459 |
| 2026-06-08 | Closing price | 2.190000057220459 |
| 2026-06-09 | Closing price | 2.130000114440918 |
| 2026-06-10 | Closing price | 2.1700000762939453 |
| 2026-06-11 | Closing price | 2.130000114440918 |
| 2026-06-12 | Closing price | 2.130000114440918 |
| 2026-06-15 | Closing price | 2.0799999237060547 |
| 2026-06-16 | Closing price | 2.0199999809265137 |
| 2026-06-17 | Closing price | 2.0 |
| 2026-06-18 | Closing price | 1.9500000476837158 |
| 2026-06-19 | Closing price | 1.9700000286102295 |
| 2026-06-22 | Closing price | 1.940000057220459 |
| 2026-06-23 | Closing price | 1.940000057220459 |
| 2026-06-24 | Closing price | 1.9199999570846558 |
| 2026-06-25 | Closing price | 1.9299999475479126 |
| 2026-06-26 | Closing price | 1.9299999475479126 |
| 2026-06-29 | Closing price | 1.940000057220459 |
| 2026-06-30 | Closing price | 1.9299999475479126 |
| 2026-07-02 | Closing price | 1.9600000381469727 |
| 2026-07-03 | Closing price | 1.9900000095367432 |
| 2026-07-06 | Closing price | 1.9800000190734863 |
| 2026-07-07 | Closing price | 2.049999952316284 |
| 2026-07-08 | Closing price | 2.0799999237060547 |
| 2026-07-09 | Closing price | 2.0199999809265137 |
| 2026-07-10 | Closing price | 1.9700000286102295 |
| 2026-07-13 | Closing price | 2.0899999141693115 |
| 2026-07-14 | Closing price | 2.049999952316284 |
| 2026-07-15 | Closing price | 2.0199999809265137 |
| 2026-07-16 | Closing price | 1.9900000095367432 |
| 2026-07-17 | Closing price | 1.9900000095367432 |
| 2026-07-20 | Closing price | 2.0399999618530273 |
| 2026-07-21 | Closing price | 2.069999933242798 |
| 2026-07-22 | Closing price | 2.109999895095825 |
| 2026-07-23 | Closing price | 2.130000114440918 |
| 2026-07-24 | Closing price | 2.0799999237060547 |
| 2026-07-27 | Closing price | 2.0299999713897705 |
| 2026-07-28 | Closing price | 1.9800000190734863 |
| 2026-07-29 | Closing price | 2.0199999809265137 |
| 2026-07-30 | Closing price | 2.0199999809265137 |
| 2026-07-31 | Closing price | 2.0199999809265137 |
| 2026-08-04 | Closing price | 1.9900000095367432 |
| 2026-08-05 | Closing price | 2.0 |
| 2026-08-06 | Closing price | 2.0199999809265137 |
| 2026-08-07 | Closing price | 2.009999990463257 |
| 2026-08-10 | Closing price | 2.069999933242798 |
| 2026-08-11 | Closing price | 2.059999942779541 |
| 2026-08-12 | Closing price | 2.2100000381469727 |
| 2026-08-13 | Closing price | 2.1700000762939453 |
| 2026-08-14 | Closing price | 2.2699999809265137 |
| 2026-08-17 | Closing price | 2.259999990463257 |
| 2026-08-18 | Closing price | 2.2699999809265137 |
| 2026-08-19 | Closing price | 2.2699999809265137 |
| 2026-08-20 | Closing price | 2.1700000762939453 |
| 2026-08-21 | Closing price | 2.240000009536743 |
| 2026-08-24 | Closing price | 2.2100000381469727 |
| 2026-08-25 | Closing price | 2.2300000190734863 |
| 2026-08-26 | Closing price | 2.240000009536743 |
| 2026-08-27 | Closing price | 2.2699999809265137 |
| 2026-08-28 | Closing price | 2.25 |
| 2026-08-31 | Closing price | 2.2799999713897705 |
| 2026-09-01 | Closing price | 2.2899999618530273 |
| 2026-09-02 | Closing price | 2.2699999809265137 |
| 2026-09-03 | Closing price | 2.2200000286102295 |
| 2026-09-04 | Closing price | 2.2200000286102295 |
| 2026-09-08 | Closing price | 2.25 |
| 2026-09-09 | Closing price | 2.2899999618530273 |
| 2026-09-10 | Closing price | 2.299999952316284 |
| 2026-09-11 | Closing price | 2.299999952316284 |
| 2026-09-14 | Closing price | 2.2899999618530273 |
| 2026-09-15 | Closing price | 2.3299999237060547 |
| 2026-09-16 | Closing price | 2.2300000190734863 |
| 2026-09-17 | Closing price | 2.259999990463257 |
| 2026-09-18 | Closing price | 2.25 |
| 2026-09-21 | Closing price | 2.190000057220459 |
| 2026-09-22 | Closing price | 2.190000057220459 |
| 2026-09-23 | Closing price | 2.180000066757202 |
| 2026-09-24 | Closing price | 2.1700000762939453 |
| 2026-09-25 | Closing price | 2.1500000953674316 |
| 2026-09-28 | Closing price | 2.140000104904175 |
| 2026-09-29 | Closing price | 2.109999895095825 |
| 2026-09-30 | Closing price | 2.0899999141693115 |
| 2026-10-01 | Closing price | 2.0799999237060547 |
| 2026-10-02 | Closing price | 2.0899999141693115 |
| 2026-10-05 | Closing price | 2.0199999809265137 |
| 2026-10-06 | Closing price | 2.0199999809265137 |
| 2026-10-07 | Closing price | 2.0399999618530273 |
| 2026-10-08 | Closing price | 2.069999933242798 |
| 2026-10-09 | Closing price | 2.059999942779541 |
| 2026-10-13 | Closing price | 2.130000114440918 |
| 2026-10-14 | Closing price | 2.0999999046325684 |
| 2026-10-15 | Closing price | 2.0899999141693115 |
| 2026-10-16 | Closing price | 2.130000114440918 |
| 2026-10-19 | Closing price | 2.0999999046325684 |
| 2026-10-20 | Closing price | 2.0899999141693115 |
| 2026-10-21 | Closing price | 2.0899999141693115 |
| 2026-10-22 | Closing price | 2.109999895095825 |
| 2026-10-23 | Closing price | 2.140000104904175 |
| 2026-10-26 | Closing price | 2.1500000953674316 |
| 2026-10-27 | Closing price | 2.140000104904175 |
| 2026-10-28 | Closing price | 2.1500000953674316 |
| 2026-10-29 | Closing price | 2.1600000858306885 |
| 2026-10-30 | Closing price | 2.1700000762939453 |
| 2026-11-02 | Closing price | 2.0199999809265137 |
| 2026-11-03 | Closing price | 2.0 |
| 2026-11-04 | Closing price | 1.9199999570846558 |
| 2026-11-05 | Closing price | 1.8799999952316284 |
| 2026-11-06 | Closing price | 1.909999966621399 |
| 2026-11-09 | Closing price | 1.9199999570846558 |
| 2026-11-10 | Closing price | 1.9600000381469727 |
| 2026-11-11 | Closing price | 1.8799999952316284 |
| 2026-11-12 | Closing price | 1.8700000047683716 |
| 2026-11-13 | Closing price | 1.8600000143051147 |
| 2026-11-16 | Closing price | 1.840000033378601 |
An 11.1% dividend yield against the rate the stock has to beat – the main argument for the share
The trailing twelve-month dividend yield is 11.1%. On a market capitalisation of 875.5 million that is roughly 97 million of annual payments, covered by quarterly free cash flow of 58.3 million.
Our estimate of the current-year dividend rests on cash flow, not net profit: with quarterly cash flow of 72.7 million and capex of 14.4 million, an 11.1% payout looks sustainable if prices stay near 92 dollars a barrel. The risk is that net profit of 1.3 million provides no buffer, and a fall in prices could force a cut.
The 11.1% yield is the main argument for the share, but it is also the main risk: the market demands such a premium when it doubts the sustainability of the payout.
Net profit by quarter
| Period | Measure | bn USD |
|---|---|---|
| Q2 2025 | Net profit | 0.0031 |
| Q3 2025 | Net profit | 0.0052 |
| Q4 2025 | Net profit | −0.09079999999999999 |
| Q1 2026 | Net profit | −0.0422 |
| Q2 2026 | Net profit | 0.0318 |
| Q3 2026 | Net profit | 0.0013 |
EV/EBITDA of 3.0 against the spot model's 416.6 million – the valuation is below what history implies, but the profit gap weighs
The last-twelve-month EV/EBITDA is 3.0. The portal spot model puts EBITDA at current prices at 416.6 million, implying EV/EBITDA of 2.5 and leverage of 0.37. These are low multiples for a producer with 9.7 years of reserve life.
We cannot compare with the company's own three-year history – the facts give no three-year average. Even without it, the market values the company below what current oil prices allow, and the reason is the gap between price and the report, not debt.
If the gap closes and EBITDA reaches 416.6 million, a multiple of 2.5 leaves room. If not, the 11.1% yield is the only support.
Valuation on the latest reported figures
| Metric | Value |
|---|---|
| Market cap | 0.88 bn USD |
| EV/EBITDA (LTM) | 3.0 |
| P/B | 1.14 |
| Net debt / EBITDA (LTM) | 0.46 |
| Operating cash flow (LTM) | 0.19 bn |
| ROE | 0.7% |
| Dividend yield (12m) | 11.1% |
Bottom line
Little was strong in the report: operating cash flow of 72.7 million, capex of 14.4 million and low leverage of 0.46 LTM EBITDA. The rest was weak: revenue fell 11.2% while Brent rose 34.2%, EBITDA fell 23.6% and net profit fell 75.0% to 1.3 million. The 98.3 million gap between implied and actual EBITDA is not price but volumes and unit costs, and it determines whether the valuation closes. The 11.1% dividend yield and the 2.5 multiple on the spot model leave room, but only if the gap closes. Our conclusion: rather attractive – EV/EBITDA of 3.0 against the spot model's 416.6 million, but the gap between price and the report has to close. Our view: the share is rather attractive at the current price.