PrimeEnergy Resources: WTI up 31.7%, yet revenue still below a year ago
Contents
On 17 November PrimeEnergy Resources reported third-quarter 2026 results. Average WTI was 85.4 dollars against 64.9 a year earlier (+31.7%), while Henry Hub fell 6.2% to 2.893 dollars. At those prices and on last year's volumes and costs, revenue should have been 55.3 million dollars and EBITDA 35.7 million; the company actually booked 45.286 million of revenue and 29.672 million of EBITDA, 18.1% and 16.9% below the price-implied level. Our conclusion: rather unattractive – on the portal's model the share trades 15% above its modelled fair value. Our view: the share is rather unattractive at the current price; upside on the portal model -15%.
Our view: is there upside
Our view in numbers
| Metric | Our read |
|---|---|
| Verdict | Rather unattractive |
| Upside on the portal model | -15% |
| How the model works | spot model: EBITDA re-priced to current commodity prices at the target EV/EBITDA, against market cap |
| Net debt / EBITDA | -0.37 – net cash |
| Strongest case for | Net cash of 40.386 million dollars and operating cash flow of 30.402 million, which covered capital expenditure of 15.771 million almost twice over, provide a cushion at EV/EBITDA of 2.69. |
| Strongest case against | Reserves cover only 1.2 years of current production, and on the portal's model the share trades 15% above its modelled fair value. |
| What would change the view | The verdict would move one step up if production volumes recover and EBITDA closes the gap to the 35.7 million dollar price-implied level, and one step down if WTI falls below 83.9 dollars. |
Key takeaways
— WTI rose 31.7% year on year, but Henry Hub fell 6.2%, and that was enough to pull revenue down 1.5%
— At the year-ago volumes and costs our calculation puts EBITDA at 35.7 million dollars – the company came in 16.9% short
— EBITDA margin rose to 65.5% from 59.6%, while net profit fell 31.0% – the gap sits in lines below operating profit
— Net cash of 40.386 million dollars at EV/EBITDA of 2.69 – the market values the company below two and a half times annual EBITDA
— Operating cash flow of 30.402 million dollars covered capital expenditure of 15.771 million almost twice over
— Reserves cover 1.2 years of current production – the main constraint on the valuation
Key figures, USD bn
| Metric | Q3 2025 | Q3 2026 | Change |
|---|---|---|---|
| Revenue | 0.05 | 0.05 | -1.5% |
| EBITDA | 0.03 | 0.03 | +8.3% |
| Operating profit | 0.01 | 0.02 | +18.0% |
| Net profit | 0.01 | 0.01 | -31.0% |
| Operating cash flow | 0.05 | 0.03 | -44.4% |
| Capex | 0.04 | 0.02 | -59.9% |
| EBITDA margin | 59.6% | 65.5% | +5.9 pp |
| Net margin | 23.0% | 16.1% | -6.9 pp |
WTI rose 31.7% year on year, but Henry Hub fell 6.2%, and that was enough to pull revenue down 1.5%
In the third quarter of 2026 average WTI was 85.4 dollars against 64.9 a year earlier, up 31.7%. US gas, Henry Hub, went the other way: 2.893 dollars against 3.083, down 6.2%. In the portal model oil accounts for 70% of revenue and gas for 30%, so the oil gain outweighs the gas decline, but not fully.
Against the previous quarter oil fell 7.9% to 92.8 dollars and gas slipped 1.1%. As of 17 November WTI is 83.9 dollars, 1.7% below the reported-period average, while Henry Hub is 3.12 dollars, 7.8% above. The oil leg of revenue will therefore be slightly weaker in the fourth quarter and the gas leg slightly stronger.
Revenue for the quarter was 45.286 million dollars, 1.5% below a year earlier. That is a deceleration from the second quarter of 2026, when revenue grew 1.2%: growth turned into a small decline. With oil more expensive, that outcome means volumes or the realised price against the benchmark fell short of last year's level.
Commodity prices: period average and now
| Benchmark | Year ago | Q3 2026 | YoY | Spot 2026-11-17 |
|---|---|---|---|---|
| WTI, USD | 64,9 | 85,4 | +31,7% | 83,9 |
| Henry Hub, USD | 3,08 | 2,89 | -6,2% | 3,12 |
| US Diesel Index (EIA) (input cost), USD | 3,75 | 5,45 | +45,3% | 6,13 |
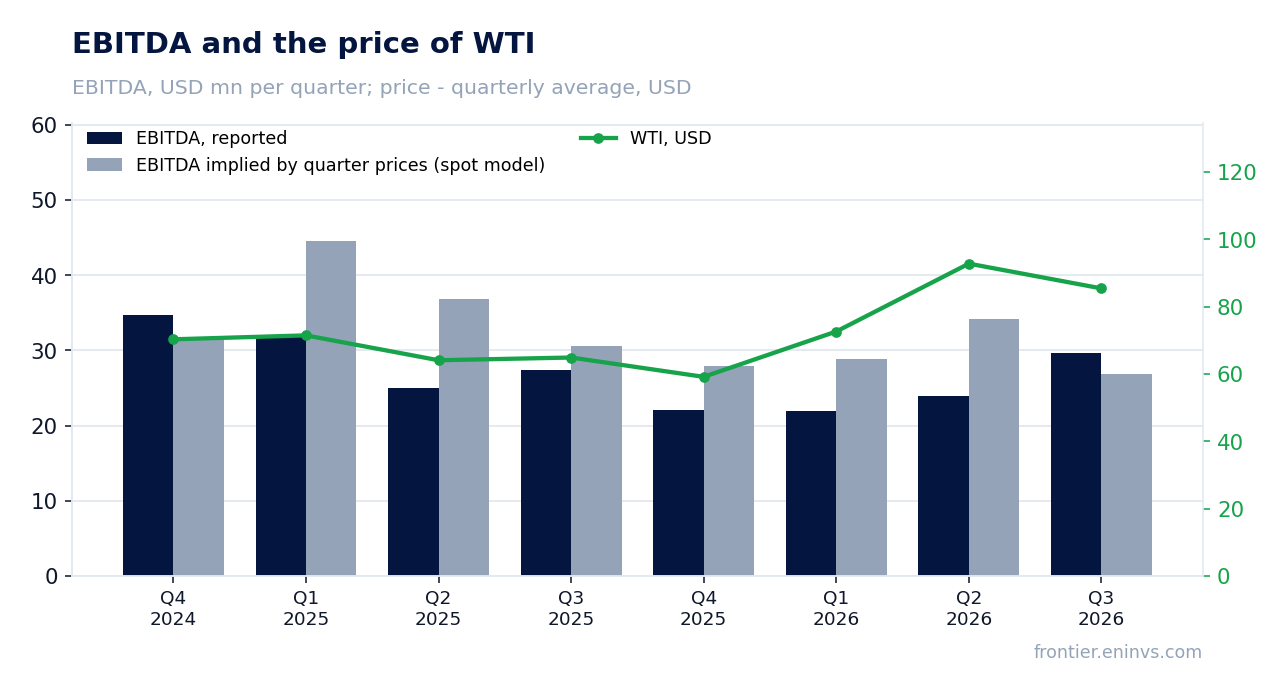
At the year-ago volumes and costs our calculation puts EBITDA at 35.7 million dollars – the company came in 16.9% short
Holding third-quarter 2025 volumes and non-commodity costs and moving only prices to the reported period, revenue would have been 55.3 million dollars and EBITDA 35.7 million. The price effect would have added 9.3 million to revenue, while more expensive diesel would have taken 1.0 million of costs. The company actually booked 45.286 million of revenue and 29.672 million of EBITDA – 10.0 million and 6.0 million below the calculation.
A gap of 18.1% in revenue and 16.9% in EBITDA against that price backdrop means the company sold less physical volume or realised a price below the benchmark. The disclosure offers no other explanation: no one-off items, hedges or non-producing revenue that would close the hole are named in the facts.
The portal's spot model, built from the average of the previous four quarters, expected EBITDA of 26.9 million and revenue of 48.6 million. Actual EBITDA beat the model by 10.2%, while revenue came in 6.8% below. That estimate disagrees in direction with the year-ago calculation, and for a company with a short production history the year-ago calculation is the reference point.
What the prices implied and what the company earned
| Base (Q3 2025) | Implied at period prices | Reported | Reported vs implied | |
|---|---|---|---|---|
| Revenue, USD mn | 46,0 | 55,3 | 45,3 | -18,1% |
| EBITDA, USD mn | 27,4 | 35,7 | 29,7 | -16,9% |
| EBITDA, portal spot model, USD mn | — | 26,9 | 29,7 | +10,2% |
Revenue and EBITDA by quarter
| Period | Measure | bn USD |
|---|---|---|
| Q4 2024 | Revenue | 0.060526 |
| Q1 2025 | Revenue | 0.050055999999999996 |
| Q2 2025 | Revenue | 0.041983 |
| Q3 2025 | Revenue | 0.04597 |
| Q4 2025 | Revenue | 0.051043 |
| Q1 2026 | Revenue | 0.039404 |
| Q2 2026 | Revenue | 0.042474 |
| Q3 2026 | Revenue | 0.045286 |
| Q4 2024 | EBITDA | 0.034741999999999995 |
| Q1 2025 | EBITDA | 0.031731 |
| Q2 2025 | EBITDA | 0.024963000000000003 |
| Q3 2025 | EBITDA | 0.027399999999999997 |
| Q4 2025 | EBITDA | 0.022121000000000002 |
| Q1 2026 | EBITDA | 0.021939999999999998 |
| Q2 2026 | EBITDA | 0.024001 |
| Q3 2026 | EBITDA | 0.029671999999999997 |
EBITDA margin
| Period | Measure | % |
|---|---|---|
| Q4 2024 | EBITDA margin | 57.4 |
| Q1 2025 | EBITDA margin | 63.4 |
| Q2 2025 | EBITDA margin | 59.5 |
| Q3 2025 | EBITDA margin | 59.6 |
| Q4 2025 | EBITDA margin | 43.3 |
| Q1 2026 | EBITDA margin | 55.7 |
| Q2 2026 | EBITDA margin | 56.5 |
| Q3 2026 | EBITDA margin | 65.5 |
EBITDA margin rose to 65.5% from 59.6%, while net profit fell 31.0% – the gap sits in lines below operating profit
EBITDA for the quarter was 29.672 million dollars, 8.3% above a year earlier on revenue 1.5% lower. The margin rose to 65.5% from 59.6%. Operating profit was 15.693 million and depreciation, depletion and amortisation 14 million, which together make up that EBITDA. A rising margin on falling revenue means unit costs fell faster than the realised price.
Net profit, by contrast, fell 31.0% to 7.29 million dollars and the net margin to 16.1% from 23.0%. The gap with EBITDA arises in lines below operating profit: interest, other income and expense, taxes. Those items are outside our EBITDA, so rising EBITDA and falling net profit are not in contradiction.
Diesel, which the company buys, rose 45.3% year on year to 5.454 dollars. In the portal model it accounts for 5% of revenue, and the price calculation already includes that increase as 1.0 million of extra costs. Part of the margin gain was therefore eaten by fuel, but not all of it.
Net cash of 40.386 million dollars at EV/EBITDA of 2.69 – the market values the company below two and a half times annual EBITDA
As of 30 September 2026 the company had net cash of 40.386 million dollars: more cash than debt. Net debt to EBITDA over the last twelve months was -0.37, a negative leverage. Market capitalisation is 302.57 million dollars, EV/EBITDA over the last twelve months 2.69 and P/E 14.04.
EBITDA over the last twelve months was 109.8 million dollars, revenue 178.2 million and net profit 21.5 million. Those figures were earned at past oil and gas prices. On the portal's spot model, today's prices would give annual EBITDA of 100.8 million, 3.1% below the last twelve months. EV/EBITDA at current prices is 2.6 and net cash to EBITDA -0.4.
A multiple of 2.69 looks low on its own, but the company has only 1.2 years of reserves at the current production rate. The market is paying for a cash flow that may end before the investment is recovered. That is the main reason for the valuation rather than undervaluation.
Operating cash flow of 30.402 million dollars covered capital expenditure of 15.771 million almost twice over
Operating cash flow in the third quarter was 30.402 million dollars and capital expenditure 15.771 million. Free cash flow after investment was about 14.6 million and positive. For a company that drills to hold production flat, that is a healthy ratio: investment is covered by cash flow rather than debt.
Capital expenditure rose against previous quarters: 0.7 million in the second quarter and 1.503 million in the first. The increase from a low base points to a resumed drilling programme. Over the last twelve months operating cash flow was 74.1 million dollars.
Net cash of 40.386 million against such flows gives the company a cushion. But spending it on production growth with 1.2 years of reserves is hard: new wells have to pay back before the existing reserves run out.
Reserves cover 1.2 years of current production – the main constraint on the valuation
Reserve life of 1.2 years at the current production rate is the key figure of the whole report. It explains why an EV/EBITDA of 2.69 should not be read as a discount: the market is valuing not an endless stream but one that has to be continually renewed by drilling. Capital expenditure of 15.771 million in the quarter is the price of holding production flat.
On the portal's model the share trades 15% above its modelled fair value. The model re-prices EBITDA at current commodity prices at the target EV/EBITDA and compares it with the market capitalisation. With EV/EBITDA at 2.69 and net cash of 40.386 million, even a modest fall in oil prices pushes the valuation lower.
What to watch in the next report: physical production and sales volumes, the realised price against WTI and Henry Hub, and cash cost per unit. If volumes recover while costs stay at the third-quarter level, EBITDA will close the gap to the price-implied level. If not, the 16.9% shortfall becomes permanent.
Valuation on the latest reported figures
| Metric | Value |
|---|---|
| Market cap | 0.30 bn USD |
| P/E (LTM) | 14.0 |
| EV/EBITDA (LTM) | 2.7 |
| P/B | 1.40 |
| Net debt / EBITDA (LTM) | -0.37 |
| Operating cash flow (LTM) | 0.07 bn |
| ROE | 13.2% |
Share price, three years
close, last point 2026-11-16
| Period | Measure | USD per share |
|---|---|---|
| 2025-11-17 | Closing price | 135.27000427246094 |
| 2025-11-18 | Closing price | 144.5 |
| 2025-11-19 | Closing price | 142.39999389648438 |
| 2025-11-20 | Closing price | 146.24000549316406 |
| 2025-11-21 | Closing price | 150.2100067138672 |
| 2025-11-24 | Closing price | 164.91000366210938 |
| 2025-11-25 | Closing price | 167.60000610351562 |
| 2025-11-26 | Closing price | 174.22000122070312 |
| 2025-11-28 | Closing price | 183.61000061035156 |
| 2025-12-01 | Closing price | 181.42999267578125 |
| 2025-12-02 | Closing price | 181.0500030517578 |
| 2025-12-03 | Closing price | 187.02000427246094 |
| 2025-12-04 | Closing price | 192.80999755859375 |
| 2025-12-05 | Closing price | 190.0 |
| 2025-12-08 | Closing price | 185.0 |
| 2025-12-09 | Closing price | 192.16000366210938 |
| 2025-12-10 | Closing price | 190.3800048828125 |
| 2025-12-11 | Closing price | 184.50999450683594 |
| 2025-12-12 | Closing price | 173.33999633789062 |
| 2025-12-15 | Closing price | 167.0800018310547 |
| 2025-12-16 | Closing price | 166.2100067138672 |
| 2025-12-17 | Closing price | 169.14999389648438 |
| 2025-12-18 | Closing price | 167.16000366210938 |
| 2025-12-19 | Closing price | 168.4499969482422 |
| 2025-12-22 | Closing price | 177.6999969482422 |
| 2025-12-23 | Closing price | 177.1199951171875 |
| 2025-12-24 | Closing price | 180.91000366210938 |
| 2025-12-26 | Closing price | 175.63999938964844 |
| 2025-12-29 | Closing price | 177.92999267578125 |
| 2025-12-30 | Closing price | 176.38999938964844 |
| 2025-12-31 | Closing price | 171.0 |
| 2026-01-02 | Closing price | 179.0500030517578 |
| 2026-01-05 | Closing price | 172.6999969482422 |
| 2026-01-06 | Closing price | 165.6199951171875 |
| 2026-01-07 | Closing price | 165.27000427246094 |
| 2026-01-08 | Closing price | 166.0 |
| 2026-01-09 | Closing price | 175.72999572753906 |
| 2026-01-12 | Closing price | 182.1999969482422 |
| 2026-01-13 | Closing price | 179.35000610351562 |
| 2026-01-14 | Closing price | 178.1199951171875 |
| 2026-01-15 | Closing price | 171.3000030517578 |
| 2026-01-16 | Closing price | 169.3000030517578 |
| 2026-01-20 | Closing price | 171.7899932861328 |
| 2026-01-21 | Closing price | 177.16000366210938 |
| 2026-01-22 | Closing price | 168.5399932861328 |
| 2026-01-23 | Closing price | 171.9499969482422 |
| 2026-01-26 | Closing price | 172.00999450683594 |
| 2026-01-27 | Closing price | 175.97999572753906 |
| 2026-01-28 | Closing price | 182.1699981689453 |
| 2026-01-29 | Closing price | 182.97999572753906 |
| 2026-01-30 | Closing price | 183.08999633789062 |
| 2026-02-02 | Closing price | 175.1999969482422 |
| 2026-02-03 | Closing price | 181.3000030517578 |
| 2026-02-04 | Closing price | 191.0 |
| 2026-02-05 | Closing price | 190.0 |
| 2026-02-06 | Closing price | 193.02999877929688 |
| 2026-02-09 | Closing price | 192.97000122070312 |
| 2026-02-10 | Closing price | 189.60000610351562 |
| 2026-02-11 | Closing price | 197.1999969482422 |
| 2026-02-12 | Closing price | 175.3000030517578 |
| 2026-02-13 | Closing price | 171.91000366210938 |
| 2026-02-17 | Closing price | 167.5 |
| 2026-02-18 | Closing price | 173.69000244140625 |
| 2026-02-19 | Closing price | 182.52999877929688 |
| 2026-02-20 | Closing price | 188.0399932861328 |
| 2026-02-23 | Closing price | 183.97999572753906 |
| 2026-02-24 | Closing price | 183.72000122070312 |
| 2026-02-25 | Closing price | 183.89999389648438 |
| 2026-02-26 | Closing price | 183.3000030517578 |
| 2026-02-27 | Closing price | 198.89999389648438 |
| 2026-03-02 | Closing price | 205.67999267578125 |
| 2026-03-03 | Closing price | 201.4499969482422 |
| 2026-03-04 | Closing price | 203.8699951171875 |
| 2026-03-05 | Closing price | 210.27999877929688 |
| 2026-03-06 | Closing price | 208.08999633789062 |
| 2026-03-09 | Closing price | 201.69000244140625 |
| 2026-03-10 | Closing price | 202.39999389648438 |
| 2026-03-11 | Closing price | 210.4199981689453 |
| 2026-03-12 | Closing price | 211.99000549316406 |
| 2026-03-13 | Closing price | 205.66000366210938 |
| 2026-03-16 | Closing price | 207.24000549316406 |
| 2026-03-17 | Closing price | 212.75 |
| 2026-03-18 | Closing price | 218.07000732421875 |
| 2026-03-19 | Closing price | 218.4199981689453 |
| 2026-03-20 | Closing price | 215.8000030517578 |
| 2026-03-23 | Closing price | 219.32000732421875 |
| 2026-03-24 | Closing price | 224.63999938964844 |
| 2026-03-25 | Closing price | 223.47999572753906 |
| 2026-03-26 | Closing price | 227.00999450683594 |
| 2026-03-27 | Closing price | 240.4199981689453 |
| 2026-03-30 | Closing price | 235.02999877929688 |
| 2026-03-31 | Closing price | 232.85000610351562 |
| 2026-04-01 | Closing price | 229.64999389648438 |
| 2026-04-02 | Closing price | 234.16000366210938 |
| 2026-04-06 | Closing price | 238.60000610351562 |
| 2026-04-07 | Closing price | 244.10000610351562 |
| 2026-04-08 | Closing price | 230.14999389648438 |
| 2026-04-09 | Closing price | 223.49000549316406 |
| 2026-04-10 | Closing price | 220.42999267578125 |
| 2026-04-13 | Closing price | 217.08999633789062 |
| 2026-04-14 | Closing price | 198.10000610351562 |
| 2026-04-15 | Closing price | 192.07000732421875 |
| 2026-04-16 | Closing price | 206.14999389648438 |
| 2026-04-17 | Closing price | 200.3000030517578 |
| 2026-04-20 | Closing price | 199.72000122070312 |
| 2026-04-21 | Closing price | 214.8000030517578 |
| 2026-04-22 | Closing price | 222.8699951171875 |
| 2026-04-23 | Closing price | 234.1699981689453 |
| 2026-04-24 | Closing price | 230.0 |
| 2026-04-27 | Closing price | 219.2100067138672 |
| 2026-04-28 | Closing price | 211.5399932861328 |
| 2026-04-29 | Closing price | 214.0399932861328 |
| 2026-04-30 | Closing price | 221.58999633789062 |
| 2026-05-01 | Closing price | 216.42999267578125 |
| 2026-05-04 | Closing price | 228.63999938964844 |
| 2026-05-05 | Closing price | 233.77000427246094 |
| 2026-05-06 | Closing price | 230.8000030517578 |
| 2026-05-07 | Closing price | 228.0 |
| 2026-05-08 | Closing price | 239.0500030517578 |
| 2026-05-11 | Closing price | 240.19000244140625 |
| 2026-05-12 | Closing price | 250.64999389648438 |
| 2026-05-13 | Closing price | 251.5 |
| 2026-05-14 | Closing price | 253.36000061035156 |
| 2026-05-15 | Closing price | 268.1600036621094 |
| 2026-05-18 | Closing price | 272.5899963378906 |
| 2026-05-19 | Closing price | 264.8999938964844 |
| 2026-05-20 | Closing price | 245.97999572753906 |
| 2026-05-21 | Closing price | 247.97000122070312 |
| 2026-05-22 | Closing price | 259.239990234375 |
| 2026-05-26 | Closing price | 249.49000549316406 |
| 2026-05-27 | Closing price | 232.55999755859375 |
| 2026-05-28 | Closing price | 176.99000549316406 |
| 2026-05-29 | Closing price | 164.6199951171875 |
| 2026-06-01 | Closing price | 182.3000030517578 |
| 2026-06-02 | Closing price | 182.55999755859375 |
| 2026-06-03 | Closing price | 184.13999938964844 |
| 2026-06-04 | Closing price | 184.5500030517578 |
| 2026-06-05 | Closing price | 183.60000610351562 |
| 2026-06-08 | Closing price | 189.89999389648438 |
| 2026-06-09 | Closing price | 184.0399932861328 |
| 2026-06-10 | Closing price | 191.47000122070312 |
| 2026-06-11 | Closing price | 187.1199951171875 |
| 2026-06-12 | Closing price | 190.66000366210938 |
| 2026-06-15 | Closing price | 178.10000610351562 |
| 2026-06-16 | Closing price | 176.5 |
| 2026-06-17 | Closing price | 177.25 |
| 2026-06-18 | Closing price | 175.2899932861328 |
| 2026-06-22 | Closing price | 177.52000427246094 |
| 2026-06-23 | Closing price | 172.66000366210938 |
| 2026-06-24 | Closing price | 171.8699951171875 |
| 2026-06-25 | Closing price | 170.8000030517578 |
| 2026-06-26 | Closing price | 174.61000061035156 |
| 2026-06-29 | Closing price | 170.5399932861328 |
| 2026-06-30 | Closing price | 166.88999938964844 |
| 2026-07-01 | Closing price | 170.0500030517578 |
| 2026-07-02 | Closing price | 173.3000030517578 |
| 2026-07-06 | Closing price | 174.92999267578125 |
| 2026-07-07 | Closing price | 180.30999755859375 |
| 2026-07-08 | Closing price | 184.9199981689453 |
| 2026-07-09 | Closing price | 179.4199981689453 |
| 2026-07-10 | Closing price | 177.19000244140625 |
| 2026-07-13 | Closing price | 182.44000244140625 |
| 2026-07-14 | Closing price | 188.25 |
| 2026-07-15 | Closing price | 188.39999389648438 |
| 2026-07-16 | Closing price | 186.32000732421875 |
| 2026-07-17 | Closing price | 186.50999450683594 |
| 2026-07-20 | Closing price | 187.24000549316406 |
| 2026-07-21 | Closing price | 189.86000061035156 |
| 2026-07-22 | Closing price | 193.39999389648438 |
| 2026-07-23 | Closing price | 190.24000549316406 |
| 2026-07-24 | Closing price | 187.1999969482422 |
| 2026-07-27 | Closing price | 181.97000122070312 |
| 2026-07-28 | Closing price | 180.64999389648438 |
| 2026-07-29 | Closing price | 184.36000061035156 |
| 2026-07-30 | Closing price | 180.66000366210938 |
| 2026-07-31 | Closing price | 184.10000610351562 |
| 2026-08-03 | Closing price | 185.63999938964844 |
| 2026-08-04 | Closing price | 186.47999572753906 |
| 2026-08-05 | Closing price | 186.69000244140625 |
| 2026-08-06 | Closing price | 182.74000549316406 |
| 2026-08-07 | Closing price | 184.3000030517578 |
| 2026-08-10 | Closing price | 197.6699981689453 |
| 2026-08-11 | Closing price | 194.86000061035156 |
| 2026-08-12 | Closing price | 199.89999389648438 |
| 2026-08-13 | Closing price | 195.58999633789062 |
| 2026-08-14 | Closing price | 200.97999572753906 |
| 2026-08-17 | Closing price | 210.60000610351562 |
| 2026-08-18 | Closing price | 212.7100067138672 |
| 2026-08-19 | Closing price | 213.35000610351562 |
| 2026-08-20 | Closing price | 213.97000122070312 |
| 2026-08-21 | Closing price | 212.64999389648438 |
| 2026-08-24 | Closing price | 206.97000122070312 |
| 2026-08-25 | Closing price | 207.11000061035156 |
| 2026-08-26 | Closing price | 208.7899932861328 |
| 2026-08-27 | Closing price | 210.49000549316406 |
| 2026-08-28 | Closing price | 209.6999969482422 |
| 2026-08-31 | Closing price | 211.0800018310547 |
| 2026-09-01 | Closing price | 217.83999633789062 |
| 2026-09-02 | Closing price | 216.0399932861328 |
| 2026-09-03 | Closing price | 215.35000610351562 |
| 2026-09-04 | Closing price | 217.35000610351562 |
| 2026-09-08 | Closing price | 215.52000427246094 |
| 2026-09-09 | Closing price | 214.88999938964844 |
| 2026-09-10 | Closing price | 214.50999450683594 |
| 2026-09-11 | Closing price | 211.11000061035156 |
| 2026-09-14 | Closing price | 210.88999938964844 |
| 2026-09-15 | Closing price | 213.39999389648438 |
| 2026-09-16 | Closing price | 207.9199981689453 |
| 2026-09-17 | Closing price | 212.22999572753906 |
| 2026-09-18 | Closing price | 211.2100067138672 |
| 2026-09-21 | Closing price | 208.49000549316406 |
| 2026-09-22 | Closing price | 199.35000610351562 |
| 2026-09-23 | Closing price | 196.6699981689453 |
| 2026-09-24 | Closing price | 210.85000610351562 |
| 2026-09-25 | Closing price | 208.6699981689453 |
| 2026-09-28 | Closing price | 206.77999877929688 |
| 2026-09-29 | Closing price | 199.5399932861328 |
| 2026-09-30 | Closing price | 197.5 |
| 2026-10-01 | Closing price | 201.4199981689453 |
| 2026-10-02 | Closing price | 204.66000366210938 |
| 2026-10-05 | Closing price | 209.6699981689453 |
| 2026-10-06 | Closing price | 210.25 |
| 2026-10-07 | Closing price | 209.57000732421875 |
| 2026-10-08 | Closing price | 211.5 |
| 2026-10-09 | Closing price | 214.8699951171875 |
| 2026-10-12 | Closing price | 217.25 |
| 2026-10-13 | Closing price | 219.14999389648438 |
| 2026-10-14 | Closing price | 212.5500030517578 |
| 2026-10-15 | Closing price | 203.91000366210938 |
| 2026-10-16 | Closing price | 206.92999267578125 |
| 2026-10-19 | Closing price | 208.8800048828125 |
| 2026-10-20 | Closing price | 208.86000061035156 |
| 2026-10-21 | Closing price | 205.85000610351562 |
| 2026-10-22 | Closing price | 202.1199951171875 |
| 2026-10-23 | Closing price | 215.75 |
| 2026-10-26 | Closing price | 218.1699981689453 |
| 2026-10-27 | Closing price | 220.42999267578125 |
| 2026-10-28 | Closing price | 227.27000427246094 |
| 2026-10-29 | Closing price | 227.3699951171875 |
| 2026-10-30 | Closing price | 228.3300018310547 |
| 2026-11-02 | Closing price | 202.22999572753906 |
| 2026-11-03 | Closing price | 199.9199981689453 |
| 2026-11-04 | Closing price | 190.08999633789062 |
| 2026-11-05 | Closing price | 180.83999633789062 |
| 2026-11-06 | Closing price | 185.63999938964844 |
| 2026-11-09 | Closing price | 186.6999969482422 |
| 2026-11-10 | Closing price | 188.13999938964844 |
| 2026-11-11 | Closing price | 192.52000427246094 |
| 2026-11-12 | Closing price | 191.82000732421875 |
| 2026-11-13 | Closing price | 195.07000732421875 |
| 2026-11-16 | Closing price | 192.1699981689453 |
Net profit by quarter
| Period | Measure | bn USD |
|---|---|---|
| Q4 2024 | Net profit | 0.002277 |
| Q1 2025 | Net profit | 0.009134 |
| Q2 2025 | Net profit | 0.0032280000000000004 |
| Q3 2025 | Net profit | 0.010563000000000001 |
| Q4 2025 | Net profit | 0.003387 |
| Q1 2026 | Net profit | 0.004339000000000001 |
| Q2 2026 | Net profit | 0.006529 |
| Q3 2026 | Net profit | 0.00729 |
Bottom line
The strong part of the report was the EBITDA margin of 65.5% against 59.6% a year earlier and operating cash flow of 30.402 million, which covered capital expenditure of 15.771 million almost twice over. The weak part was revenue: with WTI 31.7% more expensive the company sold 1.5% less than a year earlier and came in 16.9% short of the price-implied EBITDA. Net profit fell 31.0% because of lines below operating profit, not because of operations. The real question for a holder is the 1.2 years of reserves: they explain why an EV/EBITDA of 2.69 is not a discount. Our conclusion: rather unattractive – on the portal's model the share trades 15% above its modelled fair value. Our view: the share is rather unattractive at the current price; upside on the portal model -15%.