Strathcona Resources: revenue up 57.6%, but EBITDA margin compressed to 37.9%

On 25 August, Strathcona Resources released its second-quarter 2026 results. Revenue rose 57.6% year on year to USD 1,134.2 million, EBITDA added 41.4% to USD 398.5 million, and net profit increased 43.4% to USD 239.5 million. Revenue growth accelerated from just 0.3% in the first quarter, but the EBITDA margin narrowed to 37.9% from 42.2% a year earlier. At the current price the share looks attractive: EV/EBITDA LTM of 5.57 versus the three-year average of 4.57, a dividend yield of 28.9%, and a 21% upside to fair value on the portal's model.
Key takeaways
— Revenue rose 57.6% year on year to USD 1,134.2 million, an acceleration from just 0.3% in the first quarter
— EBITDA added 41.4% to USD 398.5 million, but its margin narrowed to 37.9% from 42.2% a year earlier
— Net profit increased 43.4% to USD 239.5 million, while the net margin slipped to 21.1% from 23.2%
— Operating cash flow for the quarter was USD 361.8 million, covering interest and dividends
— Net debt fell to USD 1.4 billion on 30 June 2026 from USD 1.5 billion on 31 March and USD 1.7 billion a year earlier
— The trailing twelve-month dividend yield is 28.9%, well above the key rate
— EV/EBITDA LTM of 5.57 versus the three-year average of 4.57, with the portal's model pointing to 21% upside
Attractiveness
Key figures, USD bn
| Metric | Q2 2025 | Q2 2026 | Change |
|---|---|---|---|
| Revenue | 0.72 | 1.13 | +57.6% |
| EBITDA | 0.30 | 0.43 | +41.4% |
| Operating profit | 0.13 | 0.30 | +125.0% |
| Net profit | 0.17 | 0.24 | +43.4% |
| Operating cash flow | 0.27 | 0.36 | +34.5% |
| EBITDA margin | 42.2% | 37.9% | -4.3 pp |
| Net margin | 23.2% | 21.1% | -2.1 pp |
Revenue rose 57.6% year on year to USD 1,134.2 million, an acceleration from just 0.3% in the first quarter
In the second quarter of 2026, Strathcona Resources' revenue reached USD 1,134.2 million, up 57.6% year on year. This marks a sharp acceleration from the first quarter, when growth was just 0.3%. Such a jump points to a significant improvement in market conditions or higher sales volumes, though the facts provided do not detail the operational drivers.
The acceleration in revenue contrasts with profit dynamics: EBITDA rose 41.4% and net profit 43.4%, both slower than revenue. This means costs grew faster, compressing margins. The reason for this divergence remains unclear, but the revenue acceleration itself is a positive signal for future periods.
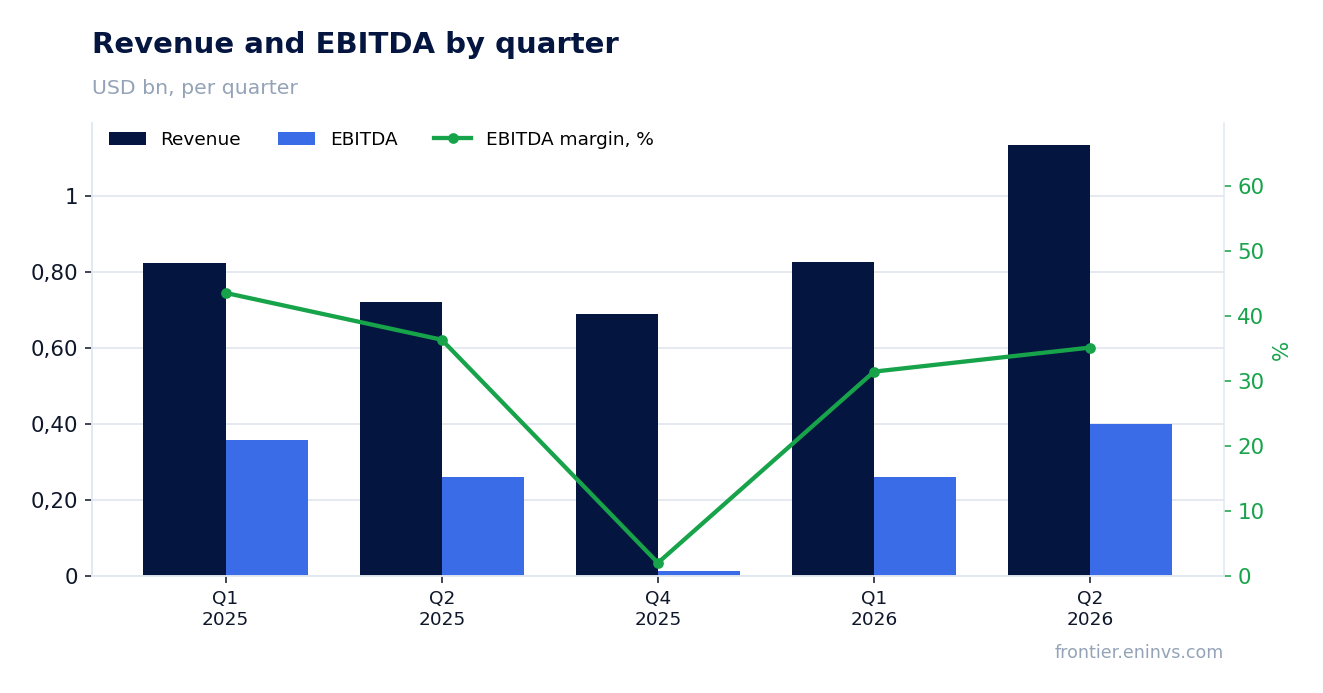
EBITDA added 41.4% to USD 398.5 million, but its margin narrowed to 37.9% from 42.2% a year earlier
EBITDA in the second quarter of 2026 was USD 398.5 million, up 41.4% year on year. However, the EBITDA margin fell to 37.9% from 42.2% in the same period last year. This 4.3 percentage point decline indicates that revenue growth was accompanied by even faster growth in operating costs.
The margin compression could stem from changes in sales mix, higher resource prices, or one-off factors, but the provided data does not specify the causes. Importantly, the absolute EBITDA level remains high, and the company continues to generate substantial operating cash flow.
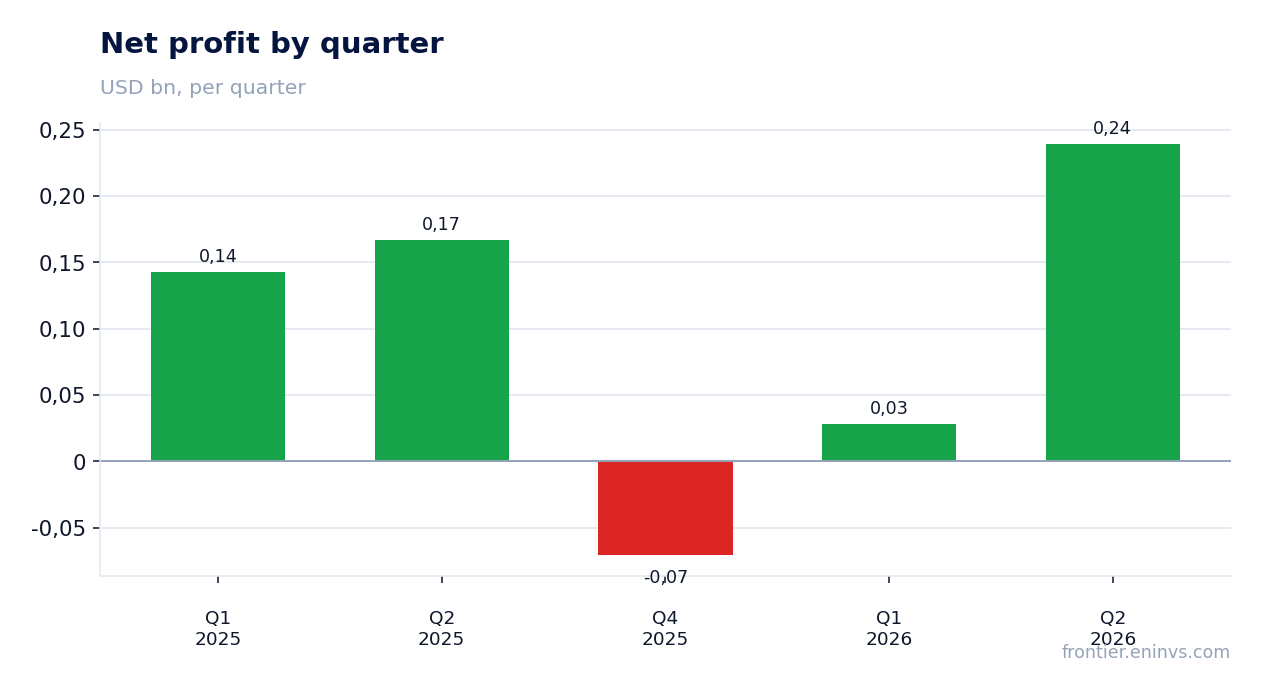
Net profit increased 43.4% to USD 239.5 million, while the net margin slipped to 21.1% from 23.2%
Net profit for the second quarter of 2026 was USD 239.5 million, up 43.4% year on year. The net margin declined to 21.1% from 23.2%. As with EBITDA, profit growth lags revenue growth, confirming cost pressure.
Nevertheless, the absolute profit level remains high, and the company continues to generate substantial operating cash flow. Whether one-off items are present remains unclear, but even without them the result looks strong.
Operating cash flow for the quarter was USD 361.8 million, covering interest and dividends
Operating cash flow in the second quarter of 2026 was USD 361.8 million. This is lower than EBITDA, typical due to interest and tax payments, but still substantial. Such a flow comfortably covers interest expenses and dividend payments, confirming the company's financial stability.
Capital expenditure data is not available, so it is impossible to assess how much remains after investments. However, even without this information, positive operating cash flow is a key factor for sustaining dividends and reducing debt.
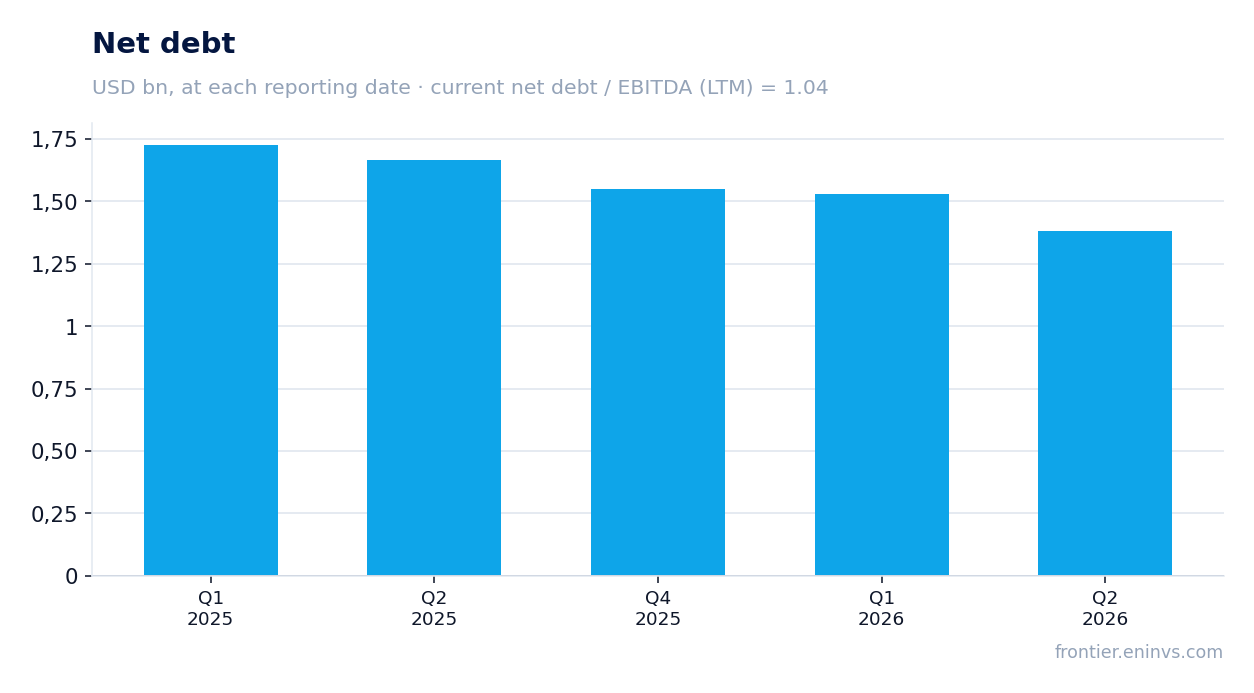
Net debt fell to USD 1.4 billion on 30 June 2026 from USD 1.5 billion on 31 March and USD 1.7 billion a year earlier
Net debt as of 30 June 2026 was USD 1.4 billion, down from USD 1.5 billion on 31 March 2026 and from USD 1.7 billion on 30 June 2025. The quarterly reduction was USD 0.1 billion, and the annual reduction was USD 0.3 billion. This positive trend reflects the company's ability to generate cash flow sufficient to service and repay debt.
The net debt to EBITDA LTM ratio is 1.04, a comfortable level. However, comparison with previous values of this ratio is impossible due to lack of data, so it cannot be claimed that leverage decreased – only the current level can be stated.
The trailing twelve-month dividend yield is 28.9%, well above the key rate
The trailing twelve-month dividend yield is 28.9%. This is a very high level, significantly exceeding the key rate. The company appears to pay out a substantial portion of its profit as dividends, as confirmed by the high dividend-to-net-profit ratio.
However, the sustainability of such payments depends on the ability to generate profit and cash flow. If current product prices and sales volumes persist, dividends may remain high, but a decline in prices or rising costs could lead to cuts. The dividend for the current year remains uncertain, but the current yield makes the stock attractive for income-oriented investors.
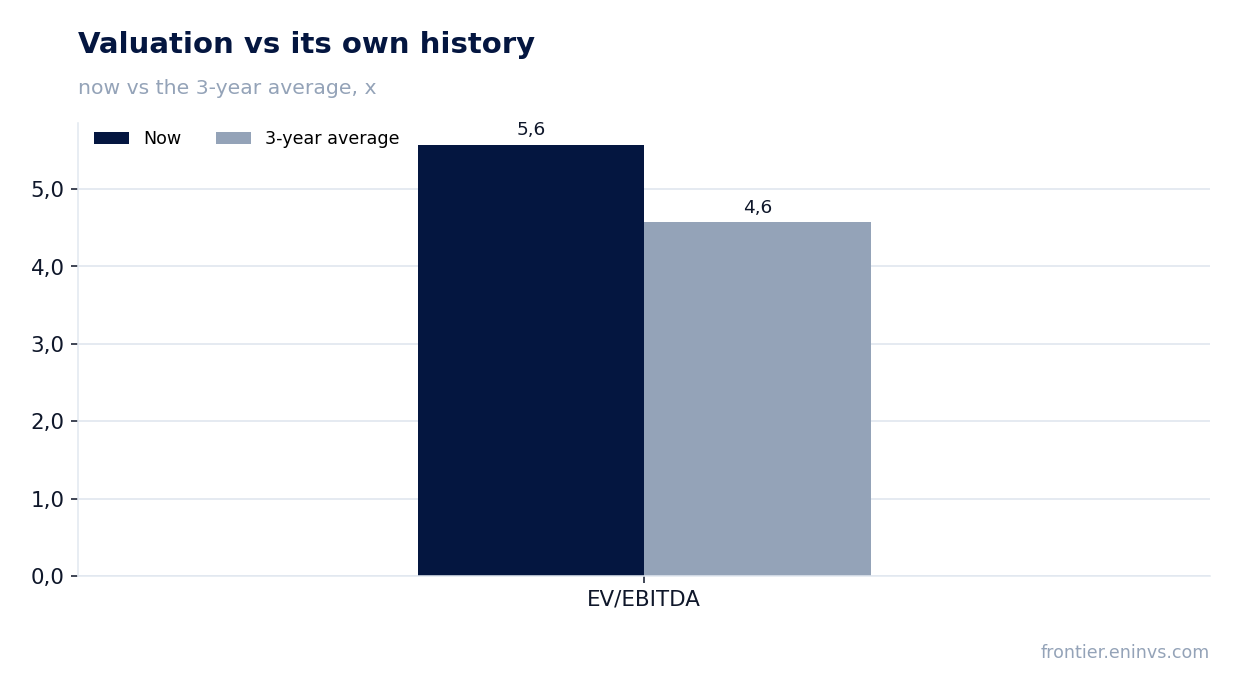
EV/EBITDA LTM of 5.57 versus the three-year average of 4.57, with the portal's model pointing to 21% upside
EV/EBITDA LTM is 5.57, above the three-year average of 4.57. This means the stock is valued more expensively than historically on this multiple. However, the P/E LTM is 8.09, which may also indicate undervaluation relative to the broader market, though we lack historical P/E data.
According to the portal's model, which reprices EBITDA at current commodity prices at the target EV/EBITDA, the upside to fair value is 21%. This is our own estimate, not a market consensus. Given the high dividend yield and debt reduction, the stock looks attractive despite the current multiple being above its historical average.
Valuation on the latest reported figures
| Metric | Value |
|---|---|
| Market cap | 5.86 bn USD |
| P/E (LTM) | 8.1 |
| EV/EBITDA (LTM) | 5.6 |
| P/B | 1.85 |
| Net debt / EBITDA (LTM) | 1.04 |
| Operating cash flow (LTM) | 1.12 bn |
| ROE | 30.3% |
| Dividend yield (12m) | 28.9% |
| EV/EBITDA, 3-year average | 4.6 |
Bottom line
Strathcona Resources delivered a strong second quarter of 2026: revenue rose 57.6%, EBITDA 41.4%, and net profit 43.4%. However, margins declined, indicating cost growth. The company is reducing net debt, which stood at USD 1.4 billion on 30 June 2026, and generates sufficient operating cash flow to cover dividends. The 28.9% dividend yield and 21% upside on the portal's model make the stock attractive, even though EV/EBITDA LTM of 5.57 is above the three-year average of 4.57. The key question for a holder is the sustainability of margins and dividends amid potential commodity price declines.
Open the company's financial profile SCR →
See also: market overview · valuation map · stock screeners