CSN: steel and iron ore fell while coking coal rose – EBITDA collapsed 81.9%, and the share price does not reflect it yet
Contents

On 16 November CSN released its third-quarter 2026 results. The average hot-rolled coil price in China was 3313 yuan per tonne for the quarter, 3.0% below a year earlier; iron ore fell 5.2% to 97.3 dollars, while coking coal, which the company buys, rose 27.7% to 242.8 dollars. Revenue fell 12.0% to 1928.5 million dollars, EBITDA 81.9% to 93.1 million, and net profit was a loss of 229.4 million. At the year-ago prices, volumes and costs, our calculation puts EBITDA at 347.4 million dollars – the company earned 254.2 million less. Our conclusion: the share is rather unattractive – at today's prices the portal spot model puts annual EBITDA at 116.8 million dollars and EV/EBITDA on that base at 72.8. Our view: the share is rather unattractive at the current price.
Our view: is there upside
Our view in numbers
| Metric | Our read |
|---|---|
| Verdict | Rather unattractive |
| Upside on the portal model | no portal model for this share |
| Net debt / EBITDA | 8.01 – high leverage |
| Strongest case for | Iron ore reserves last 40.4 years, and if ore returns to 97.3 dollars per tonne and coal to 242.8 dollars, EBITDA would return to levels at which the 7668.0 million dollars of net debt is serviceable. |
| Strongest case against | At today's prices EV/EBITDA on the portal spot model is 72.8 and net debt is 65.7 times EBITDA, with negative quarterly operating cash flow of 138.4 million dollars. |
| What would change the view | The verdict would move a step up if iron ore held above 97.3 dollars per tonne and coking coal below 242.8 dollars: that would return EBITDA to levels at which EV/EBITDA falls below 20. |
Key takeaways
— Steel and iron ore prices fell while coking coal rose – the price backdrop alone cost 75.4 million dollars of revenue and added 91.1 million of costs
— At the year-ago prices, our calculation puts EBITDA at 347.4 million dollars against 93.1 million reported – the 254.2 million gap is not only price
— Revenue fell 12.0% year on year after 16.1% growth a quarter earlier – a sharp deceleration, and the portal spot model expected 2090.3 million dollars against 1928.5 million actual
— The EBITDA margin compressed from 23.5% to 4.8%, and with coking coal at 242.8 dollars costs bite harder than revenue shows
— Leverage is 8.01 times trailing-twelve-month EBITDA – a level that becomes 65.7 times EBITDA at today's prices
— At today's prices the portal spot model puts annual EBITDA at 116.8 million dollars against 1050.3 million over the last twelve months, and valuation should start from the former
— Reserves last 40.4 years at the current production rate – the one thing that does not depend on price
Key figures, USD bn
| Metric | Q3 2025 | Q3 2026 | Change |
|---|---|---|---|
| Revenue | 2.19 | 1.93 | -12.0% |
| EBITDA | 0.51 | 0.09 | -81.9% |
| Operating profit | 0.32 | -0.11 | -132.8% |
| Net profit | 0.01 | -0.23 | -1715.1% |
| Operating cash flow | 0.07 | -0.14 | -289.8% |
| Capex | 0.27 | 0.25 | -4.6% |
| EBITDA margin | 23.5% | 4.8% | -18.7 pp |
| Net margin | 0.6% | -11.9% | -12.5 pp |
Steel and iron ore prices fell while coking coal rose – the price backdrop alone cost 75.4 million dollars of revenue and added 91.1 million of costs
The average hot-rolled coil price in China was 3313 yuan per tonne in the third quarter of 2026, 3.0% below a year earlier and 2.2% below the previous quarter. Iron ore averaged 97.3 dollars per tonne against 102.6 dollars a year earlier, down 5.2%. Spot on 16 November puts coil at 3180 yuan, another 4.0% below the quarterly average, and ore at 89.9 dollars, 7.6% lower.
Coking coal, which the company buys, moved the other way: 242.8 dollars per tonne against 190.1 dollars a year earlier, up 27.7%. Against the previous quarter the rise is smaller at 2.0%. Spot coal is 252 dollars, another 3.8% above the quarterly average.
At the year-ago volumes and non-commodity costs, with only these prices moving, our calculation puts revenue at 2115.9 million dollars – a price effect of minus 75.4 million, or minus 3.4% – while dearer coal would have added 91.1 million to costs. The price backdrop explains only part of the collapse, but it sets the direction.
Commodity prices: period average and now
| Benchmark | Year ago | Q3 2026 | YoY | Spot 2026-11-16 |
|---|---|---|---|---|
| Hot rolled coil, USDCNY | 3 415 | 3 313 | -3,0% | 3 180 |
| Iron Ore, USD | 102,6 | 97,3 | -5,2% | 89,9 |
| Coking coal (input cost), USD | 190,1 | 242,8 | +27,7% | 252,0 |
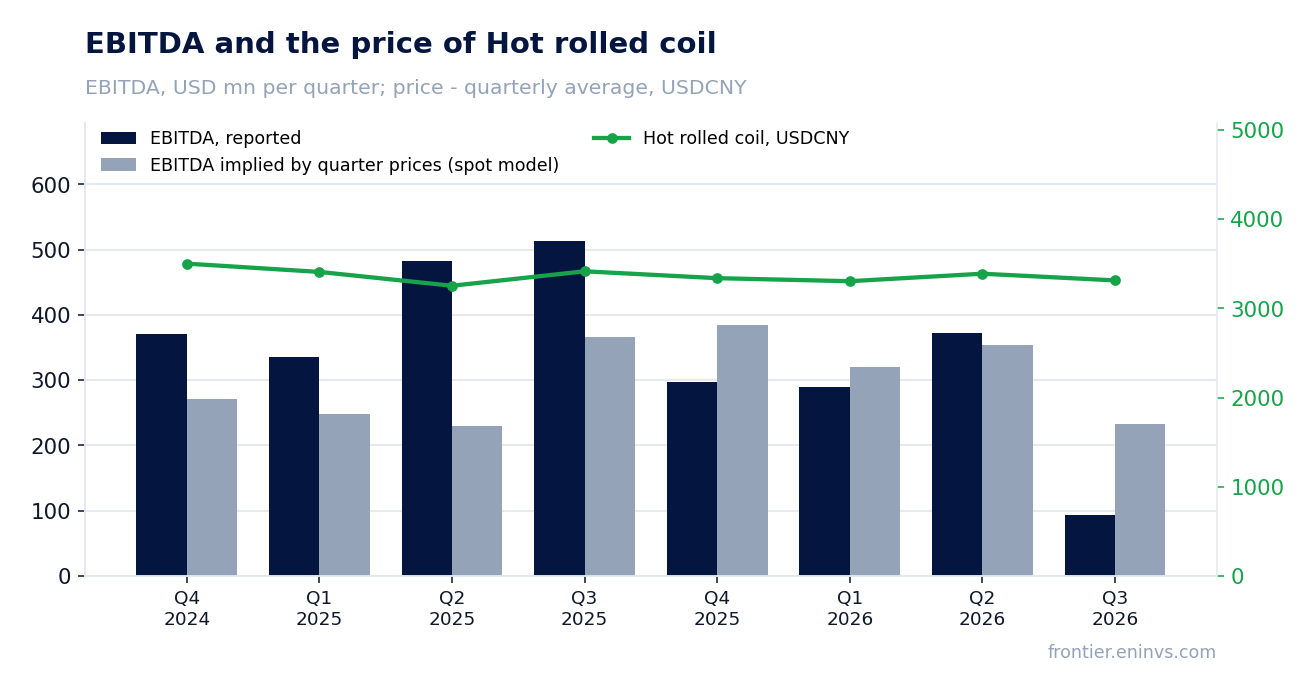
At the year-ago prices, our calculation puts EBITDA at 347.4 million dollars against 93.1 million reported – the 254.2 million gap is not only price
At the third-quarter 2025 volumes and costs and the reported-period prices, revenue should have been 2115.9 million dollars and EBITDA 347.4 million. Actual revenue was 1928.5 million, 187.4 million less, and EBITDA 93.1 million, 254.2 million less – 73.2% below the calculated figure.
The 8.9% revenue gap against the calculation shows price is not the whole story: at unchanged volumes the price effect was minus 3.4%. The rest comes from volumes and realised price against the benchmark, but the facts give no production or shipment figures, so we state the gap and leave it there.
The portal spot model, re-priced from the average of the previous four quarters, expected EBITDA of 232.3 million dollars and revenue of 2090.3 million. The actual figures are 59.9% below the model on EBITDA and 7.7% below on revenue. In the four preceding periods the deviation was +40.6%, -22.9%, -9.6% and +4.8% – this quarter's miss is well outside the usual range.
What the prices implied and what the company earned
| Base (Q3 2025) | Implied at period prices | Reported | Reported vs implied | |
|---|---|---|---|---|
| Revenue, USD mn | 2 191 | 2 116 | 1 928 | -8,9% |
| EBITDA, USD mn | 513,9 | 347,4 | 93,1 | -73,2% |
| EBITDA, portal spot model, USD mn | — | 232,3 | 93,1 | -59,9% |
Revenue and EBITDA by quarter
| Period | Measure | bn USD |
|---|---|---|
| Q4 2024 | Revenue | 1.3135 |
| Q1 2025 | Revenue | 1.940859 |
| Q2 2025 | Revenue | 1.9179410000000001 |
| Q3 2025 | Revenue | 2.191354 |
| Q4 2025 | Revenue | 2.082313 |
| Q1 2026 | Revenue | 2.1133580000000003 |
| Q2 2026 | Revenue | 2.226456 |
| Q3 2026 | Revenue | 1.928529 |
| Q4 2024 | EBITDA | 0.36996100000000004 |
| Q1 2025 | EBITDA | 0.33573400000000003 |
| Q2 2025 | EBITDA | 0.482361 |
| Q3 2025 | EBITDA | 0.5139239999999999 |
| Q4 2025 | EBITDA | 0.296744 |
| Q1 2026 | EBITDA | 0.288888 |
| Q2 2026 | EBITDA | 0.371555 |
| Q3 2026 | EBITDA | 0.09312700000000002 |
EBITDA margin
| Period | Measure | % |
|---|---|---|
| Q4 2024 | EBITDA margin | 28.2 |
| Q1 2025 | EBITDA margin | 17.3 |
| Q2 2025 | EBITDA margin | 25.1 |
| Q3 2025 | EBITDA margin | 23.5 |
| Q4 2025 | EBITDA margin | 14.3 |
| Q1 2026 | EBITDA margin | 13.7 |
| Q2 2026 | EBITDA margin | 16.7 |
| Q3 2026 | EBITDA margin | 4.8 |
Revenue fell 12.0% year on year after 16.1% growth a quarter earlier – a sharp deceleration, and the portal spot model expected 2090.3 million dollars against 1928.5 million actual
Third-quarter 2026 revenue was 1928.5 million dollars, 12.0% below a year earlier. In the second quarter it grew 16.1%, so the trend decelerated sharply. For a company where the portal model puts 55% of revenue in steel and 35% in iron ore, the downward turn in both prices explains most of that deceleration.
The portal spot model expected 2090.3 million dollars – the actual figure is 7.7% below. Even after adjusting for prices, the company sold less than a model built on its own previous four quarters assumed.
Quarterly revenue in 2026: 2113.4 million in the first quarter, 2226.5 million in the second and 1928.5 million in the third. The 13.4% drop against the previous quarter coincides with cheaper steel and cheaper ore.
The EBITDA margin compressed from 23.5% to 4.8%, and with coking coal at 242.8 dollars costs bite harder than revenue shows
Third-quarter EBITDA was 93.1 million dollars, 81.9% below a year earlier. The margin fell from 23.5% to 4.8%. The operating result turned negative at minus 105.1 million dollars, and depreciation of 198.2 million is the only reason EBITDA stayed positive.
Coking coal rose 27.7% year on year, which our price-effect calculation puts at 91.1 million dollars of extra costs. Against revenue of 1928.5 million that is worth almost five percentage points of margin the company does not have.
The net loss was 229.4 million dollars against a 14.2 million profit a year earlier. The net margin is minus 11.9% against plus 0.6%. Part of the loss sits below the operating line, but the source does not break out the items, so we state the figure and stop there.
Leverage is 8.01 times trailing-twelve-month EBITDA – a level that becomes 65.7 times EBITDA at today's prices
Net debt at 30 September 2026 was 7668.0 million dollars. Against trailing-twelve-month EBITDA of 957.1 million that is 8.01 times. Operating cash flow for the quarter was negative at minus 138.4 million dollars, and capital expenditure was 254.5 million – the quarter's investment was not covered by operating cash flow.
At today's prices the portal spot model puts annual EBITDA at 116.8 million dollars. On that base net debt is 65.7 times EBITDA and EV/EBITDA is 72.8. This is not a valuation of the company but an illustration of how far current earnings are from the debt.
Over the last twelve months EBITDA was 1050.3 million dollars, and EV/EBITDA on that base is 8.09. But those twelve months included quarters with higher steel and iron ore prices, and they cannot be relied on at today's spot.
At today's prices the portal spot model puts annual EBITDA at 116.8 million dollars against 1050.3 million over the last twelve months, and valuation should start from the former
The portal spot model re-prices the trailing-twelve-month base at today's prices. That gives EBITDA of 116.8 million dollars, 88.9% below the 1050.3 million over the last twelve months. For a commodity producer this is the earnings base valuation should start from: the past twelve months were earned at different prices.
EV/EBITDA on that base is 72.8 and net debt to EBITDA is 65.7. With a market capitalisation of 833.8 million dollars and net debt of 7668.0 million, the enterprise is worth about 8502 million, and at EBITDA of 116.8 million a multiple of 72.8 is unavoidable.
Iron ore reserves last 40.4 years at the current production rate. That is the one metric independent of price and it confirms the asset is long-lived – but it does not service debt this quarter.
Share price, three years
close, last point 2026-11-13
| Period | Measure | USD per share |
|---|---|---|
| 2025-11-14 | Closing price | 1.6100000143051147 |
| 2025-11-17 | Closing price | 1.5499999523162842 |
| 2025-11-18 | Closing price | 1.5299999713897705 |
| 2025-11-19 | Closing price | 1.5199999809265137 |
| 2025-11-20 | Closing price | 1.4800000190734863 |
| 2025-11-21 | Closing price | 1.5 |
| 2025-11-24 | Closing price | 1.4900000095367432 |
| 2025-11-25 | Closing price | 1.5499999523162842 |
| 2025-11-26 | Closing price | 1.6100000143051147 |
| 2025-11-28 | Closing price | 1.5800000429153442 |
| 2025-12-01 | Closing price | 1.590000033378601 |
| 2025-12-02 | Closing price | 1.6200000047683716 |
| 2025-12-03 | Closing price | 1.7100000381469727 |
| 2025-12-04 | Closing price | 1.7799999713897705 |
| 2025-12-05 | Closing price | 1.6399999856948853 |
| 2025-12-08 | Closing price | 1.6100000143051147 |
| 2025-12-09 | Closing price | 1.6699999570846558 |
| 2025-12-10 | Closing price | 1.7599999904632568 |
| 2025-12-11 | Closing price | 1.809999942779541 |
| 2025-12-12 | Closing price | 1.809999942779541 |
| 2025-12-15 | Closing price | 1.7400000095367432 |
| 2025-12-16 | Closing price | 1.7400000095367432 |
| 2025-12-17 | Closing price | 1.7300000190734863 |
| 2025-12-18 | Closing price | 1.7699999809265137 |
| 2025-12-19 | Closing price | 1.6299999952316284 |
| 2025-12-22 | Closing price | 1.6399999856948853 |
| 2025-12-23 | Closing price | 1.6399999856948853 |
| 2025-12-24 | Closing price | 1.6200000047683716 |
| 2025-12-26 | Closing price | 1.6200000047683716 |
| 2025-12-29 | Closing price | 1.5800000429153442 |
| 2025-12-30 | Closing price | 1.6299999952316284 |
| 2025-12-31 | Closing price | 1.600000023841858 |
| 2026-01-02 | Closing price | 1.6100000143051147 |
| 2026-01-05 | Closing price | 1.6699999570846558 |
| 2026-01-06 | Closing price | 1.75 |
| 2026-01-07 | Closing price | 1.8799999952316284 |
| 2026-01-08 | Closing price | 1.8700000047683716 |
| 2026-01-09 | Closing price | 1.8600000143051147 |
| 2026-01-12 | Closing price | 1.8700000047683716 |
| 2026-01-13 | Closing price | 1.8700000047683716 |
| 2026-01-14 | Closing price | 1.9500000476837158 |
| 2026-01-15 | Closing price | 1.899999976158142 |
| 2026-01-16 | Closing price | 1.7899999618530273 |
| 2026-01-20 | Closing price | 1.7000000476837158 |
| 2026-01-21 | Closing price | 1.7799999713897705 |
| 2026-01-22 | Closing price | 1.8200000524520874 |
| 2026-01-23 | Closing price | 1.9500000476837158 |
| 2026-01-26 | Closing price | 1.899999976158142 |
| 2026-01-27 | Closing price | 2.059999942779541 |
| 2026-01-28 | Closing price | 2.119999885559082 |
| 2026-01-29 | Closing price | 2.059999942779541 |
| 2026-01-30 | Closing price | 1.909999966621399 |
| 2026-02-02 | Closing price | 1.899999976158142 |
| 2026-02-03 | Closing price | 2.009999990463257 |
| 2026-02-04 | Closing price | 1.9600000381469727 |
| 2026-02-05 | Closing price | 1.8899999856948853 |
| 2026-02-06 | Closing price | 1.8300000429153442 |
| 2026-02-09 | Closing price | 1.899999976158142 |
| 2026-02-10 | Closing price | 1.8300000429153442 |
| 2026-02-11 | Closing price | 1.8799999952316284 |
| 2026-02-12 | Closing price | 1.7000000476837158 |
| 2026-02-13 | Closing price | 1.690000057220459 |
| 2026-02-17 | Closing price | 1.6799999475479126 |
| 2026-02-18 | Closing price | 1.659999966621399 |
| 2026-02-19 | Closing price | 1.659999966621399 |
| 2026-02-20 | Closing price | 1.7000000476837158 |
| 2026-02-23 | Closing price | 1.6699999570846558 |
| 2026-02-24 | Closing price | 1.6699999570846558 |
| 2026-02-25 | Closing price | 1.7000000476837158 |
| 2026-02-26 | Closing price | 1.7000000476837158 |
| 2026-02-27 | Closing price | 1.6799999475479126 |
| 2026-03-02 | Closing price | 1.6399999856948853 |
| 2026-03-03 | Closing price | 1.5 |
| 2026-03-04 | Closing price | 1.5499999523162842 |
| 2026-03-05 | Closing price | 1.4700000286102295 |
| 2026-03-06 | Closing price | 1.3899999856948853 |
| 2026-03-09 | Closing price | 1.4199999570846558 |
| 2026-03-10 | Closing price | 1.409999966621399 |
| 2026-03-11 | Closing price | 1.3799999952316284 |
| 2026-03-12 | Closing price | 1.2000000476837158 |
| 2026-03-13 | Closing price | 1.1100000143051147 |
| 2026-03-16 | Closing price | 1.1699999570846558 |
| 2026-03-17 | Closing price | 1.2000000476837158 |
| 2026-03-18 | Closing price | 1.1699999570846558 |
| 2026-03-19 | Closing price | 1.190000057220459 |
| 2026-03-20 | Closing price | 1.1399999856948853 |
| 2026-03-23 | Closing price | 1.25 |
| 2026-03-24 | Closing price | 1.2400000095367432 |
| 2026-03-25 | Closing price | 1.2899999618530273 |
| 2026-03-26 | Closing price | 1.2300000190734863 |
| 2026-03-27 | Closing price | 1.2100000381469727 |
| 2026-03-30 | Closing price | 1.1799999475479126 |
| 2026-03-31 | Closing price | 1.2400000095367432 |
| 2026-04-01 | Closing price | 1.2699999809265137 |
| 2026-04-02 | Closing price | 1.2599999904632568 |
| 2026-04-06 | Closing price | 1.2599999904632568 |
| 2026-04-07 | Closing price | 1.2400000095367432 |
| 2026-04-08 | Closing price | 1.3300000429153442 |
| 2026-04-09 | Closing price | 1.350000023841858 |
| 2026-04-10 | Closing price | 1.2899999618530273 |
| 2026-04-13 | Closing price | 1.3200000524520874 |
| 2026-04-14 | Closing price | 1.350000023841858 |
| 2026-04-15 | Closing price | 1.3700000047683716 |
| 2026-04-16 | Closing price | 1.340000033378601 |
| 2026-04-17 | Closing price | 1.3600000143051147 |
| 2026-04-20 | Closing price | 1.3799999952316284 |
| 2026-04-21 | Closing price | 1.2999999523162842 |
| 2026-04-22 | Closing price | 1.340000033378601 |
| 2026-04-23 | Closing price | 1.2899999618530273 |
| 2026-04-24 | Closing price | 1.2899999618530273 |
| 2026-04-27 | Closing price | 1.2899999618530273 |
| 2026-04-28 | Closing price | 1.2999999523162842 |
| 2026-04-29 | Closing price | 1.2699999809265137 |
| 2026-04-30 | Closing price | 1.2899999618530273 |
| 2026-05-01 | Closing price | 1.2899999618530273 |
| 2026-05-04 | Closing price | 1.2599999904632568 |
| 2026-05-05 | Closing price | 1.2999999523162842 |
| 2026-05-06 | Closing price | 1.399999976158142 |
| 2026-05-07 | Closing price | 1.340000033378601 |
| 2026-05-08 | Closing price | 1.3799999952316284 |
| 2026-05-11 | Closing price | 1.3700000047683716 |
| 2026-05-12 | Closing price | 1.3700000047683716 |
| 2026-05-13 | Closing price | 1.2799999713897705 |
| 2026-05-14 | Closing price | 1.350000023841858 |
| 2026-05-15 | Closing price | 1.2599999904632568 |
| 2026-05-18 | Closing price | 1.25 |
| 2026-05-19 | Closing price | 1.1799999475479126 |
| 2026-05-20 | Closing price | 1.25 |
| 2026-05-21 | Closing price | 1.2799999713897705 |
| 2026-05-22 | Closing price | 1.350000023841858 |
| 2026-05-26 | Closing price | 1.340000033378601 |
| 2026-05-27 | Closing price | 1.3200000524520874 |
| 2026-05-28 | Closing price | 1.3600000143051147 |
| 2026-05-29 | Closing price | 1.350000023841858 |
| 2026-06-01 | Closing price | 1.309999942779541 |
| 2026-06-02 | Closing price | 1.4199999570846558 |
| 2026-06-03 | Closing price | 1.309999942779541 |
| 2026-06-04 | Closing price | 1.2999999523162842 |
| 2026-06-05 | Closing price | 1.1799999475479126 |
| 2026-06-08 | Closing price | 1.149999976158142 |
| 2026-06-09 | Closing price | 1.1699999570846558 |
| 2026-06-10 | Closing price | 1.1799999475479126 |
| 2026-06-11 | Closing price | 1.2100000381469727 |
| 2026-06-12 | Closing price | 1.2200000286102295 |
| 2026-06-15 | Closing price | 1.2200000286102295 |
| 2026-06-16 | Closing price | 1.2100000381469727 |
| 2026-06-17 | Closing price | 1.1200000047683716 |
| 2026-06-18 | Closing price | 1.0299999713897705 |
| 2026-06-22 | Closing price | 1.0499999523162842 |
| 2026-06-23 | Closing price | 1.0399999618530273 |
| 2026-06-24 | Closing price | 0.9800000190734863 |
| 2026-06-25 | Closing price | 0.9599999785423279 |
| 2026-06-26 | Closing price | 0.9399999976158142 |
| 2026-06-29 | Closing price | 0.9100000262260437 |
| 2026-06-30 | Closing price | 0.9200000166893005 |
| 2026-07-01 | Closing price | 0.8999999761581421 |
| 2026-07-02 | Closing price | 0.9100000262260437 |
| 2026-07-06 | Closing price | 0.9599999785423279 |
| 2026-07-07 | Closing price | 0.9300000071525574 |
| 2026-07-08 | Closing price | 0.9200000166893005 |
| 2026-07-09 | Closing price | 0.949999988079071 |
| 2026-07-10 | Closing price | 1.0099999904632568 |
| 2026-07-13 | Closing price | 1.0299999713897705 |
| 2026-07-14 | Closing price | 1.0299999713897705 |
| 2026-07-15 | Closing price | 1.0299999713897705 |
| 2026-07-16 | Closing price | 1.0 |
| 2026-07-17 | Closing price | 0.9900000095367432 |
| 2026-07-20 | Closing price | 1.0099999904632568 |
| 2026-07-21 | Closing price | 1.0 |
| 2026-07-22 | Closing price | 1.090000033378601 |
| 2026-07-23 | Closing price | 1.059999942779541 |
| 2026-07-24 | Closing price | 1.0800000429153442 |
| 2026-07-27 | Closing price | 1.1200000047683716 |
| 2026-07-28 | Closing price | 1.100000023841858 |
| 2026-07-29 | Closing price | 1.0299999713897705 |
| 2026-07-30 | Closing price | 1.0099999904632568 |
| 2026-07-31 | Closing price | 0.9900000095367432 |
| 2026-08-03 | Closing price | 0.9300000071525574 |
| 2026-08-04 | Closing price | 0.9399999976158142 |
| 2026-08-05 | Closing price | 0.9800000190734863 |
| 2026-08-06 | Closing price | 0.9399999976158142 |
| 2026-08-07 | Closing price | 0.9300000071525574 |
| 2026-08-10 | Closing price | 0.8999999761581421 |
| 2026-08-11 | Closing price | 0.8700000047683716 |
| 2026-08-12 | Closing price | 0.8700000047683716 |
| 2026-08-13 | Closing price | 0.8999999761581421 |
| 2026-08-14 | Closing price | 0.8899999856948853 |
| 2026-08-17 | Closing price | 0.8999999761581421 |
| 2026-08-18 | Closing price | 0.8999999761581421 |
| 2026-08-19 | Closing price | 0.8799999952316284 |
| 2026-08-20 | Closing price | 0.8899999856948853 |
| 2026-08-21 | Closing price | 0.9800000190734863 |
| 2026-08-24 | Closing price | 1.0299999713897705 |
| 2026-08-25 | Closing price | 1.0199999809265137 |
| 2026-08-26 | Closing price | 1.0299999713897705 |
| 2026-08-27 | Closing price | 1.059999942779541 |
| 2026-08-28 | Closing price | 1.0199999809265137 |
| 2026-08-31 | Closing price | 1.0399999618530273 |
| 2026-09-01 | Closing price | 1.1299999952316284 |
| 2026-09-02 | Closing price | 1.1699999570846558 |
| 2026-09-03 | Closing price | 1.2599999904632568 |
| 2026-09-04 | Closing price | 1.2200000286102295 |
| 2026-09-08 | Closing price | 1.2400000095367432 |
| 2026-09-09 | Closing price | 1.3300000429153442 |
| 2026-09-10 | Closing price | 1.3799999952316284 |
| 2026-09-11 | Closing price | 1.2699999809265137 |
| 2026-09-14 | Closing price | 1.1799999475479126 |
| 2026-09-15 | Closing price | 1.2000000476837158 |
| 2026-09-16 | Closing price | 1.2100000381469727 |
| 2026-09-17 | Closing price | 1.1799999475479126 |
| 2026-09-18 | Closing price | 1.100000023841858 |
| 2026-09-21 | Closing price | 1.1699999570846558 |
| 2026-09-22 | Closing price | 1.1799999475479126 |
| 2026-09-23 | Closing price | 1.1399999856948853 |
| 2026-09-24 | Closing price | 1.100000023841858 |
| 2026-09-25 | Closing price | 1.100000023841858 |
| 2026-09-28 | Closing price | 1.1100000143051147 |
| 2026-09-29 | Closing price | 1.0199999809265137 |
| 2026-09-30 | Closing price | 1.059999942779541 |
| 2026-10-01 | Closing price | 1.1200000047683716 |
| 2026-10-02 | Closing price | 1.159999966621399 |
| 2026-10-05 | Closing price | 1.2400000095367432 |
| 2026-10-06 | Closing price | 1.2300000190734863 |
| 2026-10-07 | Closing price | 1.2300000190734863 |
| 2026-10-08 | Closing price | 1.2300000190734863 |
| 2026-10-09 | Closing price | 1.2799999713897705 |
| 2026-10-12 | Closing price | 1.2699999809265137 |
| 2026-10-13 | Closing price | 1.2400000095367432 |
| 2026-10-14 | Closing price | 1.2100000381469727 |
| 2026-10-15 | Closing price | 1.149999976158142 |
| 2026-10-16 | Closing price | 1.1100000143051147 |
| 2026-10-19 | Closing price | 1.1299999952316284 |
| 2026-10-20 | Closing price | 1.159999966621399 |
| 2026-10-21 | Closing price | 1.100000023841858 |
| 2026-10-22 | Closing price | 1.0399999618530273 |
| 2026-10-23 | Closing price | 1.1799999475479126 |
| 2026-10-26 | Closing price | 0.9100000262260437 |
| 2026-10-27 | Closing price | 0.8700000047683716 |
| 2026-10-28 | Closing price | 0.800000011920929 |
| 2026-10-29 | Closing price | 0.7799999713897705 |
| 2026-10-30 | Closing price | 0.7200000286102295 |
| 2026-11-02 | Closing price | 0.7200000286102295 |
| 2026-11-03 | Closing price | 0.7099999785423279 |
| 2026-11-04 | Closing price | 0.7799999713897705 |
| 2026-11-05 | Closing price | 0.7799999713897705 |
| 2026-11-06 | Closing price | 0.8500000238418579 |
| 2026-11-09 | Closing price | 0.8199999928474426 |
| 2026-11-10 | Closing price | 0.8100000023841858 |
| 2026-11-11 | Closing price | 0.8299999833106995 |
| 2026-11-12 | Closing price | 0.7699999809265137 |
| 2026-11-13 | Closing price | 0.6299999952316284 |
Reserves last 40.4 years at the current production rate – the one thing that does not depend on price
At the current production rate iron ore reserves last 40.4 years. For a company with 35% of revenue in iron ore, that means the question is not depletion of the base but price and costs.
Spot ore on 16 November was 89.9 dollars per tonne, 7.6% below the reported-quarter average. If that price holds, the next quarter's price effect will be worse than the third. It is the price of ore and steel, not volumes, that will determine whether EBITDA returns to levels at which the debt is serviceable.
Valuation on the latest reported figures
| Metric | Value |
|---|---|
| Market cap | 0.83 bn USD |
| EV/EBITDA (LTM) | 8.1 |
| P/B | 0.29 |
| Net debt / EBITDA (LTM) | 8.01 |
| ROE | -33.3% |
Net profit by quarter
| Period | Measure | bn USD |
|---|---|---|
| Q4 2024 | Net profit | −0.013758 |
| Q1 2025 | Net profit | −0.130174 |
| Q2 2025 | Net profit | −0.023382999999999998 |
| Q3 2025 | Net profit | 0.014202999999999999 |
| Q4 2025 | Net profit | −0.13169999999999998 |
| Q1 2026 | Net profit | −0.11061700000000001 |
| Q2 2026 | Net profit | −0.152234 |
| Q3 2026 | Net profit | −0.229399 |
Bottom line
The only genuinely strong item in the report is that iron ore reserves last 40.4 years, and that does not depend on price. Everything else worked against the company: steel fell 3.0%, ore 5.2%, coking coal rose 27.7%, and EBITDA dropped 81.9% to 93.1 million dollars at a 4.8% margin. At the year-ago prices our calculation puts EBITDA at 347.4 million – the 254.2 million gap is not explained by price alone, but even without it the picture is heavy. The real question for a holder now is not revenue but debt: 7668.0 million dollars of net debt against the portal spot model's 116.8 million of EBITDA is 65.7 times. Our conclusion: the share is rather unattractive – at today's prices EV/EBITDA on the portal spot model is 72.8, which leaves no cushion. Our view: the share is rather unattractive at the current price.