Sociedad Quimica y Minera de Chile: lithium doubled, yet EBITDA came in 17% below what the price implied
Contents
Sociedad Quimica y Minera de Chile reported third-quarter 2026 results. The average lithium hydroxide price in the period was USD 18,522/t against USD 8,627/t a year earlier (+114.7%), revenue rose 80.0% to USD 2,112.0 mn, EBITDA by 147.5% to USD 1,000.1 mn and net profit by 205.0% to USD 544.2 mn. At the year-ago volumes and costs and moving only the price, our calculation puts revenue at USD 1,980.4 mn and EBITDA at USD 1,211.4 mn; actual EBITDA is USD 211.4 mn (17.4%) below that, and the gap is explained by volumes, the realised price against the benchmark and unit costs. Our conclusion: the share is rather unattractive – on the portal's model its upside to fair value is -36%. Our view: the share is rather unattractive at the current price; upside on the portal model -36%.
Our view: is there upside
Our view in numbers
| Metric | Our read |
|---|---|
| Verdict | Rather unattractive |
| Upside on the portal model | -36% |
| How the model works | spot model: EBITDA re-priced to current commodity prices at the target EV/EBITDA, against market cap |
| EV/EBITDA now and 3-year average | 4.4 vs 8.8 – a 50% discount to its history |
| Dividend yield, 12m | 5.2% |
| Net debt / EBITDA | 0.75 – low leverage |
| Strongest case for | A 5.2% dividend yield with leverage of 0.75 EBITDA over the last twelve months – the payout is covered and substantial. |
| Strongest case against | On the portal model the upside to fair value is -36%, and at today's prices EV/EBITDA is 8.2 against 4.4 on past EBITDA. |
| What would change the view | A return of the spot lithium hydroxide price to the reported-period average of USD 18,522/t would lift the verdict one step. |
Key takeaways
— The lithium hydroxide price rose 114.7% year on year, but is already 11.2% below the previous quarter, and spot is 34.6% below the reported-period average
— At the year-ago volumes and costs, the price implied EBITDA of USD 1,211.4 mn; the company earned USD 1,000.1 mn – USD 211.4 mn less
— Revenue is 6.6% above the price-implied level while EBITDA is 17.4% below – the realised price and unit costs ate into part of the price effect
— The EBITDA margin rose to 47.4% from 34.4%, but at today's prices annual EBITDA is put at USD 2,004 mn against USD 3,729.2 mn over the last twelve months
— Leverage is 0.75 EBITDA over the last twelve months – a moderate level, but at today's prices it rises to 1.4
— A 5.2% dividend yield on a P/E of 7.8 is a substantial payout, but its base is calculated on past lithium prices
— EV/EBITDA of 4.4 against its own three-year average of 8.8 is a 50% discount, but it reflects prices below the reported-period average rather than cheapness
Key figures, USD bn
| Metric | Q3 2025 | Q3 2026 | Change |
|---|---|---|---|
| Revenue | 1.17 | 2.11 | +80.0% |
| EBITDA | 0.40 | 1.00 | +147.5% |
| Operating profit | 0.29 | 0.88 | +205.1% |
| Net profit | 0.18 | 0.54 | +205.0% |
| Operating cash flow | 0.43 | — | — |
| Capex | 0.24 | — | — |
| EBITDA margin | 34.4% | 47.4% | +13.0 pp |
| Net margin | 15.2% | 25.8% | +10.6 pp |
The lithium hydroxide price rose 114.7% year on year, but is already 11.2% below the previous quarter, and spot is 34.6% below the reported-period average
The average lithium hydroxide price in the third quarter of 2026 was USD 18,522/t against USD 8,627/t a year earlier – up 114.7%. This is the main driver of the report: lithium accounts for about 60% of revenue in the portal's model, and the doubling of the price explains almost all of the 80.0% revenue growth.
The intra-year dynamics are different. Against the previous quarter the average price fell 11.2%, from USD 20,847/t. Spot on 20 November 2026 is USD 12,119/t, 34.6% below the reported-period average. The report therefore captured a high price that was no longer in force by the time it was published.
Commodity prices: period average and now
| Benchmark | Year ago | Q3 2026 | YoY | Spot 2026-11-20 |
|---|---|---|---|---|
| Lithium Hydroxide CIF USD/TNE, USD | 8 627 | 18 522 | +114,7% | 12 119 |
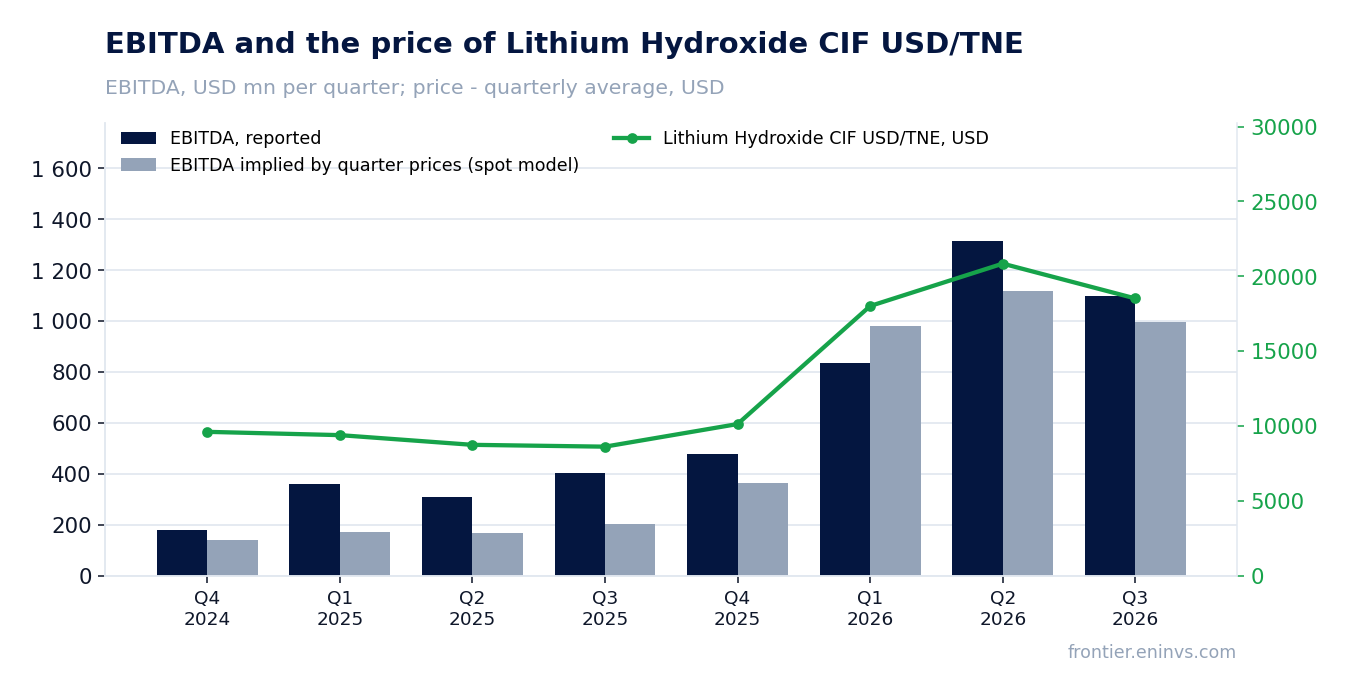
At the year-ago volumes and costs, the price implied EBITDA of USD 1,211.4 mn; the company earned USD 1,000.1 mn – USD 211.4 mn less
Holding third-quarter 2025 volumes and costs and moving only the lithium price, revenue would have been USD 1,980.4 mn (price effect +USD 807.3 mn, +68.8%) and EBITDA USD 1,211.4 mn. Actual revenue reached USD 2,112.0 mn, USD 131.6 mn (6.6%) above the implied level, while EBITDA was USD 1,000.1 mn, USD 211.4 mn (17.4%) below.
The gap running in opposite directions means that volumes or the realised price came in above the price-implied level, but unit costs rose enough to absorb that and part of the price effect as well. The facts do not disclose the cause; only the direction is known – cost per unit went up.
The portal's spot model, re-priced from the average of the previous four quarters, expected EBITDA of USD 995.4 mn and revenue of USD 1,986.8 mn; the actual figures are 0.5% above on EBITDA and 6.3% above on revenue. That estimate is the model's run-rate view and disagrees with the year-ago calculation, which we take as the primary basis.
What the prices implied and what the company earned
| Base (Q3 2025) | Implied at period prices | Reported | Reported vs implied | |
|---|---|---|---|---|
| Revenue, USD mn | 1 173 | 1 980 | 2 112 | +6,6% |
| EBITDA, USD mn | 404,1 | 1 211 | 1 000 | -17,4% |
| EBITDA, portal spot model, USD mn | — | 995,4 | 1 000 | +0,5% |
Revenue and EBITDA by quarter
| Period | Measure | bn USD |
|---|---|---|
| Q4 2024 | Revenue | 1.0737580000000007 |
| Q1 2025 | Revenue | 1.0366300000000002 |
| Q2 2025 | Revenue | 1.0426769999999999 |
| Q3 2025 | Revenue | 1.173047 |
| Q4 2025 | Revenue | 1.3238699999999999 |
| Q1 2026 | Revenue | 1.76 |
| Q2 2026 | Revenue | 2.4683 |
| Q3 2026 | Revenue | 2.112012 |
| Q4 2024 | EBITDA | 0.17912899999999993 |
| Q1 2025 | EBITDA | 0.359635 |
| Q2 2025 | EBITDA | 0.307895 |
| Q3 2025 | EBITDA | 0.40411 |
| Q4 2025 | EBITDA | 0.47822899999999996 |
| Q1 2026 | EBITDA | 0.8359540000000001 |
| Q2 2026 | EBITDA | 1.316799 |
| Q3 2026 | EBITDA | 1.098176 |
EBITDA margin
| Period | Measure | % |
|---|---|---|
| Q4 2024 | EBITDA margin | 16.7 |
| Q1 2025 | EBITDA margin | 34.7 |
| Q2 2025 | EBITDA margin | 29.5 |
| Q3 2025 | EBITDA margin | 34.4 |
| Q4 2025 | EBITDA margin | 36.1 |
| Q1 2026 | EBITDA margin | 47.5 |
| Q2 2026 | EBITDA margin | 53.3 |
| Q3 2026 | EBITDA margin | 52.0 |
Revenue is 6.6% above the price-implied level while EBITDA is 17.4% below – the realised price and unit costs ate into part of the price effect
Revenue of USD 2,112.0 mn with 80.0% year-on-year growth is above the price-implied level, but growth decelerated: in the second quarter of 2026 revenue added 136.7%. The deceleration is driven primarily by price: the average lithium price in the third quarter is 11.2% below the second.
At the previous quarter's volumes and costs and moving only the price, our calculation gives revenue of USD 2,303.1 mn and EBITDA of USD 1,151.6 mn. The actual figures are USD 191.1 mn (8.3%) lower on revenue and USD 151.6 mn (13.2%) lower on EBITDA. Both gaps are negative, meaning volumes or unit costs added to the price decline.
The EBITDA margin rose to 47.4% from 34.4% a year earlier, and the net margin to 25.8% from 15.2%. The margin rests on the high price of the reported period; at today's spot price it will not hold.
The EBITDA margin rose to 47.4% from 34.4%, but at today's prices annual EBITDA is put at USD 2,004 mn against USD 3,729.2 mn over the last twelve months
Over the last twelve months to 30 September 2026, EBITDA was USD 3,729.2 mn on revenue of USD 7,700.0 mn and net profit of USD 1,752.7 mn. That is earnings at prices above today's.
On the portal's spot model, annual EBITDA at today's prices is put at USD 2,004 mn – 42.0% below the last-twelve-month level. Valuation should start from this base, not from historical EBITDA.
On that base EV/EBITDA at current prices is 8.2 and leverage is 1.4. This is no longer a cheap share: the market is paying almost nine times annual EBITDA for lithium at today's price.
Leverage is 0.75 EBITDA over the last twelve months – a moderate level, but at today's prices it rises to 1.4
Net debt at 30 September 2026 was USD 2,797.6 mn, or 0.75 EBITDA over the last twelve months. That is a moderate level for a producer of fertilisers and lithium.
At today's lithium prices the same debt corresponds to 1.4 EBITDA. Leverage remains manageable, but the cushion is half what the reported base shows.
Operating cash flow and capital expenditure for the third quarter of 2026 are not disclosed in the facts, so we do not assess the link between debt and cash flow for the reported period.
Valuation vs its own history
now vs the 3-year average
| Period | Measure | × |
|---|---|---|
| EV/EBITDA | Now | 4.415297576718391 |
| EV/EBITDA | 3-year average | 8.794095663080522 |
A 5.2% dividend yield on a P/E of 7.8 is a substantial payout, but its base is calculated on past lithium prices
The dividend yield over the last twelve months is 5.2%, and the P/E for the same period is 7.8. The payout is substantial and rests on profit earned at high lithium prices.
Our estimate of the current-year dividend starts from last-twelve-month profit of USD 1,752.7 mn and the payout ratio the company has kept in the past; at today's prices profit will be lower and the payout will shrink. This is our estimate, not company guidance.
The 5.2% yield is above the key rate, but it rests on past profit. If the spot lithium price of USD 12,119/t holds, the dividend base will roughly halve together with EBITDA.
Share price, three years
close, last point 2026-11-19
| Period | Measure | USD per share |
|---|---|---|
| 2025-11-20 | Closing price | 60.52000045776367 |
| 2025-11-21 | Closing price | 59.540000915527344 |
| 2025-11-24 | Closing price | 58.5099983215332 |
| 2025-11-25 | Closing price | 61.779998779296875 |
| 2025-11-26 | Closing price | 63.20000076293945 |
| 2025-11-28 | Closing price | 64.31999969482422 |
| 2025-12-01 | Closing price | 63.93000030517578 |
| 2025-12-02 | Closing price | 64.37000274658203 |
| 2025-12-03 | Closing price | 63.060001373291016 |
| 2025-12-04 | Closing price | 60.66999816894531 |
| 2025-12-05 | Closing price | 61.2599983215332 |
| 2025-12-08 | Closing price | 60.439998626708984 |
| 2025-12-09 | Closing price | 62.900001525878906 |
| 2025-12-10 | Closing price | 63.959999084472656 |
| 2025-12-11 | Closing price | 65.0199966430664 |
| 2025-12-12 | Closing price | 65.83000183105469 |
| 2025-12-15 | Closing price | 64.97000122070312 |
| 2025-12-16 | Closing price | 64.16999816894531 |
| 2025-12-17 | Closing price | 65.91999816894531 |
| 2025-12-18 | Closing price | 67.69999694824219 |
| 2025-12-19 | Closing price | 68.76000213623047 |
| 2025-12-22 | Closing price | 70.22000122070312 |
| 2025-12-23 | Closing price | 70.88999938964844 |
| 2025-12-24 | Closing price | 70.9000015258789 |
| 2025-12-26 | Closing price | 71.63999938964844 |
| 2025-12-29 | Closing price | 70.06999969482422 |
| 2025-12-30 | Closing price | 68.9800033569336 |
| 2025-12-31 | Closing price | 68.80000305175781 |
| 2026-01-02 | Closing price | 69.7300033569336 |
| 2026-01-05 | Closing price | 70.13999938964844 |
| 2026-01-06 | Closing price | 74.52999877929688 |
| 2026-01-07 | Closing price | 75.0999984741211 |
| 2026-01-08 | Closing price | 74.05999755859375 |
| 2026-01-09 | Closing price | 74.4000015258789 |
| 2026-01-12 | Closing price | 77.76000213623047 |
| 2026-01-13 | Closing price | 80.9800033569336 |
| 2026-01-14 | Closing price | 83.18000030517578 |
| 2026-01-15 | Closing price | 79.58000183105469 |
| 2026-01-16 | Closing price | 77.52999877929688 |
| 2026-01-20 | Closing price | 80.1500015258789 |
| 2026-01-21 | Closing price | 81.80999755859375 |
| 2026-01-22 | Closing price | 83.83999633789062 |
| 2026-01-23 | Closing price | 85.43000030517578 |
| 2026-01-26 | Closing price | 84.01000213623047 |
| 2026-01-27 | Closing price | 84.37000274658203 |
| 2026-01-28 | Closing price | 83.56999969482422 |
| 2026-01-29 | Closing price | 81.63999938964844 |
| 2026-01-30 | Closing price | 76.83999633789062 |
| 2026-02-02 | Closing price | 75.25 |
| 2026-02-03 | Closing price | 79.30000305175781 |
| 2026-02-04 | Closing price | 73.77999877929688 |
| 2026-02-05 | Closing price | 70.81999969482422 |
| 2026-02-06 | Closing price | 71.4800033569336 |
| 2026-02-09 | Closing price | 71.1500015258789 |
| 2026-02-10 | Closing price | 70.27999877929688 |
| 2026-02-11 | Closing price | 75.23999786376953 |
| 2026-02-12 | Closing price | 70.11000061035156 |
| 2026-02-13 | Closing price | 70.91000366210938 |
| 2026-02-17 | Closing price | 72.4000015258789 |
| 2026-02-18 | Closing price | 72.77999877929688 |
| 2026-02-19 | Closing price | 72.0999984741211 |
| 2026-02-20 | Closing price | 71.86000061035156 |
| 2026-02-23 | Closing price | 73.06999969482422 |
| 2026-02-24 | Closing price | 76.72000122070312 |
| 2026-02-25 | Closing price | 79.54000091552734 |
| 2026-02-26 | Closing price | 77.97000122070312 |
| 2026-02-27 | Closing price | 76.30000305175781 |
| 2026-03-02 | Closing price | 75.62999725341797 |
| 2026-03-03 | Closing price | 68.80000305175781 |
| 2026-03-04 | Closing price | 72.0199966430664 |
| 2026-03-05 | Closing price | 70.62000274658203 |
| 2026-03-06 | Closing price | 70.38999938964844 |
| 2026-03-09 | Closing price | 75.0 |
| 2026-03-10 | Closing price | 76.55999755859375 |
| 2026-03-11 | Closing price | 77.83999633789062 |
| 2026-03-12 | Closing price | 75.66999816894531 |
| 2026-03-13 | Closing price | 74.44999694824219 |
| 2026-03-16 | Closing price | 76.3499984741211 |
| 2026-03-17 | Closing price | 77.11000061035156 |
| 2026-03-18 | Closing price | 75.02999877929688 |
| 2026-03-19 | Closing price | 74.66000366210938 |
| 2026-03-20 | Closing price | 71.16000366210938 |
| 2026-03-23 | Closing price | 75.38999938964844 |
| 2026-03-24 | Closing price | 76.94000244140625 |
| 2026-03-25 | Closing price | 79.16000366210938 |
| 2026-03-26 | Closing price | 77.37000274658203 |
| 2026-03-27 | Closing price | 82.69999694824219 |
| 2026-03-30 | Closing price | 80.91999816894531 |
| 2026-03-31 | Closing price | 80.94000244140625 |
| 2026-04-01 | Closing price | 81.81999969482422 |
| 2026-04-02 | Closing price | 83.20999908447266 |
| 2026-04-06 | Closing price | 80.44999694824219 |
| 2026-04-07 | Closing price | 78.5199966430664 |
| 2026-04-08 | Closing price | 82.4800033569336 |
| 2026-04-09 | Closing price | 82.16999816894531 |
| 2026-04-10 | Closing price | 82.12000274658203 |
| 2026-04-13 | Closing price | 87.62999725341797 |
| 2026-04-14 | Closing price | 88.93000030517578 |
| 2026-04-15 | Closing price | 87.62000274658203 |
| 2026-04-16 | Closing price | 95.30999755859375 |
| 2026-04-17 | Closing price | 88.80000305175781 |
| 2026-04-20 | Closing price | 88.41999816894531 |
| 2026-04-21 | Closing price | 87.22000122070312 |
| 2026-04-22 | Closing price | 86.94999694824219 |
| 2026-04-23 | Closing price | 85.44999694824219 |
| 2026-04-24 | Closing price | 88.79000091552734 |
| 2026-04-27 | Closing price | 91.29000091552734 |
| 2026-04-28 | Closing price | 89.41999816894531 |
| 2026-04-29 | Closing price | 91.01000213623047 |
| 2026-04-30 | Closing price | 92.16999816894531 |
| 2026-05-01 | Closing price | 92.68000030517578 |
| 2026-05-04 | Closing price | 89.75 |
| 2026-05-05 | Closing price | 92.63999938964844 |
| 2026-05-06 | Closing price | 93.45999908447266 |
| 2026-05-07 | Closing price | 91.5999984741211 |
| 2026-05-08 | Closing price | 91.38999938964844 |
| 2026-05-11 | Closing price | 93.41999816894531 |
| 2026-05-12 | Closing price | 94.62999725341797 |
| 2026-05-13 | Closing price | 91.62000274658203 |
| 2026-05-14 | Closing price | 86.80000305175781 |
| 2026-05-15 | Closing price | 84.26000213623047 |
| 2026-05-18 | Closing price | 82.66000366210938 |
| 2026-05-19 | Closing price | 80.44999694824219 |
| 2026-05-20 | Closing price | 81.37999725341797 |
| 2026-05-21 | Closing price | 79.29000091552734 |
| 2026-05-22 | Closing price | 80.18000030517578 |
| 2026-05-26 | Closing price | 80.43000030517578 |
| 2026-05-27 | Closing price | 83.94000244140625 |
| 2026-05-28 | Closing price | 84.05000305175781 |
| 2026-05-29 | Closing price | 85.87000274658203 |
| 2026-06-01 | Closing price | 83.41999816894531 |
| 2026-06-02 | Closing price | 80.83999633789062 |
| 2026-06-03 | Closing price | 78.58000183105469 |
| 2026-06-04 | Closing price | 77.69000244140625 |
| 2026-06-05 | Closing price | 75.43000030517578 |
| 2026-06-08 | Closing price | 72.76000213623047 |
| 2026-06-09 | Closing price | 75.66000366210938 |
| 2026-06-10 | Closing price | 74.23999786376953 |
| 2026-06-11 | Closing price | 80.44000244140625 |
| 2026-06-12 | Closing price | 84.12000274658203 |
| 2026-06-15 | Closing price | 83.2699966430664 |
| 2026-06-16 | Closing price | 83.11000061035156 |
| 2026-06-17 | Closing price | 82.98999786376953 |
| 2026-06-18 | Closing price | 79.69000244140625 |
| 2026-06-22 | Closing price | 78.6500015258789 |
| 2026-06-23 | Closing price | 76.5 |
| 2026-06-24 | Closing price | 75.58000183105469 |
| 2026-06-25 | Closing price | 73.11000061035156 |
| 2026-06-26 | Closing price | 71.58999633789062 |
| 2026-06-29 | Closing price | 69.86000061035156 |
| 2026-06-30 | Closing price | 74.04000091552734 |
| 2026-07-01 | Closing price | 74.22000122070312 |
| 2026-07-02 | Closing price | 72.69999694824219 |
| 2026-07-06 | Closing price | 73.5199966430664 |
| 2026-07-07 | Closing price | 73.4000015258789 |
| 2026-07-08 | Closing price | 74.43000030517578 |
| 2026-07-09 | Closing price | 74.08999633789062 |
| 2026-07-10 | Closing price | 73.19000244140625 |
| 2026-07-13 | Closing price | 71.94000244140625 |
| 2026-07-14 | Closing price | 72.94999694824219 |
| 2026-07-15 | Closing price | 71.5199966430664 |
| 2026-07-16 | Closing price | 66.33000183105469 |
| 2026-07-17 | Closing price | 69.80999755859375 |
| 2026-07-20 | Closing price | 67.69000244140625 |
| 2026-07-21 | Closing price | 68.83999633789062 |
| 2026-07-22 | Closing price | 69.20999908447266 |
| 2026-07-23 | Closing price | 69.31999969482422 |
| 2026-07-24 | Closing price | 68.7300033569336 |
| 2026-07-27 | Closing price | 68.79000091552734 |
| 2026-07-28 | Closing price | 66.87000274658203 |
| 2026-07-29 | Closing price | 67.55000305175781 |
| 2026-07-30 | Closing price | 68.43000030517578 |
| 2026-07-31 | Closing price | 67.05999755859375 |
| 2026-08-03 | Closing price | 67.02999877929688 |
| 2026-08-04 | Closing price | 68.58000183105469 |
| 2026-08-05 | Closing price | 70.05000305175781 |
| 2026-08-06 | Closing price | 72.44999694824219 |
| 2026-08-07 | Closing price | 71.94999694824219 |
| 2026-08-10 | Closing price | 72.83999633789062 |
| 2026-08-11 | Closing price | 72.22000122070312 |
| 2026-08-12 | Closing price | 71.25 |
| 2026-08-13 | Closing price | 72.16000366210938 |
| 2026-08-14 | Closing price | 74.31999969482422 |
| 2026-08-17 | Closing price | 75.0999984741211 |
| 2026-08-18 | Closing price | 74.47000122070312 |
| 2026-08-19 | Closing price | 75.37999725341797 |
| 2026-08-20 | Closing price | 78.44999694824219 |
| 2026-08-21 | Closing price | 81.95999908447266 |
| 2026-08-24 | Closing price | 82.33000183105469 |
| 2026-08-25 | Closing price | 79.20999908447266 |
| 2026-08-26 | Closing price | 78.27999877929688 |
| 2026-08-27 | Closing price | 80.43000030517578 |
| 2026-08-28 | Closing price | 78.62999725341797 |
| 2026-08-31 | Closing price | 79.01000213623047 |
| 2026-09-01 | Closing price | 80.51000213623047 |
| 2026-09-02 | Closing price | 81.13999938964844 |
| 2026-09-03 | Closing price | 79.77999877929688 |
| 2026-09-04 | Closing price | 76.43000030517578 |
| 2026-09-08 | Closing price | 75.66000366210938 |
| 2026-09-09 | Closing price | 75.45999908447266 |
| 2026-09-10 | Closing price | 72.48999786376953 |
| 2026-09-11 | Closing price | 69.87999725341797 |
| 2026-09-14 | Closing price | 69.7300033569336 |
| 2026-09-15 | Closing price | 69.29000091552734 |
| 2026-09-16 | Closing price | 68.68000030517578 |
| 2026-09-17 | Closing price | 71.80000305175781 |
| 2026-09-18 | Closing price | 67.72000122070312 |
| 2026-09-21 | Closing price | 69.52999877929688 |
| 2026-09-22 | Closing price | 70.19000244140625 |
| 2026-09-23 | Closing price | 69.08000183105469 |
| 2026-09-24 | Closing price | 67.12000274658203 |
| 2026-09-25 | Closing price | 66.88999938964844 |
| 2026-09-28 | Closing price | 65.16000366210938 |
| 2026-09-29 | Closing price | 66.08000183105469 |
| 2026-09-30 | Closing price | 64.87000274658203 |
| 2026-10-01 | Closing price | 64.12000274658203 |
| 2026-10-02 | Closing price | 64.5199966430664 |
| 2026-10-05 | Closing price | 65.83000183105469 |
| 2026-10-06 | Closing price | 66.16999816894531 |
| 2026-10-07 | Closing price | 64.61000061035156 |
| 2026-10-08 | Closing price | 64.5199966430664 |
| 2026-10-09 | Closing price | 63.90999984741211 |
| 2026-10-12 | Closing price | 62.470001220703125 |
| 2026-10-13 | Closing price | 62.83000183105469 |
| 2026-10-14 | Closing price | 61.63999938964844 |
| 2026-10-15 | Closing price | 60.470001220703125 |
| 2026-10-16 | Closing price | 60.20000076293945 |
| 2026-10-19 | Closing price | 60.130001068115234 |
| 2026-10-20 | Closing price | 60.04999923706055 |
| 2026-10-21 | Closing price | 58.439998626708984 |
| 2026-10-22 | Closing price | 56.369998931884766 |
| 2026-10-23 | Closing price | 57.13999938964844 |
| 2026-10-26 | Closing price | 56.970001220703125 |
| 2026-10-27 | Closing price | 60.29999923706055 |
| 2026-10-28 | Closing price | 58.939998626708984 |
| 2026-10-29 | Closing price | 56.369998931884766 |
| 2026-10-30 | Closing price | 54.650001525878906 |
| 2026-11-02 | Closing price | 54.66999816894531 |
| 2026-11-03 | Closing price | 53.709999084472656 |
| 2026-11-04 | Closing price | 57.560001373291016 |
| 2026-11-05 | Closing price | 56.36000061035156 |
| 2026-11-06 | Closing price | 57.52000045776367 |
| 2026-11-09 | Closing price | 56.70000076293945 |
| 2026-11-10 | Closing price | 54.43000030517578 |
| 2026-11-11 | Closing price | 54.7400016784668 |
| 2026-11-12 | Closing price | 53.88999938964844 |
| 2026-11-13 | Closing price | 53.61000061035156 |
| 2026-11-16 | Closing price | 51.130001068115234 |
| 2026-11-17 | Closing price | 51.59000015258789 |
| 2026-11-18 | Closing price | 48.7400016784668 |
| 2026-11-19 | Closing price | 47.849998474121094 |
EV/EBITDA of 4.4 against its own three-year average of 8.8 is a 50% discount, but it reflects prices below the reported-period average rather than cheapness
EV/EBITDA over the last twelve months is 4.4 against its own three-year average of 8.8, a 50% discount. On the face of it the share is twice as cheap as its history.
But the denominator of that multiple is EBITDA earned at prices above today's. At current prices EV/EBITDA is 8.2, meaning the share trades almost at its three-year average, not at a discount.
On the portal's model, which re-prices EBITDA to current prices at the target multiple, the upside to fair value is -36%. That is our own calculation, not a market consensus.
Valuation on the latest reported figures
| Metric | Value |
|---|---|
| Market cap | 13.7 bn USD |
| P/E (LTM) | 7.8 |
| EV/EBITDA (LTM) | 4.4 |
| P/B | 2.65 |
| Net debt / EBITDA (LTM) | 0.75 |
| ROE | 33.5% |
| Dividend yield (12m) | 5.2% |
| EV/EBITDA, 3-year average | 8.8 |
Net profit by quarter
| Period | Measure | bn USD |
|---|---|---|
| Q4 2024 | Net profit | 1.2163309999999998 |
| Q1 2025 | Net profit | 0.13752799999999998 |
| Q2 2025 | Net profit | 0.088422 |
| Q3 2025 | Net profit | 0.178418 |
| Q4 2025 | Net profit | 0.18377000000000002 |
| Q1 2026 | Net profit | 0.36469999999999997 |
| Q2 2026 | Net profit | 0.66 |
| Q3 2026 | Net profit | 0.544233 |
Bottom line
What was strong in the report came from price: revenue +80.0%, EBITDA +147.5%, net profit +205.0%, an EBITDA margin of 47.4%. But the price has already turned – spot is 34.6% below the quarterly average, and EBITDA is 17.4% below what that price implied at year-ago volumes and costs. The 4.4 multiple looks like a 50% discount to its own history only on past EBITDA; at today's prices it is 8.2, and the portal model's upside is -36%. The 5.2% dividend yield is substantial, but its base is calculated on past prices. Our conclusion: the share is rather unattractive – on the portal's model its upside to fair value is -36%. Our view: the share is rather unattractive at the current price; upside on the portal model -36%.