Suncor Energy: profit tripled, but half the quarter rests on the oil price
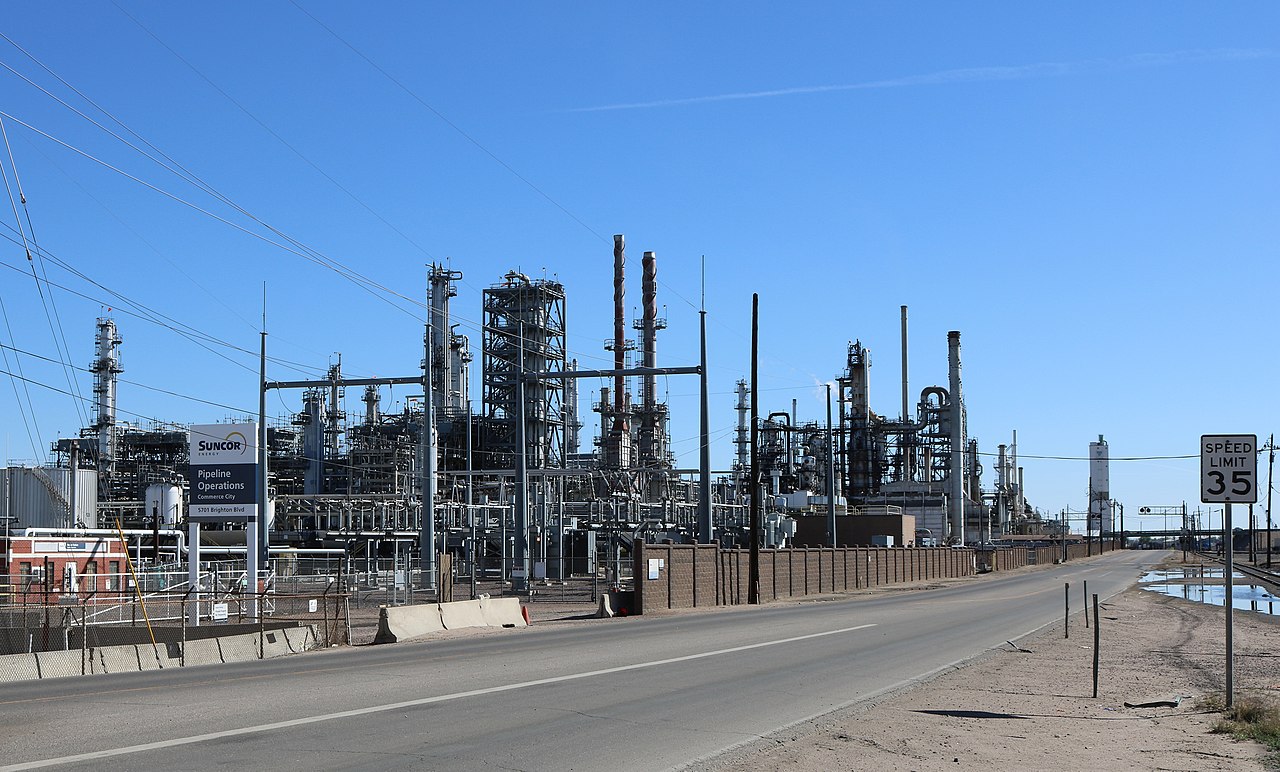
On 25 August Suncor Energy reported results for the second quarter of 2026. Revenue rose 51.8% year on year to USD 13,845.8 mn, EBITDA by 111.9% to USD 5,020.7 mn, and net profit by 235.0% to USD 2,718.3 mn. The EBITDA margin climbed to 36.3% from 26.0% a year earlier, while net debt fell from USD 5.0 bn to USD 3.3 bn over the quarter. At a P/E LTM of 12.8 and a dividend yield of 1.9%, the share looks rather attractive, but the growth rests on the oil price rather than on durable business expansion.
Key takeaways
— Revenue rose 51.8% year on year, and almost all of that gain came from the oil price, not from volumes
— The EBITDA margin climbed to 36.3% from 26.0% – operating leverage worked on higher revenue
— Net profit added 235.0%, but the year-ago base was low at USD 811.5 mn
— Operating cash flow for the quarter was USD 4,119.0 mn, comfortably covering the dividend
— Net debt fell from USD 5.0 bn to USD 3.3 bn, and net debt to EBITDA LTM stands at 0.23
— The dividend yield of 1.9% is modest, and the payout depends on the same oil price
— P/E LTM of 12.8 and EV/EBITDA LTM of 6.1 are moderate for a company with a 31.8% return on equity
Attractiveness
Key figures, USD bn
| Metric | Q2 2025 | Q2 2026 | Change |
|---|---|---|---|
| Revenue | 9.12 | 13.8 | +51.8% |
| EBITDA | 2.37 | 5.02 | +111.9% |
| Operating profit | 0.99 | 3.82 | +286.7% |
| Net profit | 0.81 | 2.72 | +235.0% |
| Operating cash flow | 2.09 | 4.12 | +97.2% |
| EBITDA margin | 26.0% | 36.3% | +10.3 pp |
| Net margin | 8.9% | 19.6% | +10.7 pp |
Revenue rose 51.8% year on year, and almost all of that gain came from the oil price, not from volumes
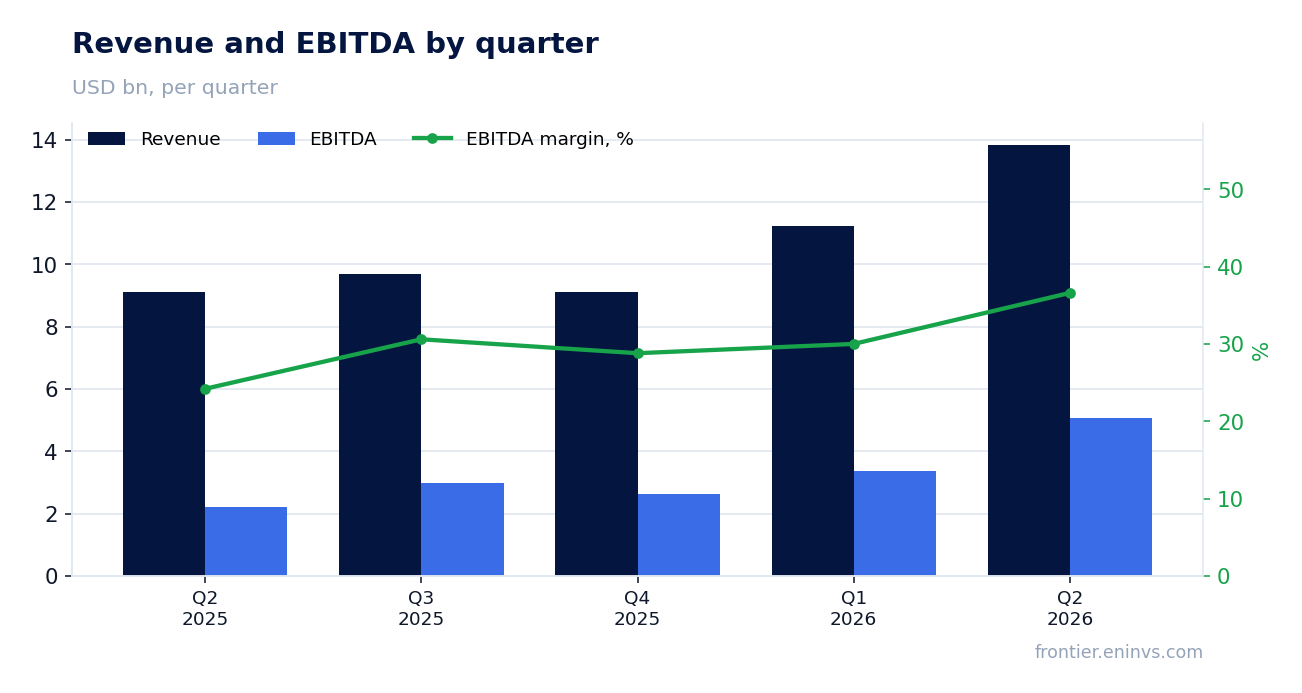
Revenue in the second quarter of 2026 was USD 13,845.8 mn against USD 9,123.8 mn a year earlier – growth of 51.8%. This is the highest quarterly level of the last four quarters: revenue was USD 11,233.1 mn in the first quarter, USD 9,112.3 mn in the fourth, and USD 9,707.7 mn in the third.
That jump is almost entirely explained by the oil price. The company does not disclose production or sales volumes in the data provided, so the price and volume factors cannot be separated. But revenue growth of 51.8% with a relatively stable business structure indicates that the price per barrel, not additional volumes, determined the quarter's result.
For a holder this means the top line remains hostage to the commodity cycle. If the oil price reverses, revenue can contract as quickly as it grew.
The EBITDA margin climbed to 36.3% from 26.0% – operating leverage worked on higher revenue
EBITDA in the second quarter of 2026 was USD 5,020.7 mn against USD 2,211.3 mn a year earlier, growth of 111.9%. The EBITDA margin rose to 36.3% from 26.0% in the second quarter of 2025.
Operating profit grew even faster – to USD 3,821.8 mn from USD 988.3 mn a year earlier. This means that revenue growth was almost unmatched by growth in operating costs: fixed expenses stayed at the same level, and every additional dollar of revenue fell to profit.
Net profit reached USD 2,718.3 mn, and the net margin was 19.6% against 8.9% a year earlier. Such a level of profitability for an oil company is possible only under favourable price conditions, and it is not sustainable in itself.
Net profit added 235.0%, but the year-ago base was low at USD 811.5 mn
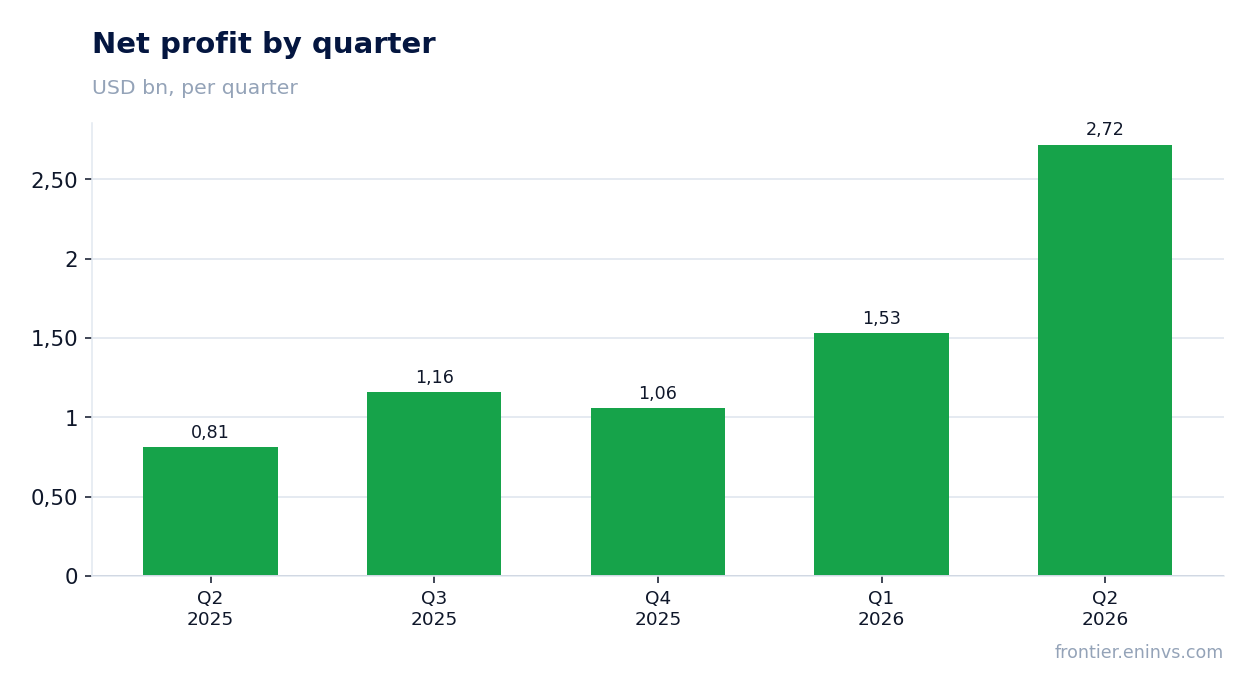
Net profit in the second quarter of 2026 was USD 2,718.3 mn against USD 811.5 mn a year earlier – growth of 235.0%. That percentage is largely explained by the low base: in the second quarter of 2025 profit was at a level the company usually exceeds.
For comparison: in the first quarter of 2026 profit was USD 1,529.6 mn, in the fourth quarter of 2025 – USD 1,056.3 mn, in the third – USD 1,158.6 mn. The current quarter is noticeably above all three previous ones, confirming the strength of the price factor.
Over the last twelve months net profit was USD 6,462.8 mn. This is a level that looks achievable next year at the current oil price, but could shrink several times over if prices fall.
Operating cash flow for the quarter was USD 4,119.0 mn, comfortably covering the dividend
Operating cash flow in the second quarter of 2026 was USD 4,119.0 mn against USD 2,089.0 mn a year earlier. This is the best quarterly result of the last four quarters: in the first quarter the flow was USD 1,773.6 mn, in the fourth – USD 2,806.0 mn, in the third – USD 2,708.7 mn.
Over the last twelve months operating cash flow was USD 11,407.4 mn. With a market capitalisation of USD 82,801.4 mn, this gives a cash flow to market cap ratio of about 13.8% – a high figure, which, however, also depends on the oil price.
There is no data on capital expenditure in the provided facts, so we do not cite free cash flow. But even without deducting capex, the quarterly flow of USD 4,119.0 mn significantly exceeds dividend payment needs.
Net debt fell from USD 5.0 bn to USD 3.3 bn, and net debt to EBITDA LTM stands at 0.23
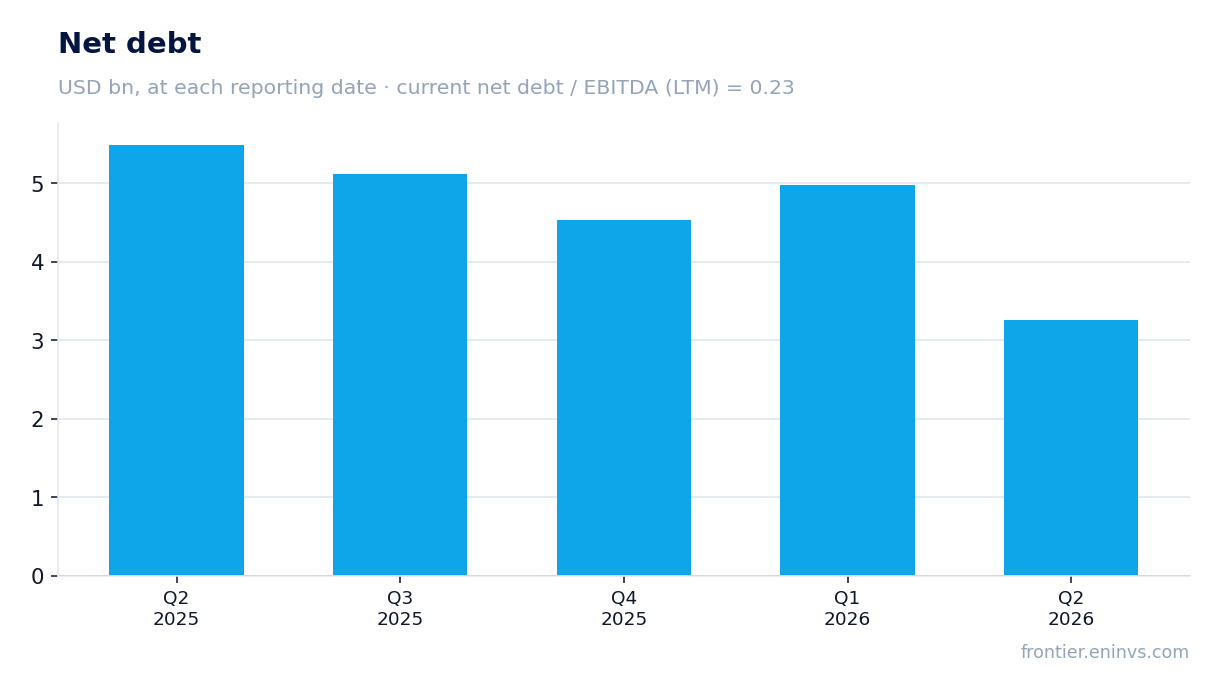
Net debt as of 30 June 2026 was USD 3.3 bn against USD 5.0 bn as of 31 March 2026 – a reduction of USD 1.7 bn over the quarter. Over twelve months, from 30 June 2025, net debt fell from USD 5.5 bn to USD 3.3 bn, i.e. by USD 2.2 bn.
The ratio of net debt to EBITDA over the last twelve months is 0.23. This is a low level: the company services its debt without strain, and even if EBITDA halved, the burden would remain moderate.
Debt reduction with high operating cash flow means that part of the profit goes to strengthening the balance sheet, not only to dividends. This reduces risk for the holder if conditions worsen.
The dividend yield of 1.9% is modest, and the payout depends on the same oil price
The dividend yield over the last twelve months is 1.9%. This is not a high level for an oil company: with a market capitalisation of USD 82,801.4 mn, the annual dividend flow is about USD 1.6 bn, which, against LTM net profit of USD 6,462.8 mn, gives a payout ratio of about 25%.
Our estimate of the dividend for 2026 assumes the current payout ratio is maintained and profit stays at the level of the last twelve months. If profit remains around USD 6.5 bn, the dividend could be about USD 1.6–1.7 bn, which at the current price gives a yield of about 2%. That is above the current 1.9%, but still modest compared to the yield on ten-year US Treasuries, which is not given in the facts.
The main risk to the dividend is a fall in the oil price. If EBITDA halves, profit could drop to a level at which the company cuts payments to preserve its balance sheet. However, low debt (0.23 to EBITDA LTM) provides a cushion: even with lower profit, the company can maintain the dividend at the current level.
P/E LTM of 12.8 and EV/EBITDA LTM of 6.1 are moderate for a company with a 31.8% return on equity
The P/E multiple over the last twelve months is 12.8, EV/EBITDA – 6.1. For a company generating a 31.8% return on equity, this is a moderate valuation: the market clearly prices in the cyclicality of profit and is not prepared to pay for the current level as if it were sustainable.
Comparing the current multiples with three-year averages is not possible from the provided facts – no historical values are given. But the level of P/E 12.8 for an oil company with low debt and high profitability looks rather attractive than neutral.
The valuation is fair as long as the oil price remains at the current level. If it falls, profit will shrink, and the P/E multiple will automatically rise even if the share price does not change. This is the main risk to the valuation.
Valuation on the latest reported figures
| Metric | Value |
|---|---|
| Market cap | 82.8 bn USD |
| P/E (LTM) | 12.8 |
| EV/EBITDA (LTM) | 6.1 |
| P/B | 2.56 |
| Net debt / EBITDA (LTM) | 0.23 |
| Operating cash flow (LTM) | 11.4 bn |
| ROE | 31.8% |
| Dividend yield (12m) | 1.9% |
Bottom line
Suncor Energy delivered a strong quarter: revenue rose 51.8%, EBITDA by 111.9%, net profit by 235.0%, and the EBITDA margin reached 36.3%. The company reduced net debt to USD 3.3 bn and keeps net debt to EBITDA at 0.23. However, this result is almost entirely driven by the oil price rather than by durable business expansion. At a P/E LTM of 12.8 and a dividend yield of 1.9%, the share looks rather attractive, but a holder should understand that profit and the dividend remain hostage to the commodity cycle.
Open the company's financial profile SU →
See also: market overview · valuation map · stock screeners