ZIM Integrated Shipping: revenue returns to growth, but profit still overshadowed by last year's one-off gain
25 августа ZIM Integrated Shipping раскрыла результаты за второй квартал 2026 года. Выручка выросла на 8,9% год к году до 1 780,7 млн долларов, EBITDA снизилась на 2,3% до 471,2 млн, а чистая прибыль подскочила на 178,5% до 63,5 млн долларов. При текущей цене акция выглядит скорее привлекательно: мультипликатор EV/EBITDA заметно ниже собственного трёхлетнего среднего, а модель портала даёт потенциал роста около 7%.
Key takeaways
— Revenue in Q2 2026 grew 8.9% YoY, the first increase in four quarters
— EBITDA in Q2 fell 2.3%, margin contracted to 27.5% from 30.7%
— Net profit rose 178.5%, but the base a year ago was low due to one-off factors
— Operating cash flow for the quarter was $394.6 million, capex only $11.6 million
— Net debt on the balance sheet is $4,675.6 million, ratio to EBITDA over 12 months is 0.83
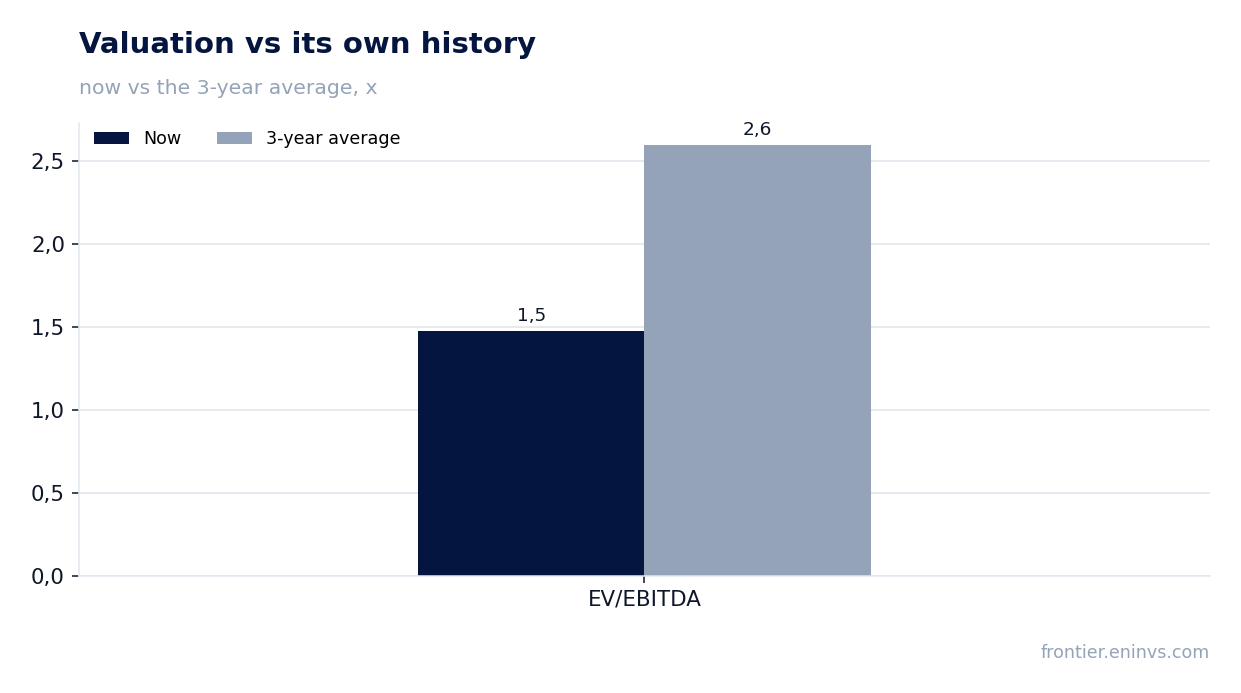
— EV/EBITDA for the trailing twelve months is 1.48, below the three-year average of 2.60
— The share is in the Global Commodities strategy on the portal, but that is not an argument for the verdict
Attractiveness
Key figures, USD bn
| Metric | Q2 2025 | Q2 2026 | Change |
|---|---|---|---|
| Revenue | 1.64 | 1.78 | +8.9% |
| EBITDA | 0.50 | 0.49 | -2.3% |
| Operating profit | 0.15 | 0.15 | -1.6% |
| Net profit | 0.02 | 0.06 | +178.5% |
| Operating cash flow | 0.44 | 0.39 | -10.6% |
| Capex | 0.02 | 0.01 | -52.5% |
| EBITDA margin | 30.7% | 27.5% | -3.2 pp |
| Net margin | 1.4% | 3.6% | +2.2 pp |
Revenue in Q2 2026 grew 8.9% YoY, the first increase in four quarters
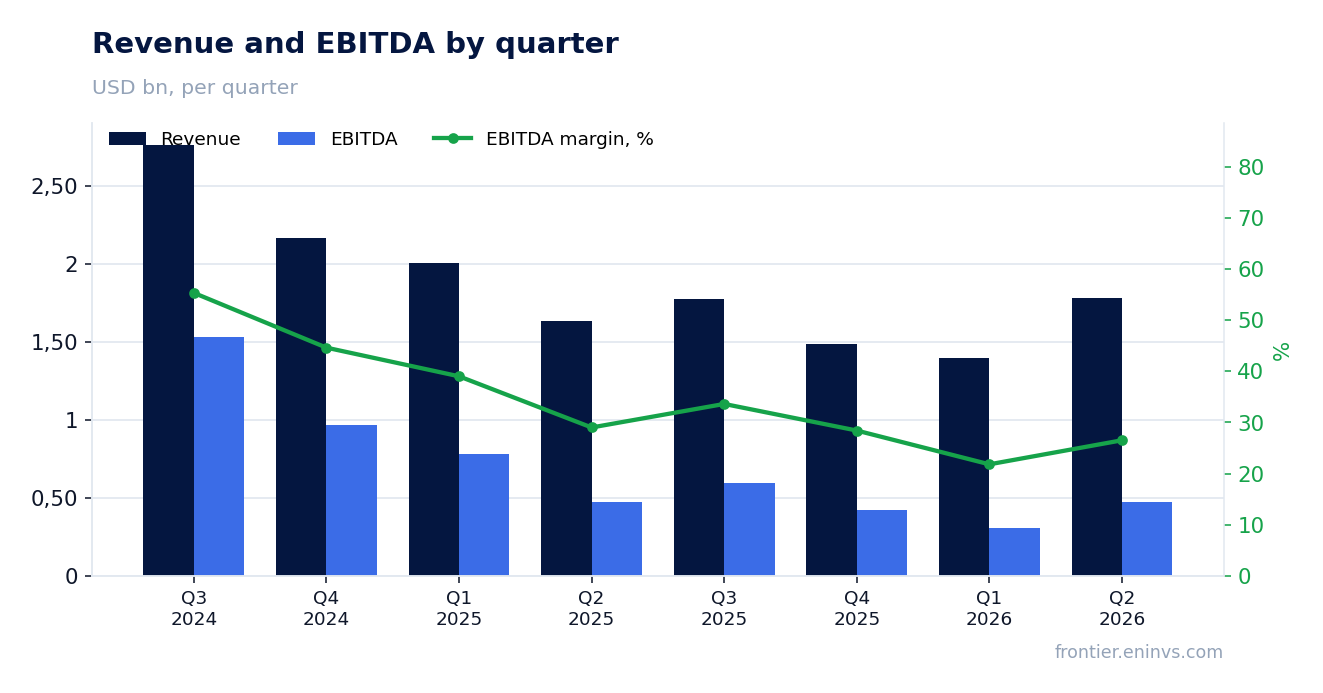
In Q2 2026, ZIM Integrated Shipping's revenue reached $1,780.7 million, up 8.9% year-on-year. This is the first positive annual growth rate after four quarters of decline: in Q3 2025 the drop was 35.7%, in Q4 31.5%, and in Q1 2026 30.4%.
The quarterly trend shows a turnaround: after a weak Q1 ($1,396.5 million), Q2 brought a marked acceleration. What exactly supported demand—freight rates or volumes—is not disclosed in the provided data, but the return to growth itself is significant after a prolonged downturn.
EBITDA in Q2 fell 2.3%, margin contracted to 27.5% from 30.7%
EBITDA for Q2 2026 was $471.2 million, down 2.3% year-on-year. EBITDA margin fell to 27.5% from 30.7% in the same quarter of 2025. Revenue growth is not yet translating into proportional operating profit growth.
Operating profit in Q2 rose to $149.2 million versus $151.7 million a year earlier—almost unchanged. This suggests that additional revenue is being absorbed by higher costs, though specific expense lines are not identified in the facts.
Net profit rose 178.5%, but the base a year ago was low due to one-off factors
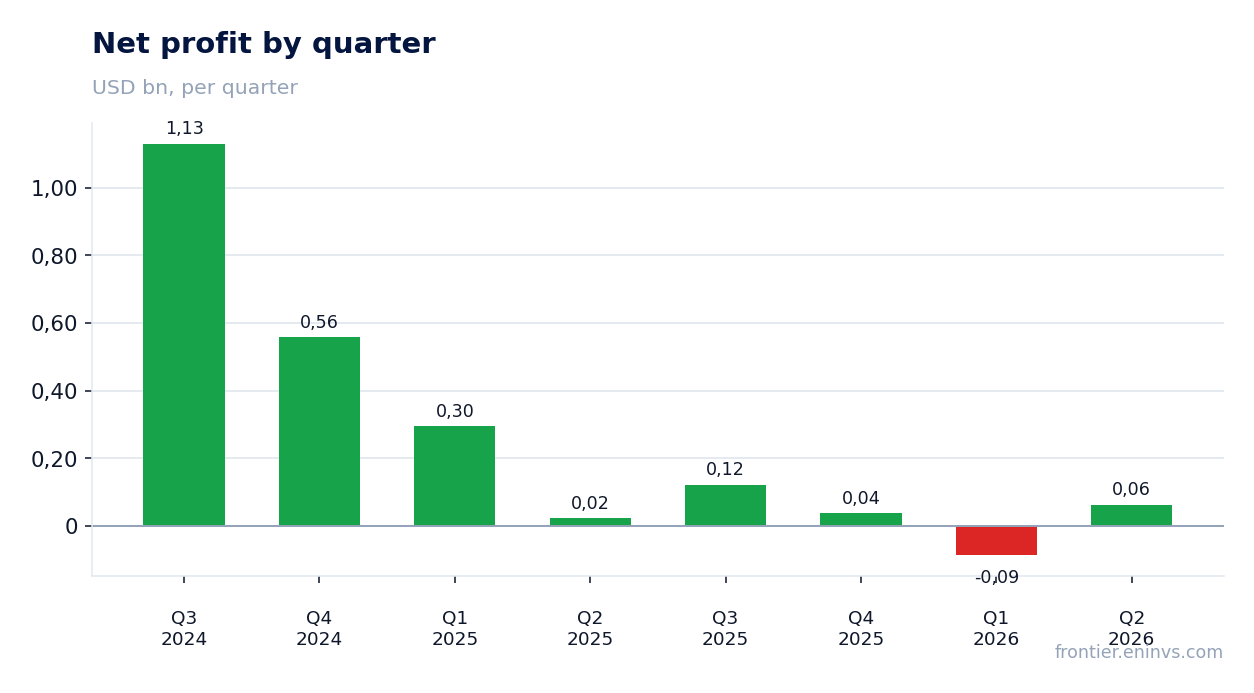
Net profit in Q2 2026 was $63.5 million versus $22.8 million a year earlier—up 178.5%. However, the prior-year quarter was weak: net margin then was only 1.4%, now it is 3.6%.
Importantly, in Q1 2026 the company posted a net loss of $86.0 million, so Q2 profitability only partially offsets the weak start to the year. Over the trailing twelve months, net profit was $138.6 million.
Operating cash flow for the quarter was $394.6 million, capex only $11.6 million
In Q2 2026, operating cash flow reached $394.6 million, while capex was only $11.6 million. This means the company is generating substantial free cash flow, which can be used for debt repayment or dividends.
Over the trailing twelve months, operating cash flow was $2,300.0 million. The low level of capex is typical for a shipping company that is not ordering new vessels in the current cycle.
Net debt on the balance sheet is $4,675.6 million, ratio to EBITDA over 12 months is 0.83
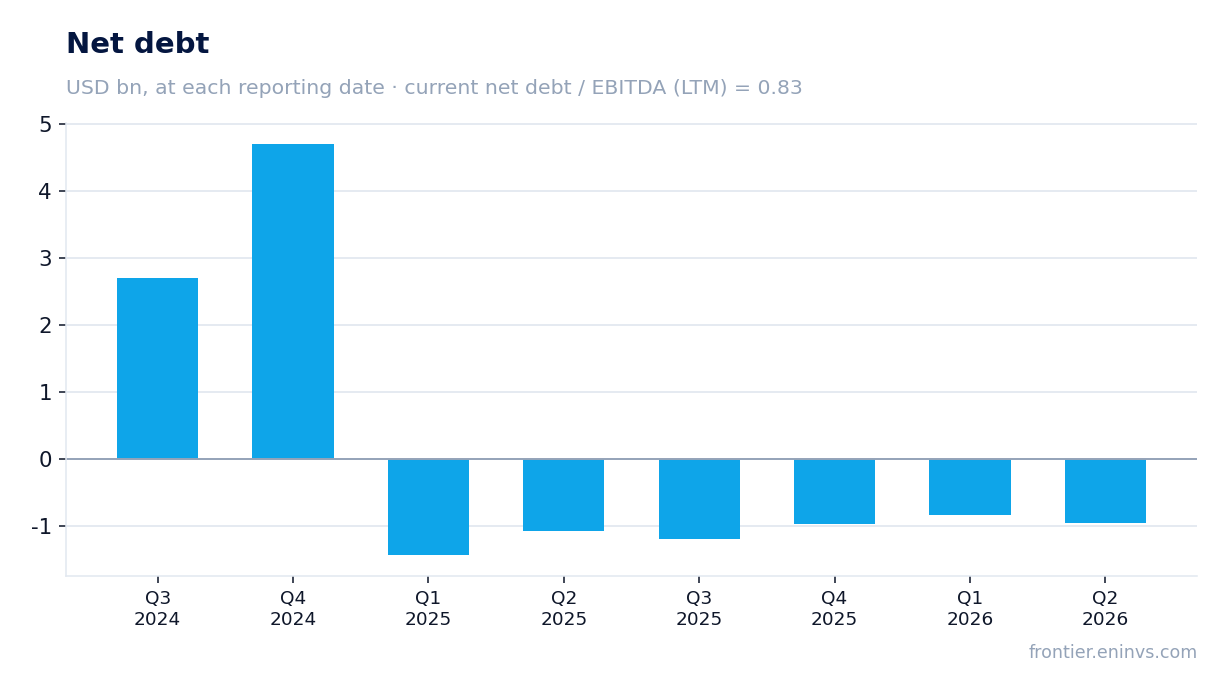
As of the latest balance sheet date, ZIM Integrated Shipping's net debt was $4,675.6 million. The ratio of net debt to EBITDA over the trailing twelve months is 0.83, a moderate level for the industry.
Over the past twelve months, net debt increased by RUB 5.4 billion (in ruble terms), but this change is not commented on in the context of financial leverage, as the previous ratio value is unknown.
EV/EBITDA for the trailing twelve months is 1.48, below the three-year average of 2.60
The current EV/EBITDA multiple is 1.48 versus the three-year average of 2.60. This means the share trades at a discount to its own history, which could indicate undervaluation if operating metrics stabilize.
The company's market capitalization is $3,605.8 million, and P/E over the trailing twelve months is 26.0. The low EV/EBITDA is explained by significant debt and relatively weak profitability, but compared to historical levels the valuation looks attractive.
The share is in the Global Commodities strategy on the portal, but that is not an argument for the verdict
ZIM Integrated Shipping is included in the Global Commodities (potential) strategy on our portal. This means the stock passes the strategy's screen, but membership itself is not a buy or sell recommendation.
Our portal's model, which re-prices EBITDA at current commodity prices at the target EV/EBITDA, shows upside potential of the share to its fair value of +7%. This is the model's own calculation, not a market consensus or a target price.
Valuation on the latest reported figures
| Metric | Value |
|---|---|
| Market cap | 3.61 bn USD |
| P/E (LTM) | 26.0 |
| EV/EBITDA (LTM) | 1.5 |
| P/B | 0.90 |
| Net debt / EBITDA (LTM) | 0.83 |
| Operating cash flow (LTM) | 2.30 bn |
| ROE | 6.6% |
| Dividend yield (12m) | 2.9% |
| EV/EBITDA, 3-year average | 2.6 |
Bottom line
In Q2 2026, ZIM Integrated Shipping showed the first year-on-year revenue growth in a year, a positive signal after a prolonged downturn. However, EBITDA and operating profit remained almost flat year-on-year, and net profit rose only due to a low base. The company generates strong operating cash flow with minimal capex, allowing it to service debt. The share's valuation is below its own three-year average on EV/EBITDA, and the portal's model gives moderate upside potential. At the current price, the share looks rather attractive, but the sustainability of revenue recovery and margins will be the key question for holders.
Open the company's financial profile ZIM →
See also: market overview · valuation map · stock screeners