ZIM Integrated Shipping: freight rates up 62%, yet revenue trailed the price-implied level by 6% – profit rests on price, not volume
Contents
ZIM Integrated Shipping reported results for the third quarter of 2026. The average Freightos Baltic Index rate in the period was 3626 USD versus 2234 USD a year earlier (+62.4%), with spot at 3504 USD on 20 November. At the year-ago volumes and non-commodity costs, moving only prices, our calculation implies revenue of 2885.4 million dollars and EBITDA of 1611.5 million; the company actually reported revenue of 2712.0 million (–6.0% versus the implied level) and EBITDA of 1513.0 million (–6.1%). Our conclusion: rather attractive – the portal model puts the upside to fair value at +35%. Our view: the share is rather attractive at the current price; upside on the portal model +35%.
Our view: is there upside
Our view in numbers
| Metric | Our read |
|---|---|
| Verdict | Rather attractive |
| Upside on the portal model | +35% |
| How the model works | spot model: EBITDA re-priced to current commodity prices at the target EV/EBITDA, against market cap |
| EV/EBITDA now and 3-year average | 0.7 vs 1.4 – a 50% discount to its history |
| Dividend yield, 12m | 3.0% |
| Net debt / EBITDA | -0.64 – net cash |
| Strongest case for | LTM EV/EBITDA of 0.7 is half its own three-year average of 1.4, and at current freight prices it is 0.4, implying +35% upside on the portal model. |
| Strongest case against | Revenue trailed the price-implied level by 6.0%, and spot is already 3.4% below the reported-period average – a return to 2284 USD would nearly halve EBITDA. |
| What would change the view | If the average freight rate holds above 3500 USD next quarter, the verdict rises to 'attractive'; a fall below 2500 USD lowers it to 'neutral'. |
Key takeaways
— Freight rates rose 62.4% year on year, and that alone explains almost all of the revenue increase
— Revenue and EBITDA trailed the price-implied level by 6%, and the gap points to volumes or a realised rate below the benchmark
— The EBITDA margin climbed to 55.8% from 35.3% – freight prices are rising faster than fuel costs
— Net profit of 829.9 million dollars grew 6.7-fold, but part of that gain is a low base effect from last year
— Net cash of 1720.6 million dollars and net debt to EBITDA of –0.64 – the balance sheet can withstand any rate decline
— At current prices, the portal spot model puts EBITDA at 4831.1 million dollars – 75.2% above LTM – and EV/EBITDA falls to 0.4
— A dividend yield of 2.97% is modest for shipping, but the payout is tied to profit, not to debt
Key figures, USD bn
| Metric | Q3 2025 | Q3 2026 | Change |
|---|---|---|---|
| Revenue | 1.78 | 2.71 | +52.6% |
| EBITDA | 0.63 | 1.51 | +141.5% |
| Operating profit | 0.26 | 1.15 | +337.6% |
| Net profit | 0.12 | 0.83 | +574.7% |
| Operating cash flow | 0.63 | 1.24 | +97.4% |
| Capex | 0.07 | -0.02 | -127.5% |
| EBITDA margin | 35.3% | 55.8% | +20.5 pp |
| Net margin | 6.9% | 30.6% | +23.7 pp |
Freight rates rose 62.4% year on year, and that alone explains almost all of the revenue increase
The average Freightos Baltic Index rate in the third quarter of 2026 was 3626 USD versus 2234 USD a year earlier – up 62.4%. Against the previous quarter the rate added 58.8% (from 2284 USD). Spot on 20 November stands at 3504 USD, just 3.4% below the reported-period average, so the price backdrop has not deteriorated.
Revenue for the quarter was 2712.0 million dollars, 52.6% above the year-ago level. That is an acceleration from growth of 8.9% in the second quarter of 2026. Almost all of the revenue increase came from price: volumes are not disclosed in the facts, but our calculation shows that at unchanged volumes the rate alone would have produced revenue of 2885.4 million dollars.
The gap between actual revenue and the price-implied level is 173.4 million dollars, or 6.0%. That means either volumes were below last year's or the realised average rate was below the benchmark. The facts do not allow us to separate these causes, so we record the gap itself.
Commodity prices: period average and now
| Benchmark | Year ago | Q3 2026 | YoY | Spot 2026-11-20 |
|---|---|---|---|---|
| Freightos Baltic Index, USD | 2 234 | 3 626 | +62,4% | 3 504 |
| VLSFO America (input cost), USD | 605,2 | 839,6 | +38,7% | 889,5 |
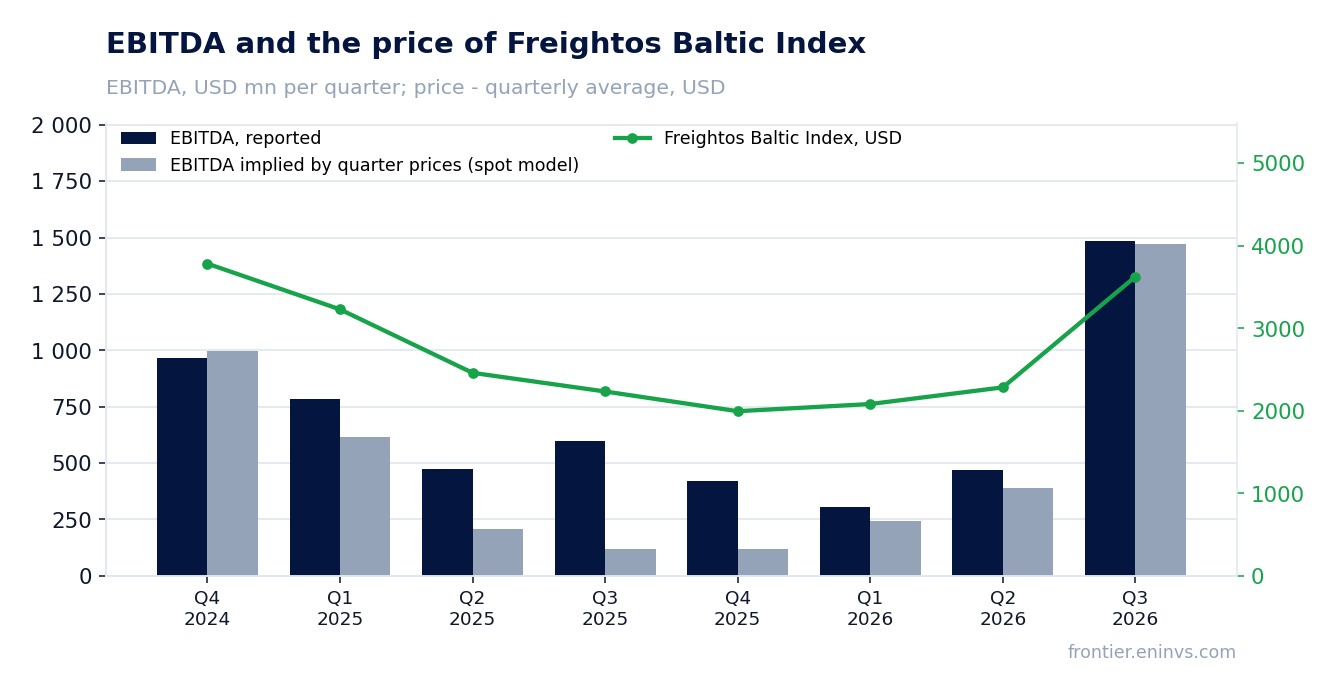
Revenue and EBITDA trailed the price-implied level by 6%, and the gap points to volumes or a realised rate below the benchmark
At the volumes and non-commodity costs of the third quarter of 2025, moving only prices, our calculation puts EBITDA at 1611.5 million dollars. Actual EBITDA was 1513.0 million, 98.5 million, or 6.1%, lower. The gap almost matches the revenue shortfall, which makes sense: at such a high margin most of the revenue deviation flows into EBITDA.
The price-implied figure also includes higher fuel costs: VLSFO America rose 38.7% year on year to 839.6 USD, which our calculation shows added 123.2 million dollars to costs. So the 62.4% rate increase more than offset the fuel increase, and that is what produced the record margin.
The portal spot model, built from the average of the previous four quarters, expected EBITDA of 1471.2 million dollars and revenue of 2684.2 million. Actual figures beat that estimate by 2.8% and 1.0% respectively. But that model is a run-rate view, not a peak-quarter view; the divergence from the year-ago calculation is because the model's base includes weak quarters.
What the prices implied and what the company earned
| Base (Q3 2025) | Implied at period prices | Reported | Reported vs implied | |
|---|---|---|---|---|
| Revenue, USD mn | 1 777 | 2 885 | 2 712 | -6,0% |
| EBITDA, USD mn | 626,5 | 1 612 | 1 513 | -6,1% |
| EBITDA, portal spot model, USD mn | — | 1 471 | 1 513 | +2,8% |
Revenue and EBITDA by quarter
| Period | Measure | bn USD |
|---|---|---|
| Q4 2024 | Revenue | 2.1675999999999997 |
| Q1 2025 | Revenue | 2.0065999999999997 |
| Q2 2025 | Revenue | 1.6357000000000002 |
| Q3 2025 | Revenue | 1.7772000000000001 |
| Q4 2025 | Revenue | 1.4847000000000001 |
| Q1 2026 | Revenue | 1.3965 |
| Q2 2026 | Revenue | 1.7807 |
| Q3 2026 | Revenue | 2.712 |
| Q4 2024 | EBITDA | 0.9665 |
| Q1 2025 | EBITDA | 0.7826 |
| Q2 2025 | EBITDA | 0.4748 |
| Q3 2025 | EBITDA | 0.5962999999999999 |
| Q4 2025 | EBITDA | 0.4213 |
| Q1 2026 | EBITDA | 0.3043 |
| Q2 2026 | EBITDA | 0.4712 |
| Q3 2026 | EBITDA | 1.4867000000000001 |
EBITDA margin
| Period | Measure | % |
|---|---|---|
| Q4 2024 | EBITDA margin | 44.6 |
| Q1 2025 | EBITDA margin | 39.0 |
| Q2 2025 | EBITDA margin | 29.0 |
| Q3 2025 | EBITDA margin | 33.6 |
| Q4 2025 | EBITDA margin | 28.4 |
| Q1 2026 | EBITDA margin | 21.8 |
| Q2 2026 | EBITDA margin | 26.5 |
| Q3 2026 | EBITDA margin | 54.8 |
The EBITDA margin climbed to 55.8% from 35.3% – freight prices are rising faster than fuel costs
EBITDA for the third quarter of 2026 was 1513.0 million dollars, 141.5% above the year-ago level. The EBITDA margin reached 55.8% versus 35.3% a year earlier. Such a margin increase is a direct consequence of freight rates rising 62.4% while fuel rose only 38.7%.
Operating profit was 1153.2 million dollars. On revenue of 2712.0 million, that implies operating costs including fuel of about 1559 million dollars. A year earlier, on revenue of 1777.2 million and EBITDA of 596.3 million, operating costs were about 1181 million. Costs rising 32% against revenue growth of 52.6% is what widened the margin.
Net profit reached 829.9 million dollars, with a net margin of 30.6% versus 6.9% a year earlier. The 6.7-fold profit increase is explained not only by higher EBITDA but also by a low base effect: in the third quarter of 2025 profit was only 123.0 million dollars.
Net profit of 829.9 million dollars grew 6.7-fold, but part of that gain is a low base effect from last year
Net profit growth of 574.7% year on year looks impressive, but the base was low: in the third quarter of 2025 the company earned 123.0 million dollars on revenue of 1777.2 million. If profit a year earlier had been at the level of the second quarter of 2026 (63.5 million), growth would have been even larger, but the current result of 829.9 million remains exceptionally strong.
Profit is also supported by low debt: net cash of 1720.6 million dollars means the company pays no significant interest and earns income on cash. This distinguishes the current cycle from previous ones when debt consumed part of operating profit.
The facts do not provide data on one-off items, so we cannot isolate what part of profit is related to derivative revaluation or asset sales. But the scale of profit – 30.6% of revenue – suggests that the bulk was earned from operations, not paper gains.
Net cash of 1720.6 million dollars and net debt to EBITDA of –0.64 – the balance sheet can withstand any rate decline
At the end of the third quarter of 2026 the company had net cash of 1720.6 million dollars. Net debt to LTM EBITDA is –0.64, meaning debt is negative. This is a level that creates no risks even if freight rates fall.
Operating cash flow for the quarter was 1240.5 million dollars, almost matching EBITDA. Capital expenditure was negative – –18.5 million, meaning the company received more from asset sales than it spent on investment. Free cash flow therefore exceeded 1250 million dollars.
Over the last twelve months operating cash flow was 2272.9 million dollars. Against a market capitalisation of 3569.7 million, that means the company generates cash flow equal to almost two-thirds of its value in a year. Such a balance sheet allows it to raise dividends, buy back shares, or ride out a downturn without debt pressure.
Valuation vs its own history
now vs the 3-year average
| Period | Measure | × |
|---|---|---|
| EV/EBITDA | Now | 0.6890551874343208 |
| EV/EBITDA | 3-year average | 1.3717047808429592 |
At current prices, the portal spot model puts EBITDA at 4831.1 million dollars – 75.2% above LTM – and EV/EBITDA falls to 0.4
The portal spot model recalculates EBITDA at current freight and fuel prices. At a rate of 3504 USD and VLSFO of 889.5 USD, annual EBITDA is estimated at 4831.1 million dollars versus LTM of 2756.7 million – up 75.2%. That means if current prices persist, the company will earn almost twice its average over the last twelve months.
At such EBITDA, EV/EBITDA falls to 0.4, and net debt to EBITDA becomes –0.36. For comparison, LTM EV/EBITDA is 0.7, already 50% below its own three-year average of 1.4. So the stock trades at half its historical multiple, and at a quarter of it on current prices.
A market capitalisation of 3569.7 million dollars with net cash of 1720.6 million means investors value the operating business at just 1849 million dollars. Against LTM EBITDA of 2756.7 million, that is less than one year's cash flow. Such a valuation implies the market expects a sharp fall in rates, but current spot does not confirm that.
Share price, three years
close, last point 2026-11-19
| Period | Measure | USD per share |
|---|---|---|
| 2025-11-20 | Closing price | 16.75 |
| 2025-11-21 | Closing price | 16.899999618530273 |
| 2025-11-24 | Closing price | 17.170000076293945 |
| 2025-11-25 | Closing price | 19.510000228881836 |
| 2025-11-26 | Closing price | 19.700000762939453 |
| 2025-11-28 | Closing price | 20.40999984741211 |
| 2025-12-01 | Closing price | 19.299999237060547 |
| 2025-12-02 | Closing price | 19.600000381469727 |
| 2025-12-03 | Closing price | 19.8700008392334 |
| 2025-12-04 | Closing price | 20.399999618530273 |
| 2025-12-05 | Closing price | 20.030000686645508 |
| 2025-12-08 | Closing price | 20.079999923706055 |
| 2025-12-09 | Closing price | 19.8700008392334 |
| 2025-12-10 | Closing price | 19.84000015258789 |
| 2025-12-11 | Closing price | 19.829999923706055 |
| 2025-12-12 | Closing price | 18.760000228881836 |
| 2025-12-15 | Closing price | 20.399999618530273 |
| 2025-12-16 | Closing price | 20.020000457763672 |
| 2025-12-17 | Closing price | 19.559999465942383 |
| 2025-12-18 | Closing price | 19.25 |
| 2025-12-19 | Closing price | 19.239999771118164 |
| 2025-12-22 | Closing price | 19.8799991607666 |
| 2025-12-23 | Closing price | 21.030000686645508 |
| 2025-12-24 | Closing price | 21.06999969482422 |
| 2025-12-26 | Closing price | 21.350000381469727 |
| 2025-12-29 | Closing price | 21.209999084472656 |
| 2025-12-30 | Closing price | 21.010000228881836 |
| 2025-12-31 | Closing price | 21.229999542236328 |
| 2026-01-02 | Closing price | 21.90999984741211 |
| 2026-01-05 | Closing price | 20.920000076293945 |
| 2026-01-06 | Closing price | 22.299999237060547 |
| 2026-01-07 | Closing price | 22.350000381469727 |
| 2026-01-08 | Closing price | 22.5 |
| 2026-01-09 | Closing price | 22.399999618530273 |
| 2026-01-12 | Closing price | 23.270000457763672 |
| 2026-01-13 | Closing price | 21.56999969482422 |
| 2026-01-14 | Closing price | 22.729999542236328 |
| 2026-01-15 | Closing price | 22.700000762939453 |
| 2026-01-16 | Closing price | 21.360000610351562 |
| 2026-01-20 | Closing price | 21.530000686645508 |
| 2026-01-21 | Closing price | 22.469999313354492 |
| 2026-01-22 | Closing price | 22.059999465942383 |
| 2026-01-23 | Closing price | 22.100000381469727 |
| 2026-01-26 | Closing price | 22.959999084472656 |
| 2026-01-27 | Closing price | 22.719999313354492 |
| 2026-01-28 | Closing price | 23.239999771118164 |
| 2026-01-29 | Closing price | 23.18000030517578 |
| 2026-01-30 | Closing price | 22.030000686645508 |
| 2026-02-02 | Closing price | 22.43000030517578 |
| 2026-02-03 | Closing price | 21.760000228881836 |
| 2026-02-04 | Closing price | 21.530000686645508 |
| 2026-02-05 | Closing price | 20.329999923706055 |
| 2026-02-06 | Closing price | 20.68000030517578 |
| 2026-02-09 | Closing price | 21.219999313354492 |
| 2026-02-10 | Closing price | 20.729999542236328 |
| 2026-02-11 | Closing price | 21.139999389648438 |
| 2026-02-12 | Closing price | 21.18000030517578 |
| 2026-02-13 | Closing price | 22.200000762939453 |
| 2026-02-17 | Closing price | 27.850000381469727 |
| 2026-02-18 | Closing price | 29.030000686645508 |
| 2026-02-19 | Closing price | 29.18000030517578 |
| 2026-02-20 | Closing price | 29.270000457763672 |
| 2026-02-23 | Closing price | 28.65999984741211 |
| 2026-02-24 | Closing price | 29.079999923706055 |
| 2026-02-25 | Closing price | 29.200000762939453 |
| 2026-02-26 | Closing price | 28.860000610351562 |
| 2026-02-27 | Closing price | 28.829999923706055 |
| 2026-03-02 | Closing price | 28.829999923706055 |
| 2026-03-03 | Closing price | 27.90999984741211 |
| 2026-03-04 | Closing price | 28.850000381469727 |
| 2026-03-05 | Closing price | 28.440000534057617 |
| 2026-03-06 | Closing price | 27.809999465942383 |
| 2026-03-09 | Closing price | 29.110000610351562 |
| 2026-03-10 | Closing price | 28.920000076293945 |
| 2026-03-11 | Closing price | 28.06999969482422 |
| 2026-03-12 | Closing price | 27.200000762939453 |
| 2026-03-13 | Closing price | 26.989999771118164 |
| 2026-03-16 | Closing price | 26.719999313354492 |
| 2026-03-17 | Closing price | 27.40999984741211 |
| 2026-03-18 | Closing price | 27.139999389648438 |
| 2026-03-19 | Closing price | 26.959999084472656 |
| 2026-03-20 | Closing price | 25.8799991607666 |
| 2026-03-23 | Closing price | 25.920000076293945 |
| 2026-03-24 | Closing price | 26.459999084472656 |
| 2026-03-25 | Closing price | 26.440000534057617 |
| 2026-03-26 | Closing price | 26.25 |
| 2026-03-27 | Closing price | 26.190000534057617 |
| 2026-03-30 | Closing price | 25.8799991607666 |
| 2026-03-31 | Closing price | 26.350000381469727 |
| 2026-04-01 | Closing price | 25.950000762939453 |
| 2026-04-02 | Closing price | 26.299999237060547 |
| 2026-04-06 | Closing price | 26.299999237060547 |
| 2026-04-07 | Closing price | 26.299999237060547 |
| 2026-04-08 | Closing price | 26.450000762939453 |
| 2026-04-09 | Closing price | 26.399999618530273 |
| 2026-04-10 | Closing price | 26.389999389648438 |
| 2026-04-13 | Closing price | 26.530000686645508 |
| 2026-04-14 | Closing price | 26.389999389648438 |
| 2026-04-15 | Closing price | 26.700000762939453 |
| 2026-04-16 | Closing price | 26.950000762939453 |
| 2026-04-17 | Closing price | 27.010000228881836 |
| 2026-04-20 | Closing price | 26.559999465942383 |
| 2026-04-21 | Closing price | 26.239999771118164 |
| 2026-04-22 | Closing price | 26.40999984741211 |
| 2026-04-23 | Closing price | 26.079999923706055 |
| 2026-04-24 | Closing price | 25.93000030517578 |
| 2026-04-27 | Closing price | 26.09000015258789 |
| 2026-04-28 | Closing price | 26.049999237060547 |
| 2026-04-29 | Closing price | 26.010000228881836 |
| 2026-04-30 | Closing price | 26.440000534057617 |
| 2026-05-01 | Closing price | 26.280000686645508 |
| 2026-05-04 | Closing price | 26.06999969482422 |
| 2026-05-05 | Closing price | 28.549999237060547 |
| 2026-05-06 | Closing price | 27.84000015258789 |
| 2026-05-07 | Closing price | 26.09000015258789 |
| 2026-05-08 | Closing price | 26.610000610351562 |
| 2026-05-11 | Closing price | 26.469999313354492 |
| 2026-05-12 | Closing price | 25.75 |
| 2026-05-13 | Closing price | 25.75 |
| 2026-05-14 | Closing price | 25.68000030517578 |
| 2026-05-15 | Closing price | 25.56999969482422 |
| 2026-05-18 | Closing price | 25.639999389648438 |
| 2026-05-19 | Closing price | 25.549999237060547 |
| 2026-05-20 | Closing price | 25.15999984741211 |
| 2026-05-21 | Closing price | 25.139999389648438 |
| 2026-05-22 | Closing price | 25.239999771118164 |
| 2026-05-26 | Closing price | 25.25 |
| 2026-05-27 | Closing price | 25.139999389648438 |
| 2026-05-28 | Closing price | 24.190000534057617 |
| 2026-05-29 | Closing price | 23.489999771118164 |
| 2026-06-01 | Closing price | 24.719999313354492 |
| 2026-06-02 | Closing price | 25.209999084472656 |
| 2026-06-03 | Closing price | 24.5 |
| 2026-06-04 | Closing price | 25.450000762939453 |
| 2026-06-05 | Closing price | 25.239999771118164 |
| 2026-06-08 | Closing price | 25.559999465942383 |
| 2026-06-09 | Closing price | 25.5 |
| 2026-06-10 | Closing price | 25.329999923706055 |
| 2026-06-11 | Closing price | 25.90999984741211 |
| 2026-06-12 | Closing price | 26.229999542236328 |
| 2026-06-15 | Closing price | 24.920000076293945 |
| 2026-06-16 | Closing price | 24.459999084472656 |
| 2026-06-17 | Closing price | 23.979999542236328 |
| 2026-06-18 | Closing price | 24.34000015258789 |
| 2026-06-22 | Closing price | 25.270000457763672 |
| 2026-06-23 | Closing price | 25.43000030517578 |
| 2026-06-24 | Closing price | 25.579999923706055 |
| 2026-06-25 | Closing price | 25.799999237060547 |
| 2026-06-26 | Closing price | 25.579999923706055 |
| 2026-06-29 | Closing price | 25.90999984741211 |
| 2026-06-30 | Closing price | 26.0 |
| 2026-07-01 | Closing price | 25.229999542236328 |
| 2026-07-02 | Closing price | 25.56999969482422 |
| 2026-07-06 | Closing price | 23.709999084472656 |
| 2026-07-07 | Closing price | 23.920000076293945 |
| 2026-07-08 | Closing price | 24.600000381469727 |
| 2026-07-09 | Closing price | 24.139999389648438 |
| 2026-07-10 | Closing price | 23.969999313354492 |
| 2026-07-13 | Closing price | 23.799999237060547 |
| 2026-07-14 | Closing price | 24.399999618530273 |
| 2026-07-15 | Closing price | 24.799999237060547 |
| 2026-07-16 | Closing price | 24.510000228881836 |
| 2026-07-17 | Closing price | 24.299999237060547 |
| 2026-07-20 | Closing price | 24.309999465942383 |
| 2026-07-21 | Closing price | 24.920000076293945 |
| 2026-07-22 | Closing price | 25.010000228881836 |
| 2026-07-23 | Closing price | 25.59000015258789 |
| 2026-07-24 | Closing price | 24.899999618530273 |
| 2026-07-27 | Closing price | 24.559999465942383 |
| 2026-07-28 | Closing price | 24.030000686645508 |
| 2026-07-29 | Closing price | 24.579999923706055 |
| 2026-07-30 | Closing price | 24.729999542236328 |
| 2026-07-31 | Closing price | 25.190000534057617 |
| 2026-08-03 | Closing price | 26.06999969482422 |
| 2026-08-04 | Closing price | 27.290000915527344 |
| 2026-08-05 | Closing price | 26.579999923706055 |
| 2026-08-06 | Closing price | 26.3799991607666 |
| 2026-08-07 | Closing price | 26.899999618530273 |
| 2026-08-10 | Closing price | 25.209999084472656 |
| 2026-08-11 | Closing price | 24.530000686645508 |
| 2026-08-12 | Closing price | 25.270000457763672 |
| 2026-08-13 | Closing price | 26.81999969482422 |
| 2026-08-14 | Closing price | 28.139999389648438 |
| 2026-08-17 | Closing price | 28.809999465942383 |
| 2026-08-18 | Closing price | 28.489999771118164 |
| 2026-08-19 | Closing price | 27.40999984741211 |
| 2026-08-20 | Closing price | 27.15999984741211 |
| 2026-08-21 | Closing price | 28.25 |
| 2026-08-24 | Closing price | 28.3799991607666 |
| 2026-08-25 | Closing price | 28.079999923706055 |
| 2026-08-26 | Closing price | 27.639999389648438 |
| 2026-08-27 | Closing price | 27.920000076293945 |
| 2026-08-28 | Closing price | 27.440000534057617 |
| 2026-08-31 | Closing price | 27.399999618530273 |
| 2026-09-01 | Closing price | 27.010000228881836 |
| 2026-09-02 | Closing price | 28.020000457763672 |
| 2026-09-03 | Closing price | 27.59000015258789 |
| 2026-09-04 | Closing price | 28.579999923706055 |
| 2026-09-08 | Closing price | 30.079999923706055 |
| 2026-09-09 | Closing price | 29.3799991607666 |
| 2026-09-10 | Closing price | 29.469999313354492 |
| 2026-09-11 | Closing price | 29.56999969482422 |
| 2026-09-14 | Closing price | 29.719999313354492 |
| 2026-09-15 | Closing price | 29.56999969482422 |
| 2026-09-16 | Closing price | 29.329999923706055 |
| 2026-09-17 | Closing price | 30.360000610351562 |
| 2026-09-18 | Closing price | 30.100000381469727 |
| 2026-09-21 | Closing price | 30.459999084472656 |
| 2026-09-22 | Closing price | 30.510000228881836 |
| 2026-09-23 | Closing price | 30.09000015258789 |
| 2026-09-24 | Closing price | 29.3799991607666 |
| 2026-09-25 | Closing price | 29.190000534057617 |
| 2026-09-28 | Closing price | 28.389999389648438 |
| 2026-09-29 | Closing price | 28.75 |
| 2026-09-30 | Closing price | 29.31999969482422 |
| 2026-10-01 | Closing price | 29.75 |
| 2026-10-02 | Closing price | 29.6299991607666 |
| 2026-10-05 | Closing price | 28.93000030517578 |
| 2026-10-06 | Closing price | 29.200000762939453 |
| 2026-10-07 | Closing price | 29.989999771118164 |
| 2026-10-08 | Closing price | 30.260000228881836 |
| 2026-10-09 | Closing price | 29.989999771118164 |
| 2026-10-12 | Closing price | 30.899999618530273 |
| 2026-10-13 | Closing price | 30.43000030517578 |
| 2026-10-14 | Closing price | 29.84000015258789 |
| 2026-10-15 | Closing price | 29.540000915527344 |
| 2026-10-16 | Closing price | 29.209999084472656 |
| 2026-10-19 | Closing price | 28.979999542236328 |
| 2026-10-20 | Closing price | 29.139999389648438 |
| 2026-10-21 | Closing price | 29.149999618530273 |
| 2026-10-22 | Closing price | 29.079999923706055 |
| 2026-10-23 | Closing price | 29.350000381469727 |
| 2026-10-26 | Closing price | 29.540000915527344 |
| 2026-10-27 | Closing price | 29.729999542236328 |
| 2026-10-28 | Closing price | 29.65999984741211 |
| 2026-10-29 | Closing price | 29.239999771118164 |
| 2026-10-30 | Closing price | 28.3799991607666 |
| 2026-11-02 | Closing price | 28.350000381469727 |
| 2026-11-03 | Closing price | 29.299999237060547 |
| 2026-11-04 | Closing price | 28.40999984741211 |
| 2026-11-05 | Closing price | 27.43000030517578 |
| 2026-11-06 | Closing price | 27.950000762939453 |
| 2026-11-09 | Closing price | 28.510000228881836 |
| 2026-11-10 | Closing price | 28.100000381469727 |
| 2026-11-11 | Closing price | 29.010000228881836 |
| 2026-11-12 | Closing price | 29.239999771118164 |
| 2026-11-13 | Closing price | 29.34000015258789 |
| 2026-11-16 | Closing price | 29.110000610351562 |
| 2026-11-17 | Closing price | 29.690000534057617 |
| 2026-11-18 | Closing price | 29.920000076293945 |
| 2026-11-19 | Closing price | 29.6200008392334 |
A dividend yield of 2.97% is modest for shipping, but the payout is tied to profit, not to debt
The dividend yield over the last twelve months is 2.97%. That is lower than one might expect from a company with net cash and LTM profit of 845.5 million dollars. But the company's policy, judging by actual payments, is tied to quarterly profit rather than free cash flow.
Our estimate: if current freight rates persist, annual profit could be around 3.3 billion dollars (based on EBITDA of 4831.1 million and the current margin). If the company pays out 20–30% of profit, the yield on the current price could reach 18–27%. This is our estimate, not company guidance; it depends on the dividend policy, which the facts do not disclose.
What could reduce the payout: freight rates falling below 2500 USD, fuel rising above 1000 USD, or one-off write-downs. But net cash of 1720.6 million dollars provides a buffer: even at zero profit the company could pay dividends from accumulated funds. So the risk of a dividend cancellation is low.
Valuation on the latest reported figures
| Metric | Value |
|---|---|
| Market cap | 3.57 bn USD |
| P/E (LTM) | 4.2 |
| EV/EBITDA (LTM) | 0.7 |
| P/B | 0.88 |
| Net debt / EBITDA (LTM) | -0.64 |
| Operating cash flow (LTM) | 2.27 bn |
| ROE | 77.4% |
| Dividend yield (12m) | 3.0% |
| EV/EBITDA, 3-year average | 1.4 |
Net profit by quarter
| Period | Measure | bn USD |
|---|---|---|
| Q4 2024 | Net profit | 0.5588 |
| Q1 2025 | Net profit | 0.2953 |
| Q2 2025 | Net profit | 0.0228 |
| Q3 2025 | Net profit | 0.123 |
| Q4 2025 | Net profit | 0.0381 |
| Q1 2026 | Net profit | −0.086 |
| Q2 2026 | Net profit | 0.0635 |
| Q3 2026 | Net profit | 0.8299 |
Bottom line
A strong quarter: revenue rose 52.6%, EBITDA – 141.5%, the margin reached 55.8%, and net cash of 1720.6 million dollars makes the balance sheet impregnable. But part of the success is a low base effect from last year, and the 6% shortfall versus the price-implied level suggests not all of the rate opportunity was captured. The key question for a holder is whether freight rates hold at the current 3504 USD, because at that level spot-model EBITDA is 4831.1 million and EV/EBITDA is 0.4. If rates hold, the stock looks undervalued. Our conclusion: rather attractive – the portal model implies +35% upside. Our view: the share is rather attractive at the current price; upside on the portal model +35%.