CCBN: H1 profit fell 15.9% even as net interest income rose 12.5%

CCBN's H1 2026 report showed a divergence: net interest income rose 12.5% year on year to KZT 236,546 million, while net profit fell 15.9% to KZT 123,057 million. The reason is that net profit as a share of net interest income dropped to 52.0% from 69.5% a year earlier, meaning costs are growing faster than income. At the same time, the stock trades at a P/E LTM of 3.82 with ROE of 26.3%, and the portal's model puts upside to fair value at +26%. Given the cheap valuation and high return on equity, but deteriorating conversion of revenue into profit, the share looks rather attractive.
Key takeaways
— H1 2026 net interest income rose 12.5% to KZT 236,546 million, but profit fell 15.9%
— Net profit as a share of net interest income dropped to 52.0% from 69.5% – costs are eating into growing revenue
— H1 EBITDA added only 2.8%, and its margin fell to 116.4% from 127.3%
— P/E LTM 3.82 and ROE 26.3% – valuation remains low despite high return on equity
— The portal's model puts upside to fair value at +26%
— The stock is held in the portal's live model strategies, including KZ Fundamental potential (AI)
Attractiveness
Key figures, KZT bn
| Metric | H1 2025 | H1 2026 | Change |
|---|---|---|---|
| Net interest income | 210 | 237 | +12.5% |
| EBITDA | 268 | 275 | +2.8% |
| Operating profit | 268 | 275 | +2.8% |
| Net profit | 146 | 123 | -15.9% |
| EBITDA margin | 127.3% | 116.4% | -10.9 pp |
| Net margin | 69.5% | 52.0% | -17.5 pp |
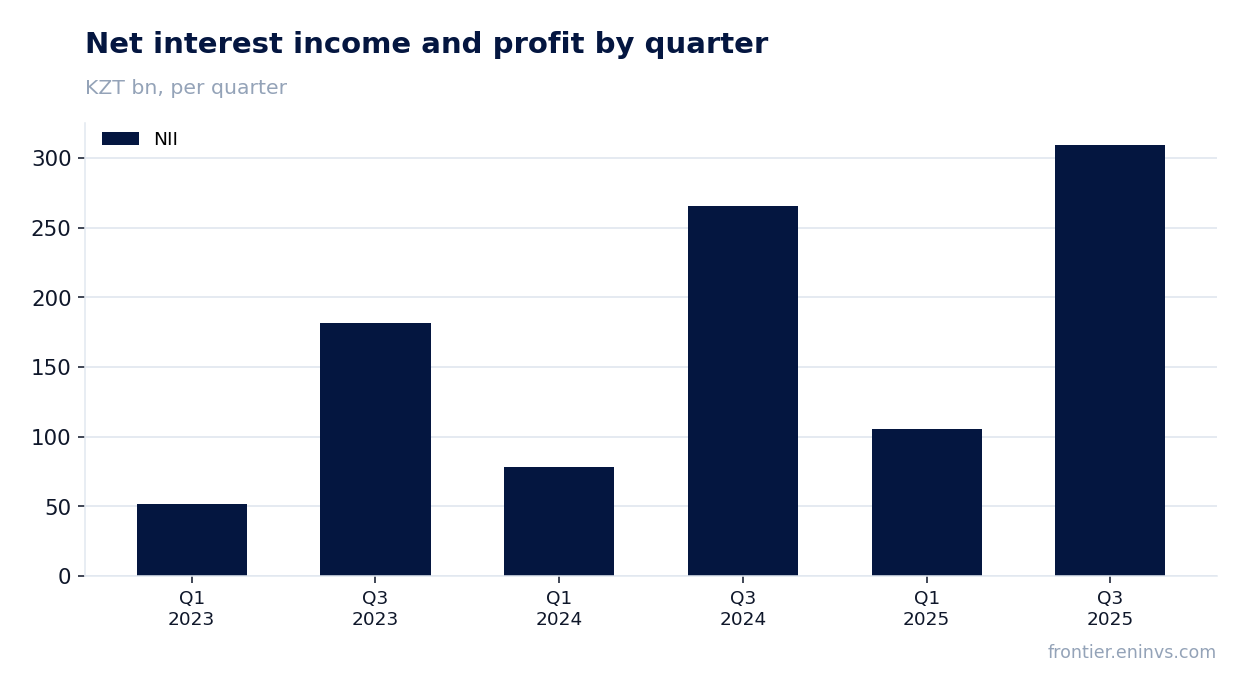
H1 2026 net interest income rose 12.5% to KZT 236,546 million, but profit fell 15.9%
In H1 2026, CCBN's net interest income reached KZT 236,546 million, up 12.5% year on year. This is the bank's main revenue source, and its growth indicates that the loan portfolio and placement rates remain favourable.
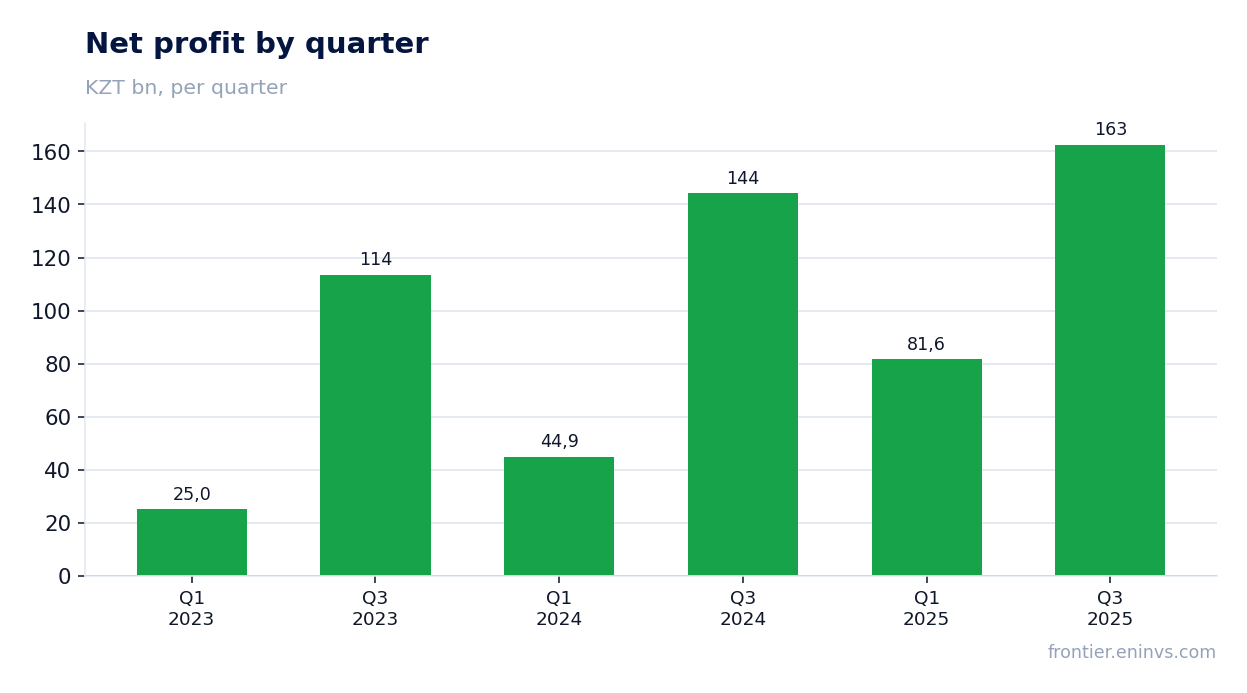
However, net profit for the same period fell 15.9% to KZT 123,057 million. The gap between revenue and profit dynamics means that costs – operating, provisioning, or interest – grew faster than income. The report does not disclose the specific line item responsible, but the ratio of net profit to net interest income dropped to 52.0% from 69.5% a year earlier.
For a shareholder, this is the key point: the bank is growing net interest income, but the conversion of that income into net profit has worsened. If this trend persists, profit may continue to lag revenue even if the top line grows.
Net profit as a share of net interest income dropped to 52.0% from 69.5% – costs are eating into growing revenue
The ratio of net profit to net interest income in H1 2026 was 52.0%, compared with 69.5% a year earlier. This is not a margin or profitability measure, but an indicator of how much of net interest income reaches net profit after all costs.
A drop of 17.5 percentage points is significant. It explains why net profit fell 15.9% despite a 12.5% increase in net interest income. The causes could include higher operating expenses, increased provisioning, or lower non-interest income, but the provided facts lack detail.
For assessing the bank's stability, this metric matters more than absolute profit: it shows the efficiency of converting interest income. If it does not recover in the next report, the market may revise profit expectations downward despite revenue growth.
H1 EBITDA added only 2.8%, and its margin fell to 116.4% from 127.3%
H1 2026 EBITDA was KZT 275,358 million, up only 2.8% year on year. This is significantly slower than the growth in net interest income, confirming pressure on costs.
EBITDA margin – the ratio of EBITDA to net interest income – fell to 116.4% from 127.3% a year earlier. For a bank, a value above 100% means other operating income exceeds operating expenses, but its contribution has shrunk.
The slowdown in EBITDA to 2.8% amid 12.5% growth in net interest income indicates that cost growth is outpacing revenue growth. This is a key risk for profit in future periods.
P/E LTM 3.82 and ROE 26.3% – valuation remains low despite high return on equity
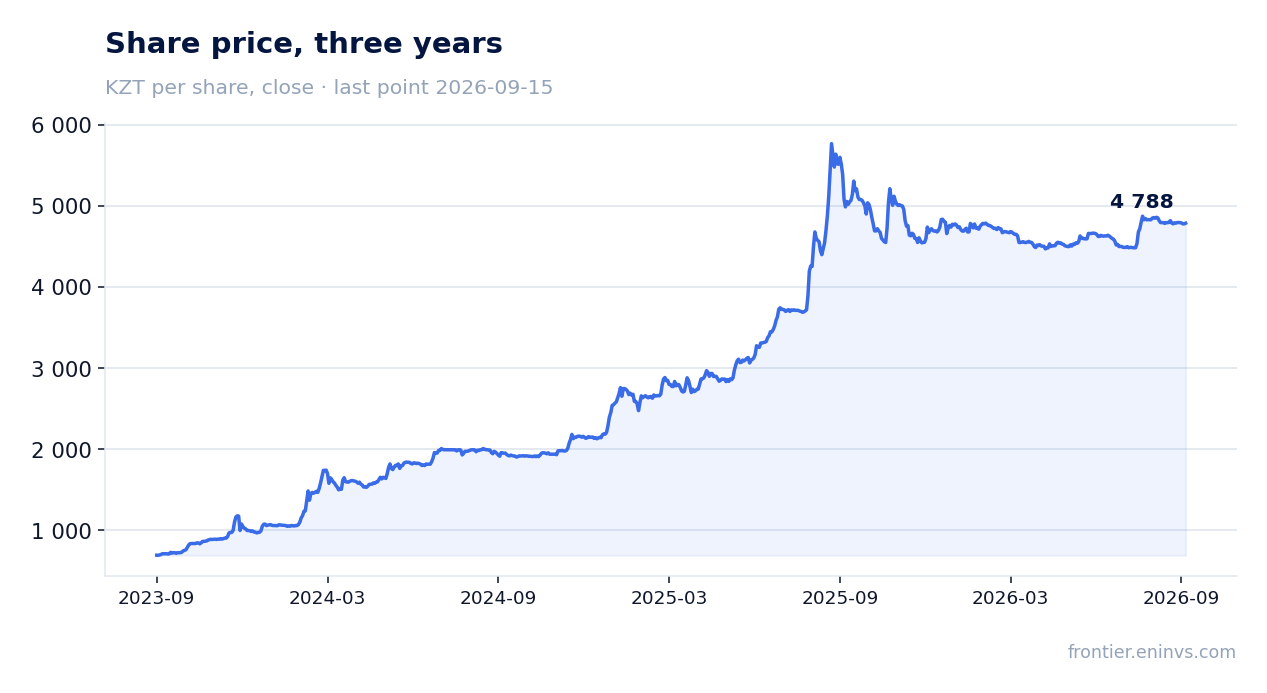
Based on the trailing twelve months, CCBN's P/E is 3.82, and return on equity (ROE) is 26.3%. Market capitalisation is KZT 841,666 million. This combination of a low multiple and high profitability is typical of undervalued bank stocks.
For comparison, the FACTS do not include historical P/E values over three years, so it is impossible to say whether the current multiple is above or below its own history. However, an absolute level of 3.82 looks low for a bank with ROE above 20%.
If profit stabilises, the current valuation could prove an attractive entry point. But the profit decline in H1 2026 signals that the market is pricing in the risk of further deterioration.
The portal's model puts upside to fair value at +26%
According to the portal's model, which compares ROE to P/B, the upside to fair value for CCBN is estimated at +26%. This is our own estimate, not a market consensus or a target price.
The model relies on the current return on equity and book value. If ROE remains near 26.3% and profit does not continue to fall, the stock could realise this upside.
However, the model does not account for potential asset quality deterioration or further cost growth. Therefore, +26% is a guideline under current trends, not a guarantee.
The stock is held in the portal's live model strategies, including KZ Fundamental potential (AI)
CCBN is held in the portal's live model strategies, including KZ Fundamental potential (AI). This is a fact, not an argument for the verdict: each strategy follows its own screen.
Being in the strategies means the stock passed formal selection criteria, but it does not replace fundamental analysis. Each investor makes their own buy or sell decision.
Valuation on the latest reported figures
| Metric | Value |
|---|---|
| Market cap | 842 bn KZT |
| P/E (LTM) | 3.8 |
| P/B | 0.99 |
| ROE | 26.3% |
Bottom line
Bottom line: CCBN grew net interest income by 12.5% in H1 2026, but net profit fell 15.9% due to a sharp drop in net profit as a share of net interest income – to 52.0% from 69.5%. EBITDA rose only 2.8%, and its margin declined. At the same time, valuation remains low: P/E LTM 3.82, ROE 26.3%, and the portal's model shows +26% upside. The question for a holder now is whether this cost pressure is temporary or a sustained deterioration in efficiency. If profit stabilises, the current price looks attractive; if the decline continues, even a low multiple will not protect.
Open the company's financial profile CCBN →
See also: market overview · valuation map · stock screeners