CISCO SYSTEMS, INC.: revenue accelerated to +17.6%, but profit grew faster than sales — and that is the key question for the report

On 25 July 2026, CISCO SYSTEMS, INC. released its results for the fourth quarter of 2026. Revenue came in at 17,252.0 million dollars, up 17.6% year on year, an acceleration from +12.0% in the third quarter. EBITDA added 14.8%, to 4,274.0 million, net profit rose 51.3%, to 3,859.0 million, and the net margin climbed to 22.4% from 17.4%. At the same time, the EBITDA margin slipped to 24.8% from 25.4%, and net debt as of 25 July 2026 stood at 23,967.0 million — the rise in debt and the faster growth of profit than sales require explanation. In our view, the share looks rather attractive: revenue is accelerating, profit is growing faster than sales, and the portal's model puts the upside to fair value at +11%.
Key takeaways
— Revenue accelerated to +17.6% year on year, but the growth was not purely organic — the report gives no breakdown, which limits confidence
— Net profit rose 51.3% and the net margin climbed to 22.4% from 17.4% — such a jump almost certainly contains a one-off element that is not disclosed
— The EBITDA margin slipped to 24.8% from 25.4%, which diverges from the rise in the net margin — meaning profit was supported by items below the operating line
— Net debt rose to 24.0 billion dollars from 16.4 billion a quarter earlier, and the net debt to EBITDA LTM ratio stands at 1.46 — the debt level is growing faster than the business
— Operating cash flow for the quarter was 5,386.0 million with capital expenditure of 390.0 million — cash conversion remains strong
— The trailing twelve-month dividend yield is 1.56%, which is modest both against the key rate and against the company's own yield history
— EV/EBITDA LTM of 27.1 times versus its own three-year average of 23.3 times — the stock trades above its own history, which limits the upside
Attractiveness
Key figures, USD bn
| Metric | Q4 2025 | Q4 2026 | Change |
|---|---|---|---|
| Revenue | 14.7 | 17.3 | +17.6% |
| EBITDA | 3.72 | 4.27 | +14.8% |
| Operating profit | 3.12 | 4.26 | +36.6% |
| Net profit | 2.55 | 3.86 | +51.3% |
| Operating cash flow | 4.23 | 5.39 | +27.2% |
| Capex | 0.22 | 0.39 | +79.7% |
| EBITDA margin | 25.4% | 24.8% | -0.6 pp |
| Net margin | 17.4% | 22.4% | +5.0 pp |
Revenue accelerated to +17.6% year on year, but the growth was not purely organic — the report gives no breakdown, which limits confidence
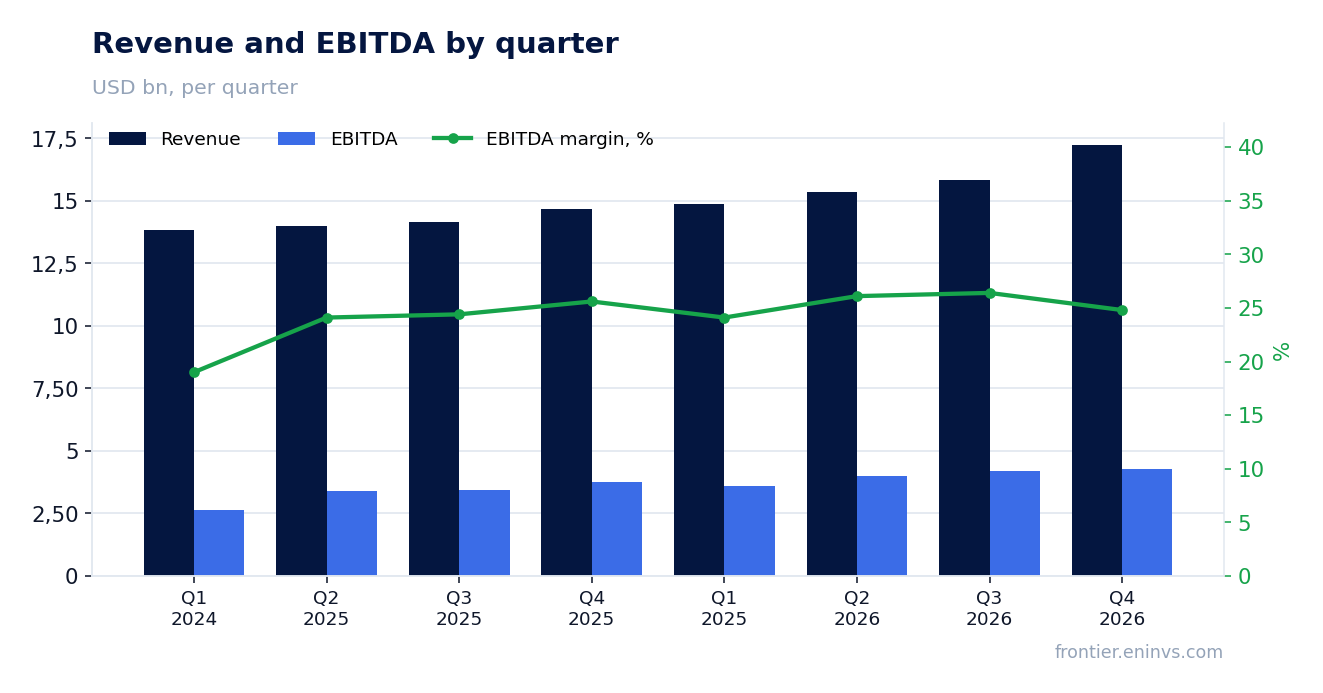
Revenue for the fourth quarter of 2026 was 17,252.0 million dollars, up 17.6% from the same quarter a year earlier. This is a marked acceleration from +12.0% in the third quarter of 2026 and +9.7% in the second. The company does not disclose how much of the increase came from organic demand versus acquisitions or one-off contracts, so the sustainability of the acceleration remains an open question.
For comparison: in the fourth quarter of 2025 revenue grew only 7.6%, and in the first quarter of 2025 it grew 7.5%. The current pace is more than double last year's, and that is the main positive shift in the report. Without segment detail, however, it is impossible to judge how repeatable it will be next quarter.
Net profit rose 51.3% and the net margin climbed to 22.4% from 17.4% — such a jump almost certainly contains a one-off element that is not disclosed
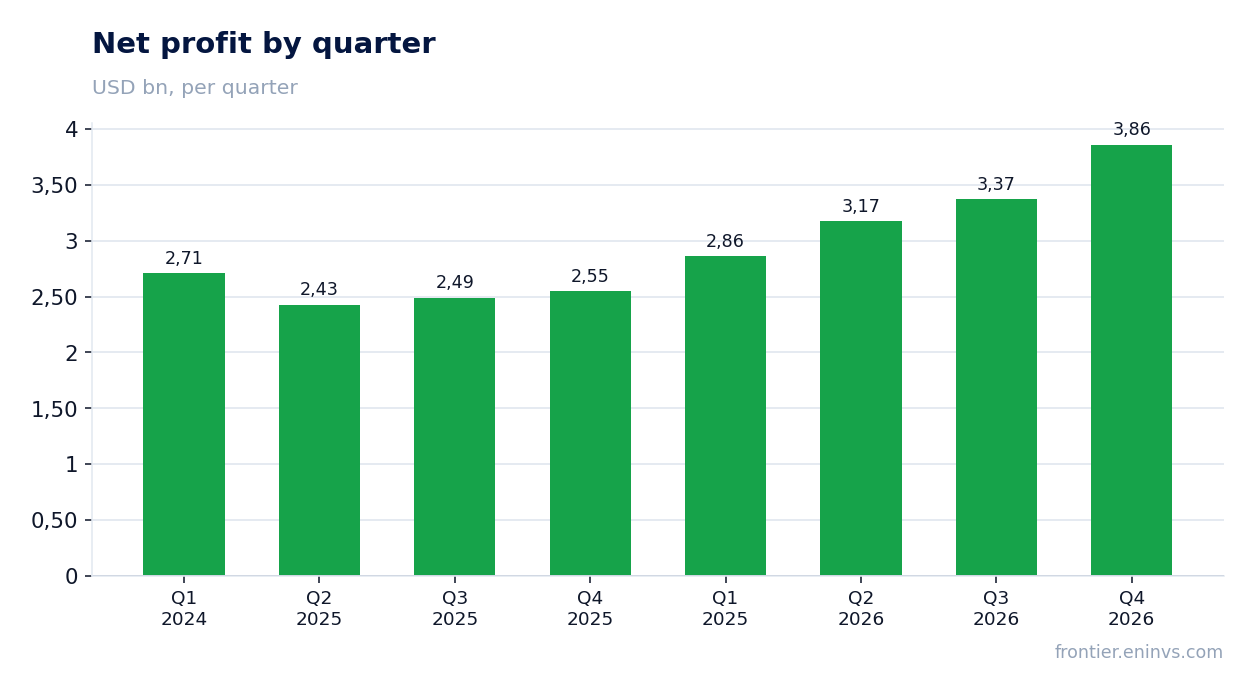
Net profit for the fourth quarter of 2026 was 3,859.0 million dollars, up 51.3% year on year. The net margin rose to 22.4% from 17.4% — a 5 percentage point increase while revenue added 17.6%. Such outperformance of profit versus revenue usually means either a one-off gain, a lower effective tax rate, or a boost from financial operations.
The report provides no breakdown that would explain this gap. Operating profit rose to 4,264.0 million and EBITDA to 4,274.0 million, so operating dynamics were far more modest than net profit. This points to the main contribution to the profit jump coming from below the operating line. Without disclosure of the source, the sustainability of this net margin level is questionable.
The EBITDA margin slipped to 24.8% from 25.4%, which diverges from the rise in the net margin — meaning profit was supported by items below the operating line
The EBITDA margin in the fourth quarter of 2026 was 24.8% versus 25.4% a year earlier. A 0.6 percentage point decline with revenue up 17.6% means costs grew faster than sales. The company does not disclose which cost line produced this effect, so no specific cause can be named.
At the same time, the net margin rose to 22.4% from 17.4%. The divergence between the EBITDA margin and the net margin is the key anomaly of the report. It confirms that the improvement in net profit was not the result of operating efficiency but came from items below operating profit. For assessing the sustainability of the business, the operating margin matters more, and it declined.
Net debt rose to 24.0 billion dollars from 16.4 billion a quarter earlier, and the net debt to EBITDA LTM ratio stands at 1.46 — the debt level is growing faster than the business
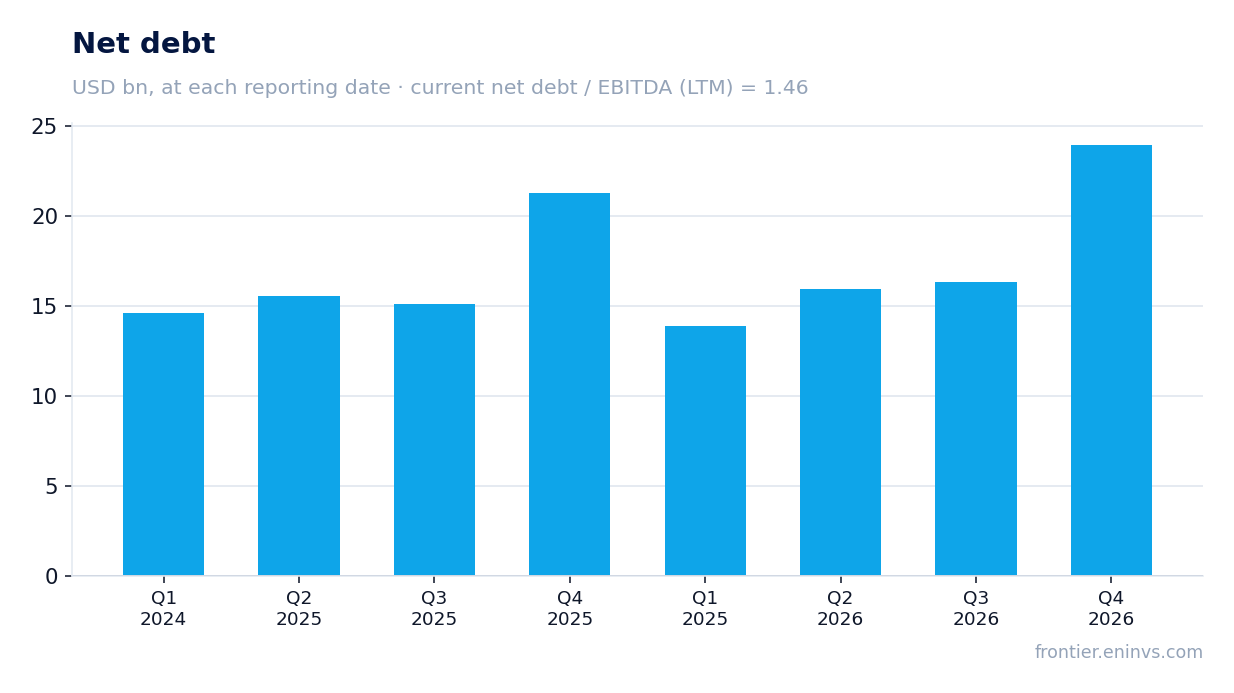
Net debt as of 25 July 2026 was 23,967.0 million dollars. That is 7.6 billion more than on 25 April 2026, when it stood at 16.4 billion. Over twelve months, from 26 July 2025, net debt rose by 2.7 billion — from 21.3 billion to 24.0 billion. The quarterly increase far exceeds the annual one, indicating a large investment or payout during the reporting period.
The ratio of net debt to EBITDA for the trailing twelve months is 1.46. That is a moderate level, but it is calculated on LTM EBITDA of 16,389.6 million. The company does not disclose what the borrowed funds were used for, so it is impossible to say whether the investment will pay off. What matters is that debt is growing faster than EBITDA: over the quarter EBITDA added about 2%, while net debt rose more than 45%.
Operating cash flow for the quarter was 5,386.0 million with capital expenditure of 390.0 million — cash conversion remains strong
Operating cash flow for the fourth quarter of 2026 was 5,386.0 million dollars, and capital expenditure was 390.0 million. Free cash flow therefore exceeds 4,900 million, covering both dividends and the increase in debt. The company retains a strong ability to generate cash from profit.
For comparison: in the third quarter of 2026 operating cash flow was 3,757.0 million with capital expenditure of 414.0 million. The quarter-on-quarter increase in operating cash flow is significant and points to a strong year-end. However, the 7.6 billion increase in debt during the quarter is not explained by capital expenditure — which remains small relative to revenue.
The trailing twelve-month dividend yield is 1.56%, which is modest both against the key rate and against the company's own yield history
The dividend yield over the trailing twelve months is 1.56%. The company does not disclose the size of the latest declared dividend or the payout ratio, so it is impossible to estimate what the dividend for the current year will be. Our estimate can rely only on historical yield, which remains low.
With net profit of 13,267.0 million over the trailing twelve months and a market capitalisation of 419,440.07 million, a yield of 1.56% corresponds to an annual payout of about 6.5 billion. That is a moderate share of profit, and the company has room to increase payments. However, without a dividend policy, one cannot assert that the payout will grow.
For an income-oriented investor, such a yield is unlikely to compensate for the risk associated with rising debt. The dividend here is more a supplement to the growth story than a standalone argument. What could make the payout smaller: further growth in capital expenditure or the need to service the increased debt.
EV/EBITDA LTM of 27.1 times versus its own three-year average of 23.3 times — the stock trades above its own history, which limits the upside
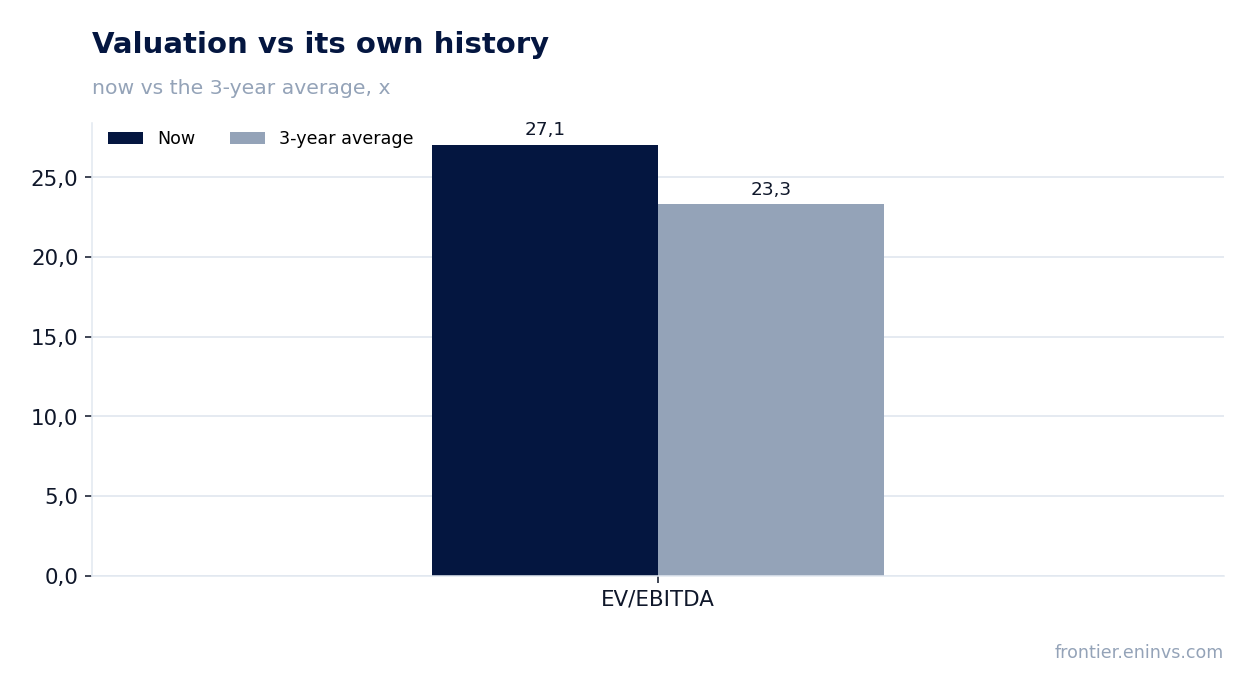
EV/EBITDA for the trailing twelve months is 27.1 times, while its own three-year average is 23.3 times. The stock trades above its own history, meaning the market already prices in significant growth. The P/E LTM is 31.6, also indicating a premium valuation.
The portal's model values the share at 11% above the current price. This is our own calculation, based on EBITDA growth and a target multiple. It assumes the current profit growth is sustainable, but as shown above, a significant part of the quarterly net profit growth may have been one-off.
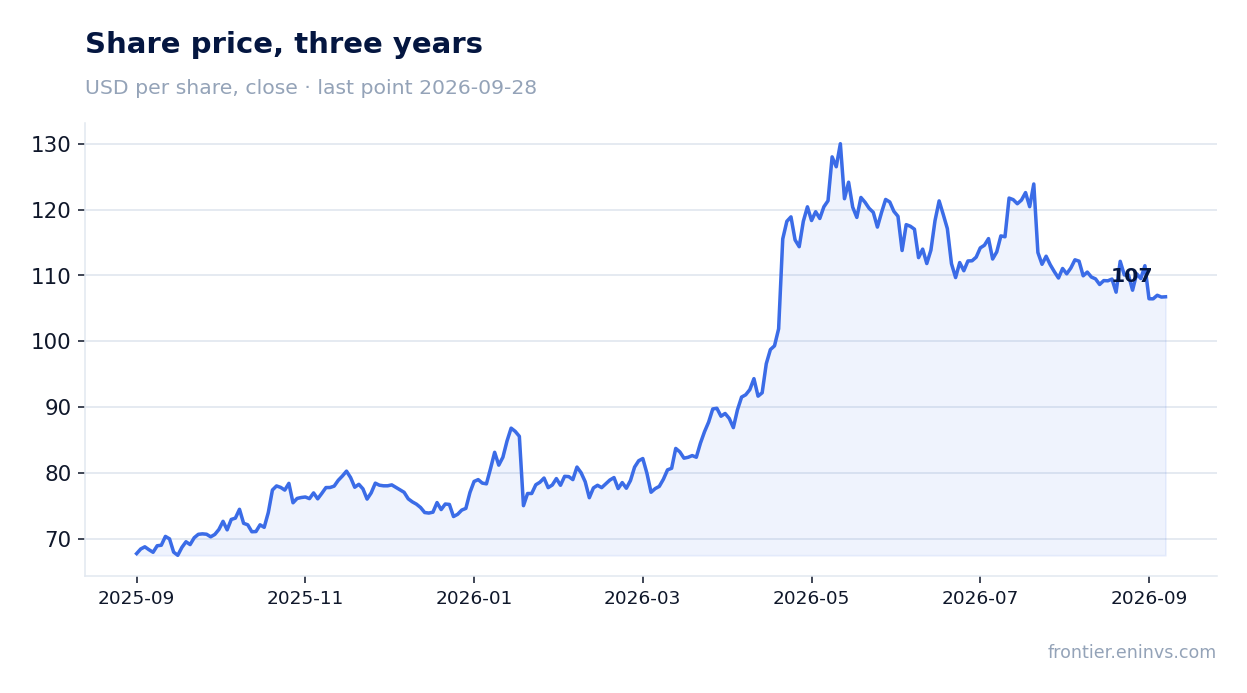
After the report, the share added 2.9% on the release day, but from then until 28 September 2026 it lost 11.4%. The market quickly reassessed the sustainability of profit. At a valuation above its historical average, further gains require confirmed operating progress, not one-off factors.
Valuation on the latest reported figures
| Metric | Value |
|---|---|
| Market cap | 419 bn USD |
| P/E (LTM) | 31.6 |
| EV/EBITDA (LTM) | 27.1 |
| P/B | 8.34 |
| Net debt / EBITDA (LTM) | 1.46 |
| Operating cash flow (LTM) | 14.2 bn |
| ROE | 30.7% |
| Dividend yield (12m) | 1.6% |
| EV/EBITDA, 3-year average | 23.3 |
Bottom line
The strong points of the report are the acceleration of revenue to +17.6% and a powerful operating cash flow of 5,386.0 million with capital expenditure of only 390.0 million. However, net profit growth of 51.3% while the EBITDA margin fell to 24.8% from 25.4% suggests that a significant part of the profit is one-off. Net debt rose to 24.0 billion from 16.4 billion in a quarter, and this requires an explanation that the report does not provide. The valuation above its own three-year average — EV/EBITDA of 27.1 times versus 23.3 times — limits the upside. The question for a holder now is whether the company can confirm operating momentum without one-off factors, and what the borrowed funds were used for.
Open the company's financial profile CSCO →
See also: market overview · valuation map · stock screeners