KULICKE & SOFFA INDUSTRIES INC: revenue more than doubled, but cash left after capex is a third of profit
Contents
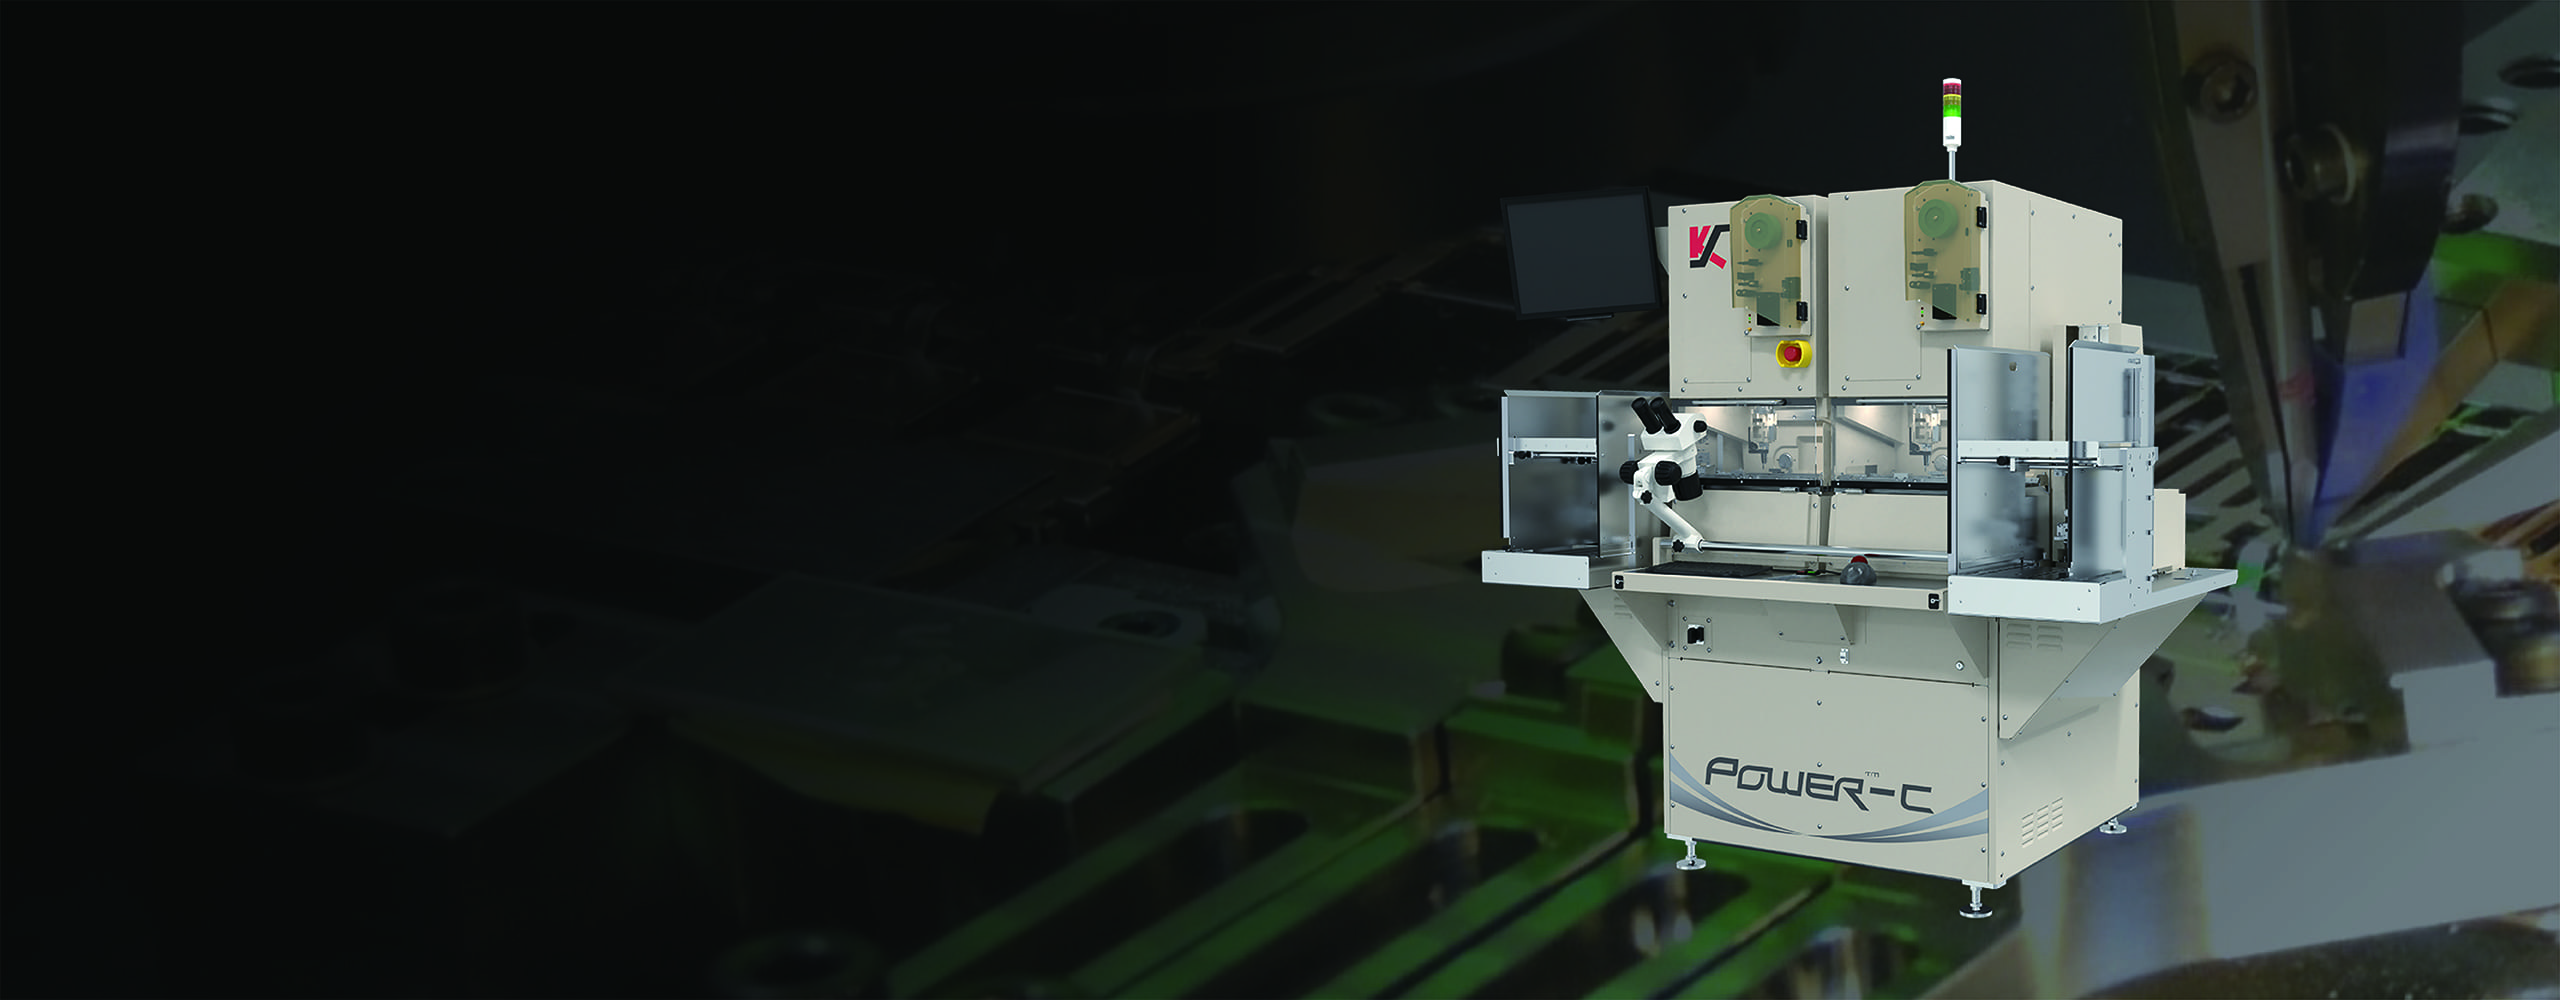
KULICKE & SOFFA INDUSTRIES INC reported results for the fourth quarter of fiscal 2026 (July-September 2026): revenue of $410.3m, operating profit of $87.2m, net profit of $73.2m at a 17.8% net margin versus 3.6% a year earlier. Revenue grew 131.1% year on year, an acceleration from 122.6% in the prior quarter. Yet operating cash flow was only $25.4m and capital expenditure $10.8m, leaving free cash flow a third of net profit. Our conclusion: rather attractive – an EV/EBITDA of 20.3 with net cash of $177.2m and a 17.8% margin is justified by growth, but the cushion depends on the acceleration continuing. Our view: the share is rather attractive at the current price.
Our view: is there upside
Our view in numbers
| Metric | Our read |
|---|---|
| Verdict | Rather attractive |
| Upside on the portal model | no portal model for this share |
| Dividend yield, 12m | 1.2% |
| Net debt / EBITDA | -1.25 – net cash |
| Strongest case for | Revenue grew 131.1% with acceleration, while net cash of $177.2m and a 17.8% margin provide a cushion. |
| Strongest case against | EV/EBITDA of 20.3 and P/E of 19.2 already price in continued acceleration, while operating cash flow of $25.4m is only a third of the $73.2m profit. |
| What would change the view | If revenue growth slows to 50-60% next quarter or cash conversion stays at a third of profit, the verdict would move one step down. |
Key takeaways
— Revenue grew 131.1% year on year, accelerating from 122.6% a quarter earlier
— Net margin rose to 17.8% from 3.6% a year earlier
— Only a third of the $73.2m profit converted into $25.4m of operating cash flow
— Net cash of $177.2m with net debt to EBITDA at minus 1.25
— EV/EBITDA of 20.3 and P/E of 19.2 already price in continued acceleration
— A 1.22% dividend yield provides no separate support for the share
Key figures, USD bn
| Metric | Q3 2025 | Q3 2026 | Change |
|---|---|---|---|
| Revenue | 0.18 | 0.41 | +131.1% |
| EBITDA | 0.00 | — | — |
| Operating profit | 0.00 | 0.09 | +9583.4% |
| Net profit | 0.01 | 0.07 | +1044.3% |
| Operating cash flow | 0.01 | 0.03 | +242.4% |
| Capex | 0.00 | 0.01 | +264.9% |
| EBITDA margin | 2.8% | — | — |
| Net margin | 3.6% | 17.8% | +14.2 pp |
Revenue grew 131.1% year on year, accelerating from 122.6% a quarter earlier
Revenue in the fourth quarter of fiscal 2026 was $410.3m against $177.6m a year earlier – growth of 131.1%. This is the second consecutive quarter of triple-digit growth: the prior quarter showed 122.6%, so the pace accelerated.
The acceleration comes off a low base: a year earlier revenue fell 2.1%, and a quarter before that it fell 18.3%. The company is now recovering last year's slump, and the absolute level of $410.3m is the highest across all quarters in the data.
The next quarter matters for durability: if growth stays triple-digit, the current price is justified; if the pace returns to double digits, the 20.3 EV/EBITDA will look high.
Revenue and operating profit by quarter
| Period | Measure | bn USD |
|---|---|---|
| Q4 2024 | Revenue | 0.166124 |
| Q1 2025 | Revenue | 0.161986 |
| Q2 2025 | Revenue | 0.14841300000000002 |
| Q3 2025 | Revenue | 0.177558 |
| Q4 2025 | Revenue | 0.199625 |
| Q1 2026 | Revenue | 0.242621 |
| Q2 2026 | Revenue | 0.330409 |
| Q3 2026 | Revenue | 0.410281 |
| Q4 2024 | Operating profit | 0.086649 |
| Q1 2025 | Operating profit | −0.084667 |
| Q2 2025 | Operating profit | −0.0060940000000000005 |
| Q3 2025 | Operating profit | 0.0009 |
| Q4 2025 | Operating profit | 0.01782 |
| Q1 2026 | Operating profit | 0.038566 |
| Q2 2026 | Operating profit | 0.06826600000000001 |
| Q3 2026 | Operating profit | 0.08715099999999999 |
Operating margin
| Period | Measure | % |
|---|---|---|
| Q4 2024 | Operating margin | 52.2 |
| Q1 2025 | Operating margin | −52.3 |
| Q2 2025 | Operating margin | −4.1 |
| Q3 2025 | Operating margin | 0.5 |
| Q4 2025 | Operating margin | 8.9 |
| Q1 2026 | Operating margin | 15.9 |
| Q2 2026 | Operating margin | 20.7 |
| Q3 2026 | Operating margin | 21.2 |
Net margin rose to 17.8% from 3.6% a year earlier
Net profit was $73.2m on revenue of $410.3m, or 17.8% of revenue. A year earlier, on revenue of $177.6m, profit was $6.4m – 3.6%. Profit growth of 11.4-fold far outpaces revenue growth.
Operating profit of $87.2m implies a 21.2% operating margin. The $14.0m gap between operating and net profit reflects taxes and other items; net cash means interest expense is not eating the result.
Such a margin jump off last year's low base is operating leverage: revenue more than doubled while fixed costs barely moved. Whether the 17.8% margin holds is the main question for the report.
Net profit by quarter
| Period | Measure | bn USD |
|---|---|---|
| Q4 2024 | Net profit | 0.08164199999999999 |
| Q1 2025 | Net profit | −0.08451900000000001 |
| Q2 2025 | Net profit | −0.0032890000000000003 |
| Q3 2025 | Net profit | 0.0064 |
| Q4 2025 | Net profit | 0.016796 |
| Q1 2026 | Net profit | 0.035148000000000006 |
| Q2 2026 | Net profit | 0.057415999999999995 |
| Q3 2026 | Net profit | 0.073233 |
Only a third of the $73.2m profit converted into $25.4m of operating cash flow
Operating cash flow for the quarter was $25.4m, or 35% of net profit. Capital expenditure was $10.8m, nearly triple the $4.3m a quarter earlier. Free cash flow after capex was about $14.6m.
The gap between profit and cash flow is working capital: with revenue up 2.3-fold, receivables and inventory grow faster than cash comes in from customers. This is typical of a rapid-growth phase, but it means profit is not yet confirmed by cash.
Over the trailing twelve months operating cash flow was $71.9m against net profit of $182.6m, a conversion of about 39%. For a company growing at triple-digit rates this is acceptable, but it leaves no room for error.
Net cash of $177.2m with net debt to EBITDA at minus 1.25
At the latest reporting date the company had net cash of $177.2m – debt is fully covered by cash. Net debt to EBITDA over the trailing twelve months is minus 1.25, meaning the company holds cash equal to about 1.25 times annual EBITDA.
This removes debt risk: even if revenue falls, the company will not face a refinancing problem. Interest expense does not weigh on profit, as the gap between operating and net profit shows.
The spare cash could go to capex or dividends, but for now the company prefers to hold it – likely as a buffer against a new downturn, as in 2025.
EV/EBITDA of 20.3 and P/E of 19.2 already price in continued acceleration
With a market cap of $3,505.5m and net cash of $177.2m, EV/EBITDA over the trailing twelve months is 20.3 and P/E is 19.2. Return on equity is 30.9%, high for a machinery sector.
A multiple of 20.3 is a premium to the historical level, but the data contain no precise three-year average, so there is nothing to compare against. With revenue growth of 131.1% and a 17.8% margin, such a valuation does not look stretched if the acceleration lasts at least one more quarter.
If growth slows to 50-60%, trailing twelve-month profit of $182.6m at the current price implies a P/E near 19, which leaves no cushion. The share added 2.3% on the release day and another 2.3% from the release to 18 November – the market took the report calmly.
Share price, three years
close, last point 2026-11-18
| Period | Measure | USD per share |
|---|---|---|
| 2025-11-19 | Closing price | 35.290000915527344 |
| 2025-11-20 | Closing price | 39.029998779296875 |
| 2025-11-21 | Closing price | 40.880001068115234 |
| 2025-11-24 | Closing price | 41.54999923706055 |
| 2025-11-25 | Closing price | 43.560001373291016 |
| 2025-11-26 | Closing price | 44.959999084472656 |
| 2025-11-28 | Closing price | 45.11000061035156 |
| 2025-12-01 | Closing price | 44.779998779296875 |
| 2025-12-02 | Closing price | 45.130001068115234 |
| 2025-12-03 | Closing price | 47.0 |
| 2025-12-04 | Closing price | 47.56999969482422 |
| 2025-12-05 | Closing price | 48.4900016784668 |
| 2025-12-08 | Closing price | 48.529998779296875 |
| 2025-12-09 | Closing price | 49.0 |
| 2025-12-10 | Closing price | 49.529998779296875 |
| 2025-12-11 | Closing price | 49.11000061035156 |
| 2025-12-12 | Closing price | 48.08000183105469 |
| 2025-12-15 | Closing price | 47.810001373291016 |
| 2025-12-16 | Closing price | 46.77000045776367 |
| 2025-12-17 | Closing price | 45.7599983215332 |
| 2025-12-18 | Closing price | 45.61000061035156 |
| 2025-12-19 | Closing price | 45.65999984741211 |
| 2025-12-22 | Closing price | 46.2599983215332 |
| 2025-12-23 | Closing price | 46.349998474121094 |
| 2025-12-24 | Closing price | 46.45000076293945 |
| 2025-12-26 | Closing price | 46.75 |
| 2025-12-29 | Closing price | 46.290000915527344 |
| 2025-12-30 | Closing price | 46.380001068115234 |
| 2025-12-31 | Closing price | 45.560001373291016 |
| 2026-01-02 | Closing price | 48.349998474121094 |
| 2026-01-05 | Closing price | 51.33000183105469 |
| 2026-01-06 | Closing price | 53.61000061035156 |
| 2026-01-07 | Closing price | 53.9900016784668 |
| 2026-01-08 | Closing price | 53.95000076293945 |
| 2026-01-09 | Closing price | 55.349998474121094 |
| 2026-01-12 | Closing price | 56.31999969482422 |
| 2026-01-13 | Closing price | 55.40999984741211 |
| 2026-01-14 | Closing price | 56.529998779296875 |
| 2026-01-15 | Closing price | 59.16999816894531 |
| 2026-01-16 | Closing price | 57.54999923706055 |
| 2026-01-20 | Closing price | 56.72999954223633 |
| 2026-01-21 | Closing price | 59.459999084472656 |
| 2026-01-22 | Closing price | 59.5099983215332 |
| 2026-01-23 | Closing price | 57.54999923706055 |
| 2026-01-26 | Closing price | 57.560001373291016 |
| 2026-01-27 | Closing price | 58.13999938964844 |
| 2026-01-28 | Closing price | 58.34000015258789 |
| 2026-01-29 | Closing price | 58.849998474121094 |
| 2026-01-30 | Closing price | 57.33000183105469 |
| 2026-02-02 | Closing price | 57.90999984741211 |
| 2026-02-03 | Closing price | 57.20000076293945 |
| 2026-02-04 | Closing price | 55.66999816894531 |
| 2026-02-05 | Closing price | 66.4000015258789 |
| 2026-02-06 | Closing price | 70.91999816894531 |
| 2026-02-09 | Closing price | 72.91999816894531 |
| 2026-02-10 | Closing price | 74.83999633789062 |
| 2026-02-11 | Closing price | 74.87000274658203 |
| 2026-02-12 | Closing price | 72.08000183105469 |
| 2026-02-13 | Closing price | 71.62000274658203 |
| 2026-02-17 | Closing price | 71.7699966430664 |
| 2026-02-18 | Closing price | 68.9800033569336 |
| 2026-02-19 | Closing price | 69.45999908447266 |
| 2026-02-20 | Closing price | 70.8499984741211 |
| 2026-02-23 | Closing price | 69.08000183105469 |
| 2026-02-24 | Closing price | 71.19999694824219 |
| 2026-02-25 | Closing price | 72.75 |
| 2026-02-26 | Closing price | 70.7300033569336 |
| 2026-02-27 | Closing price | 69.72000122070312 |
| 2026-03-02 | Closing price | 70.2699966430664 |
| 2026-03-03 | Closing price | 66.22000122070312 |
| 2026-03-04 | Closing price | 67.75 |
| 2026-03-05 | Closing price | 63.47999954223633 |
| 2026-03-06 | Closing price | 61.470001220703125 |
| 2026-03-09 | Closing price | 65.44999694824219 |
| 2026-03-10 | Closing price | 65.45999908447266 |
| 2026-03-11 | Closing price | 65.58000183105469 |
| 2026-03-12 | Closing price | 63.38999938964844 |
| 2026-03-13 | Closing price | 64.37000274658203 |
| 2026-03-16 | Closing price | 66.1500015258789 |
| 2026-03-17 | Closing price | 66.36000061035156 |
| 2026-03-18 | Closing price | 65.7300033569336 |
| 2026-03-19 | Closing price | 66.76000213623047 |
| 2026-03-20 | Closing price | 63.88999938964844 |
| 2026-03-23 | Closing price | 65.30000305175781 |
| 2026-03-24 | Closing price | 68.04000091552734 |
| 2026-03-25 | Closing price | 68.80000305175781 |
| 2026-03-26 | Closing price | 64.75 |
| 2026-03-27 | Closing price | 64.68000030517578 |
| 2026-03-30 | Closing price | 61.790000915527344 |
| 2026-03-31 | Closing price | 65.72000122070312 |
| 2026-04-01 | Closing price | 66.27999877929688 |
| 2026-04-02 | Closing price | 64.08000183105469 |
| 2026-04-06 | Closing price | 66.62000274658203 |
| 2026-04-07 | Closing price | 67.18000030517578 |
| 2026-04-08 | Closing price | 72.36000061035156 |
| 2026-04-09 | Closing price | 76.80000305175781 |
| 2026-04-10 | Closing price | 77.45999908447266 |
| 2026-04-13 | Closing price | 77.9800033569336 |
| 2026-04-14 | Closing price | 79.9000015258789 |
| 2026-04-15 | Closing price | 79.83999633789062 |
| 2026-04-16 | Closing price | 79.66000366210938 |
| 2026-04-17 | Closing price | 81.87999725341797 |
| 2026-04-20 | Closing price | 83.41999816894531 |
| 2026-04-21 | Closing price | 83.91999816894531 |
| 2026-04-22 | Closing price | 85.19999694824219 |
| 2026-04-23 | Closing price | 84.66000366210938 |
| 2026-04-24 | Closing price | 87.70999908447266 |
| 2026-04-27 | Closing price | 86.45999908447266 |
| 2026-04-28 | Closing price | 82.9800033569336 |
| 2026-04-29 | Closing price | 83.69999694824219 |
| 2026-04-30 | Closing price | 85.5 |
| 2026-05-01 | Closing price | 86.33000183105469 |
| 2026-05-04 | Closing price | 87.8499984741211 |
| 2026-05-05 | Closing price | 91.38999938964844 |
| 2026-05-06 | Closing price | 93.77999877929688 |
| 2026-05-07 | Closing price | 98.1500015258789 |
| 2026-05-08 | Closing price | 102.66000366210938 |
| 2026-05-11 | Closing price | 104.27999877929688 |
| 2026-05-12 | Closing price | 98.0 |
| 2026-05-13 | Closing price | 104.2699966430664 |
| 2026-05-14 | Closing price | 104.08999633789062 |
| 2026-05-15 | Closing price | 102.04000091552734 |
| 2026-05-18 | Closing price | 99.36000061035156 |
| 2026-05-19 | Closing price | 97.62000274658203 |
| 2026-05-20 | Closing price | 101.2300033569336 |
| 2026-05-21 | Closing price | 101.08999633789062 |
| 2026-05-22 | Closing price | 104.4000015258789 |
| 2026-05-26 | Closing price | 108.56999969482422 |
| 2026-05-27 | Closing price | 105.61000061035156 |
| 2026-05-28 | Closing price | 104.75 |
| 2026-05-29 | Closing price | 101.88999938964844 |
| 2026-06-01 | Closing price | 103.33999633789062 |
| 2026-06-02 | Closing price | 108.36000061035156 |
| 2026-06-03 | Closing price | 108.4000015258789 |
| 2026-06-04 | Closing price | 107.5199966430664 |
| 2026-06-05 | Closing price | 98.16000366210938 |
| 2026-06-08 | Closing price | 102.5 |
| 2026-06-09 | Closing price | 102.63999938964844 |
| 2026-06-10 | Closing price | 102.02999877929688 |
| 2026-06-11 | Closing price | 111.81999969482422 |
| 2026-06-12 | Closing price | 113.12999725341797 |
| 2026-06-15 | Closing price | 115.44000244140625 |
| 2026-06-16 | Closing price | 117.2699966430664 |
| 2026-06-17 | Closing price | 116.51000213623047 |
| 2026-06-18 | Closing price | 121.87000274658203 |
| 2026-06-22 | Closing price | 124.22000122070312 |
| 2026-06-23 | Closing price | 127.0999984741211 |
| 2026-06-24 | Closing price | 123.27999877929688 |
| 2026-06-25 | Closing price | 131.49000549316406 |
| 2026-06-26 | Closing price | 125.22000122070312 |
| 2026-06-29 | Closing price | 129.1199951171875 |
| 2026-06-30 | Closing price | 133.75999450683594 |
| 2026-07-01 | Closing price | 133.80999755859375 |
| 2026-07-02 | Closing price | 121.33000183105469 |
| 2026-07-06 | Closing price | 119.61000061035156 |
| 2026-07-07 | Closing price | 105.87000274658203 |
| 2026-07-08 | Closing price | 104.2300033569336 |
| 2026-07-09 | Closing price | 111.38999938964844 |
| 2026-07-10 | Closing price | 113.41000366210938 |
| 2026-07-13 | Closing price | 106.48999786376953 |
| 2026-07-14 | Closing price | 110.08999633789062 |
| 2026-07-15 | Closing price | 107.41999816894531 |
| 2026-07-16 | Closing price | 99.0199966430664 |
| 2026-07-17 | Closing price | 97.22000122070312 |
| 2026-07-20 | Closing price | 100.05999755859375 |
| 2026-07-21 | Closing price | 108.54000091552734 |
| 2026-07-22 | Closing price | 105.5999984741211 |
| 2026-07-23 | Closing price | 106.08000183105469 |
| 2026-07-24 | Closing price | 101.33000183105469 |
| 2026-07-27 | Closing price | 98.22000122070312 |
| 2026-07-28 | Closing price | 90.93000030517578 |
| 2026-07-29 | Closing price | 82.86000061035156 |
| 2026-07-30 | Closing price | 88.31999969482422 |
| 2026-07-31 | Closing price | 89.19999694824219 |
| 2026-08-03 | Closing price | 90.16000366210938 |
| 2026-08-04 | Closing price | 93.8499984741211 |
| 2026-08-05 | Closing price | 93.83999633789062 |
| 2026-08-06 | Closing price | 90.66000366210938 |
| 2026-08-07 | Closing price | 91.30999755859375 |
| 2026-08-10 | Closing price | 86.5 |
| 2026-08-11 | Closing price | 91.0199966430664 |
| 2026-08-12 | Closing price | 95.1500015258789 |
| 2026-08-13 | Closing price | 95.80000305175781 |
| 2026-08-14 | Closing price | 99.08999633789062 |
| 2026-08-17 | Closing price | 101.7699966430664 |
| 2026-08-18 | Closing price | 92.05999755859375 |
| 2026-08-19 | Closing price | 86.29000091552734 |
| 2026-08-20 | Closing price | 85.12999725341797 |
| 2026-08-21 | Closing price | 85.75 |
| 2026-08-24 | Closing price | 83.51000213623047 |
| 2026-08-25 | Closing price | 84.52999877929688 |
| 2026-08-26 | Closing price | 84.87999725341797 |
| 2026-08-27 | Closing price | 84.66999816894531 |
| 2026-08-28 | Closing price | 81.02999877929688 |
| 2026-08-31 | Closing price | 80.05999755859375 |
| 2026-09-01 | Closing price | 78.04000091552734 |
| 2026-09-02 | Closing price | 78.94999694824219 |
| 2026-09-03 | Closing price | 78.81999969482422 |
| 2026-09-04 | Closing price | 81.62000274658203 |
| 2026-09-08 | Closing price | 83.06999969482422 |
| 2026-09-09 | Closing price | 83.77999877929688 |
| 2026-09-10 | Closing price | 82.97000122070312 |
| 2026-09-11 | Closing price | 86.12999725341797 |
| 2026-09-14 | Closing price | 79.44999694824219 |
| 2026-09-15 | Closing price | 78.79000091552734 |
| 2026-09-16 | Closing price | 79.55000305175781 |
| 2026-09-17 | Closing price | 81.91999816894531 |
| 2026-09-18 | Closing price | 83.13999938964844 |
| 2026-09-21 | Closing price | 84.08000183105469 |
| 2026-09-22 | Closing price | 89.54000091552734 |
| 2026-09-23 | Closing price | 90.8499984741211 |
| 2026-09-24 | Closing price | 88.47000122070312 |
| 2026-09-25 | Closing price | 91.18000030517578 |
| 2026-09-28 | Closing price | 91.68000030517578 |
| 2026-09-29 | Closing price | 93.72000122070312 |
| 2026-09-30 | Closing price | 94.25 |
| 2026-10-01 | Closing price | 96.02999877929688 |
| 2026-10-02 | Closing price | 100.7699966430664 |
| 2026-10-05 | Closing price | 98.7300033569336 |
| 2026-10-06 | Closing price | 97.91999816894531 |
| 2026-10-07 | Closing price | 94.94999694824219 |
| 2026-10-08 | Closing price | 90.91999816894531 |
| 2026-10-09 | Closing price | 92.01000213623047 |
| 2026-10-12 | Closing price | 88.38999938964844 |
| 2026-10-13 | Closing price | 88.54000091552734 |
| 2026-10-14 | Closing price | 84.51000213623047 |
| 2026-10-15 | Closing price | 83.05000305175781 |
| 2026-10-16 | Closing price | 78.62999725341797 |
| 2026-10-19 | Closing price | 81.31999969482422 |
| 2026-10-20 | Closing price | 80.43000030517578 |
| 2026-10-21 | Closing price | 81.43000030517578 |
| 2026-10-22 | Closing price | 73.4000015258789 |
| 2026-10-23 | Closing price | 73.70999908447266 |
| 2026-10-26 | Closing price | 75.5 |
| 2026-10-27 | Closing price | 78.33999633789062 |
| 2026-10-28 | Closing price | 79.44000244140625 |
| 2026-10-29 | Closing price | 79.68000030517578 |
| 2026-10-30 | Closing price | 74.20999908447266 |
| 2026-11-02 | Closing price | 71.19999694824219 |
| 2026-11-03 | Closing price | 72.44000244140625 |
| 2026-11-04 | Closing price | 68.44000244140625 |
| 2026-11-05 | Closing price | 59.83000183105469 |
| 2026-11-06 | Closing price | 64.01000213623047 |
| 2026-11-09 | Closing price | 68.97000122070312 |
| 2026-11-10 | Closing price | 69.69999694824219 |
| 2026-11-11 | Closing price | 73.19999694824219 |
| 2026-11-12 | Closing price | 72.41999816894531 |
| 2026-11-13 | Closing price | 69.06999969482422 |
| 2026-11-16 | Closing price | 65.68000030517578 |
| 2026-11-17 | Closing price | 65.5 |
| 2026-11-18 | Closing price | 66.98999786376953 |
A 1.22% dividend yield provides no separate support for the share
The trailing twelve-month dividend yield is 1.22%. With trailing twelve-month net profit of $182.6m and a market cap of $3,505.5m, that corresponds to a payout of about $43m, or roughly a quarter of profit.
A 1.22% yield is below the key rate and does not compensate for cyclical downturn risk. For a holder the dividend is a nice extra, but not a reason to buy the share: the main return must come from a re-rating of growth.
The company could raise the payout using its $177.2m net cash, but policy is conservative for now. If the payout stays at a quarter of profit, the yield will move with profit rather than grow steadily.
Valuation on the latest reported figures
| Metric | Value |
|---|---|
| Market cap | 3.51 bn USD |
| P/E (LTM) | 19.2 |
| EV/EBITDA (LTM) | 20.3 |
| P/B | 4.27 |
| Net debt / EBITDA (LTM) | -1.25 |
| Operating cash flow (LTM) | 0.07 bn |
| ROE | 30.9% |
| Dividend yield (12m) | 1.2% |
Bottom line
What was strong in the report was everything tied to growth: revenue of $410.3m accelerating to 131.1%, net profit of $73.2m and a 17.8% margin versus 3.6% a year earlier. What was weak was cash conversion: operating cash flow of $25.4m covered only a third of profit, while capex rose to $10.8m. Net cash of $177.2m removes debt risk but does not settle valuation: EV/EBITDA of 20.3 and P/E of 19.2 already assume the acceleration continues. A 1.22% dividend yield provides no separate support. Our conclusion: rather attractive – an EV/EBITDA of 20.3 with net cash of $177.2m and a 17.8% margin is justified by growth, but the cushion depends on the acceleration continuing. Our view: the share is rather attractive at the current price.