Everpure (Pure Storage): revenue accelerated to 37.7%, but free cash flow turned negative
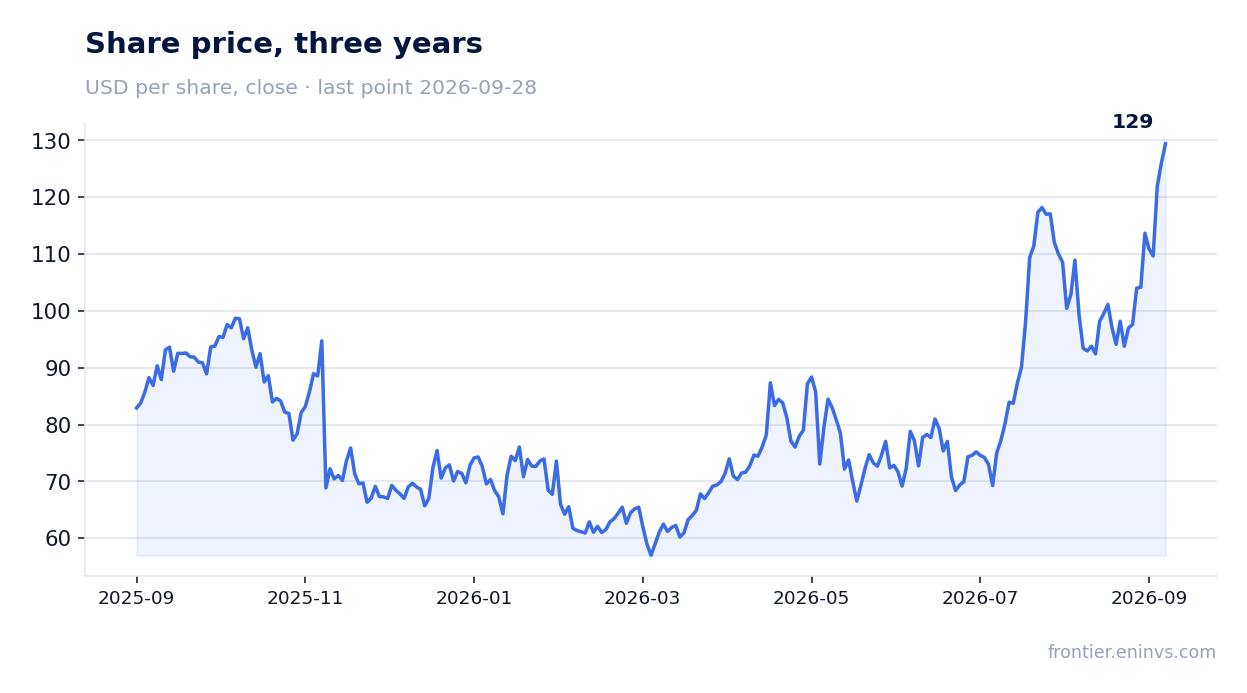
On September 2, Everpure (Pure Storage) reported results for the second quarter of 2026. Revenue grew 37.7% year-on-year to $1,185.9 million, EBITDA rose 178.0% to $104.2 million, and net profit added 57.4% to $74.1 million. Growth accelerated from 35.2% in the first quarter, and the EBITDA margin reached 8.8% versus 4.4% a year earlier. However, operating cash flow was negative at -$136.3 million, and capital expenditures rose to $101.3 million. With the share price at $102.81 before the release and a 5.9% gain on the publication day, the stock looks neutral: accelerating revenue and margin expansion are offset by extremely high multiples and weak cash flow.
Key takeaways
— Revenue grew 37.7% year-on-year to $1,185.9 million, accelerating from 35.2% in the first quarter
— EBITDA rose 178.0% to $104.2 million, with the margin reaching 8.8% versus 4.4% a year earlier
— Net profit added 57.4% to $74.1 million, but operating cash flow turned negative at -$136.3 million
— Capital expenditures rose to $101.3 million, which together with negative cash flow weighs on free cash flow
— Net debt decreased from -$0.7 billion on August 3, 2025 to -$0.2 billion on August 2, 2026
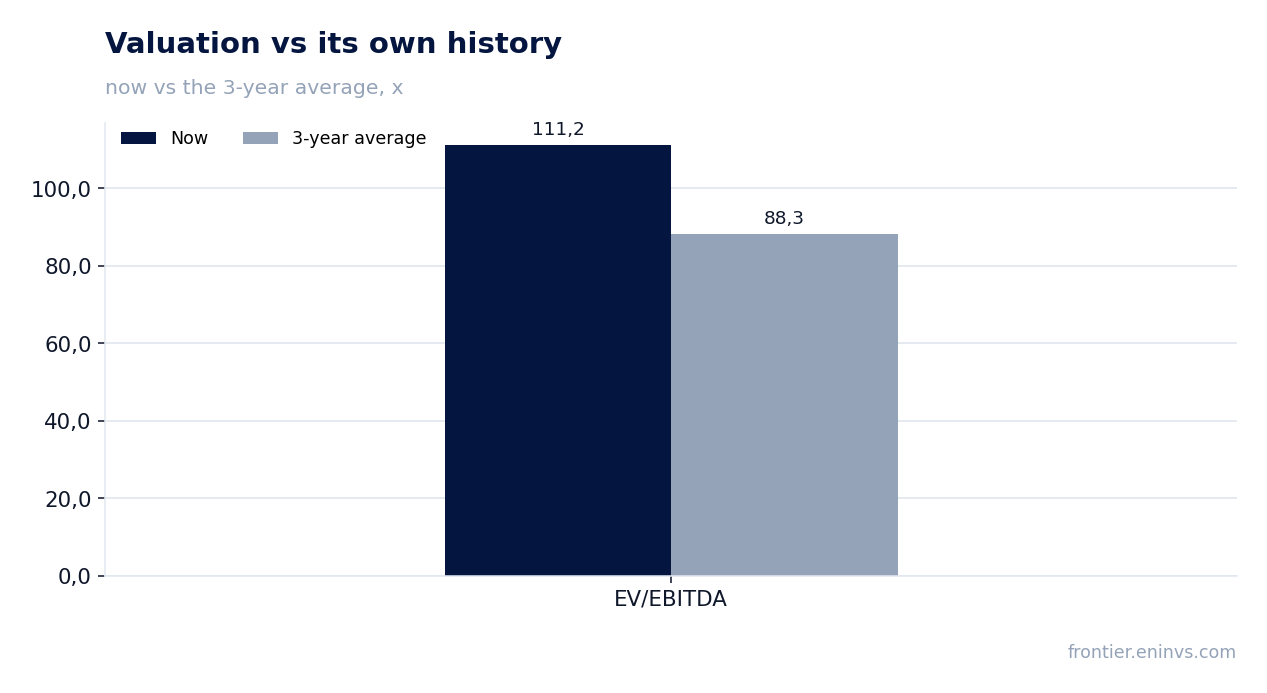
— The EV/EBITDA LTM multiple is 111.2, above the three-year average of 88.3
— On the portal's model, the upside to fair value is estimated at +8%
Attractiveness
Key figures, USD bn
| Metric | Q2 2025 | Q2 2026 | Change |
|---|---|---|---|
| Revenue | 0.86 | 1.19 | +37.7% |
| EBITDA | 0.04 | 0.10 | +178.0% |
| Operating profit | 0.00 | 0.06 | +1196.6% |
| Net profit | 0.05 | 0.07 | +57.4% |
| Operating cash flow | 0.21 | -0.14 | -164.3% |
| Capex | 0.06 | 0.10 | +63.2% |
| EBITDA margin | 4.4% | 8.8% | +4.4 pp |
| Net margin | 5.5% | 6.3% | +0.8 pp |
Revenue grew 37.7% year-on-year to $1,185.9 million, accelerating from 35.2% in the first quarter
In the second quarter of 2026, Everpure (Pure Storage) revenue reached $1,185.9 million, up 37.7% year-on-year. This is an acceleration from the first quarter, when growth was 35.2%. The company has shown accelerating growth for two consecutive quarters: in the fourth quarter of 2025 growth was 16.0%, in the first quarter of 2026 – 35.2%, now – 37.7%.
The acceleration in revenue growth may be linked to strong demand for the company's solutions, but the provided facts do not include segment or regional detail, so the cause cannot be identified. Importantly, this growth comes alongside increased capital expenditures, which may indicate investments in expansion.
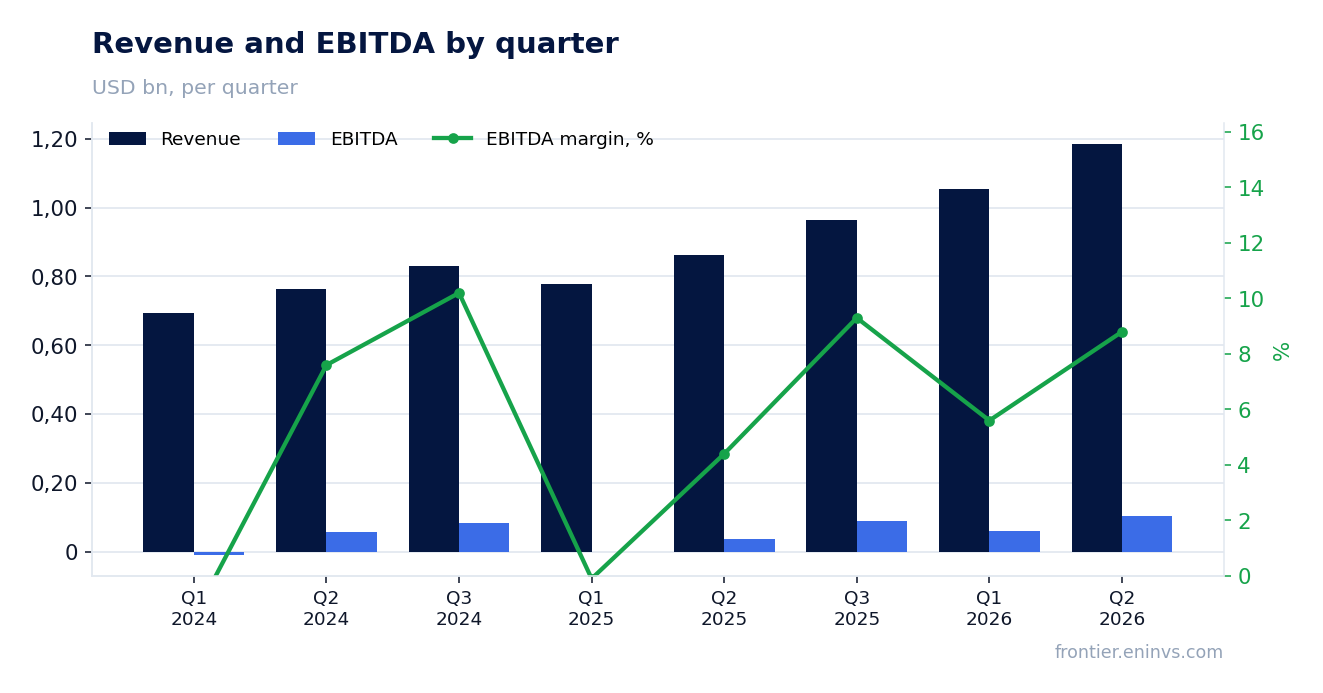
EBITDA rose 178.0% to $104.2 million, with the margin reaching 8.8% versus 4.4% a year earlier
EBITDA in the second quarter of 2026 was $104.2 million, up 178.0% year-on-year. The EBITDA margin reached 8.8% versus 4.4% in the second quarter of 2025. Such margin growth may be explained by operating leverage amid rapid revenue growth, as well as possible improvements in the cost structure.
Operating profit was $63.2 million versus $4.9 million a year earlier. Net profit grew 57.4% to $74.1 million, and the net margin rose to 6.3% from 5.5%. Profit growth lags EBITDA growth, which may be due to taxes or other below-the-line expenses.
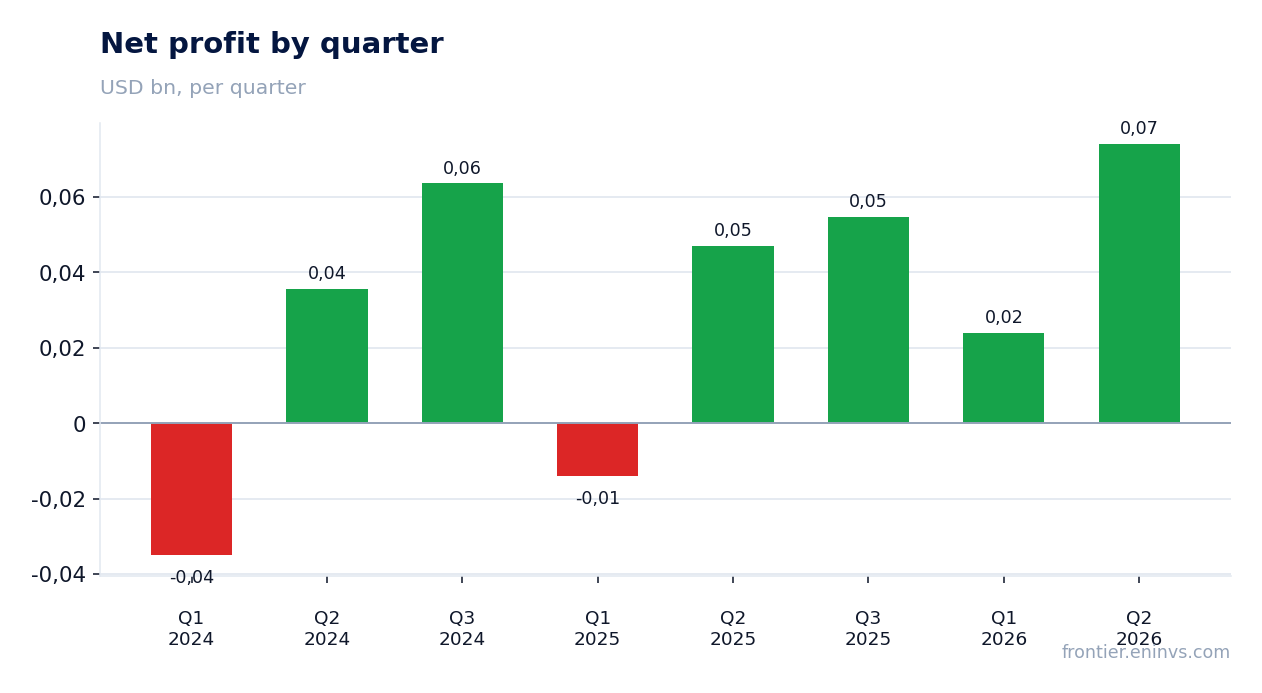
Net profit added 57.4% to $74.1 million, but operating cash flow turned negative at -$136.3 million
Net profit in the second quarter of 2026 was $74.1 million, up 57.4% year-on-year. However, operating cash flow was negative at -$136.3 million. This is a sharp contrast to profit and may indicate working capital issues or one-off payments.
Over the trailing twelve months, operating cash flow was $427.8 million, showing that the quarter was anomalous. The negative flow in the reporting quarter may be due to seasonality or large working capital investments, but the exact cause is not specified in the facts.
Capital expenditures rose to $101.3 million, which together with negative cash flow weighs on free cash flow
Capital expenditures in the second quarter of 2026 were $101.3 million, higher than in previous quarters. For example, in the first quarter of 2026 they were $68.4 million, and in the second quarter of 2025 – $62.0 million. The increase in capital expenditures may reflect investments in infrastructure or development.
Together with negative operating cash flow, this means free cash flow in the reporting quarter was deeply negative. This is a key risk for shareholders, as the company may be forced to fund investments from existing cash or debt.
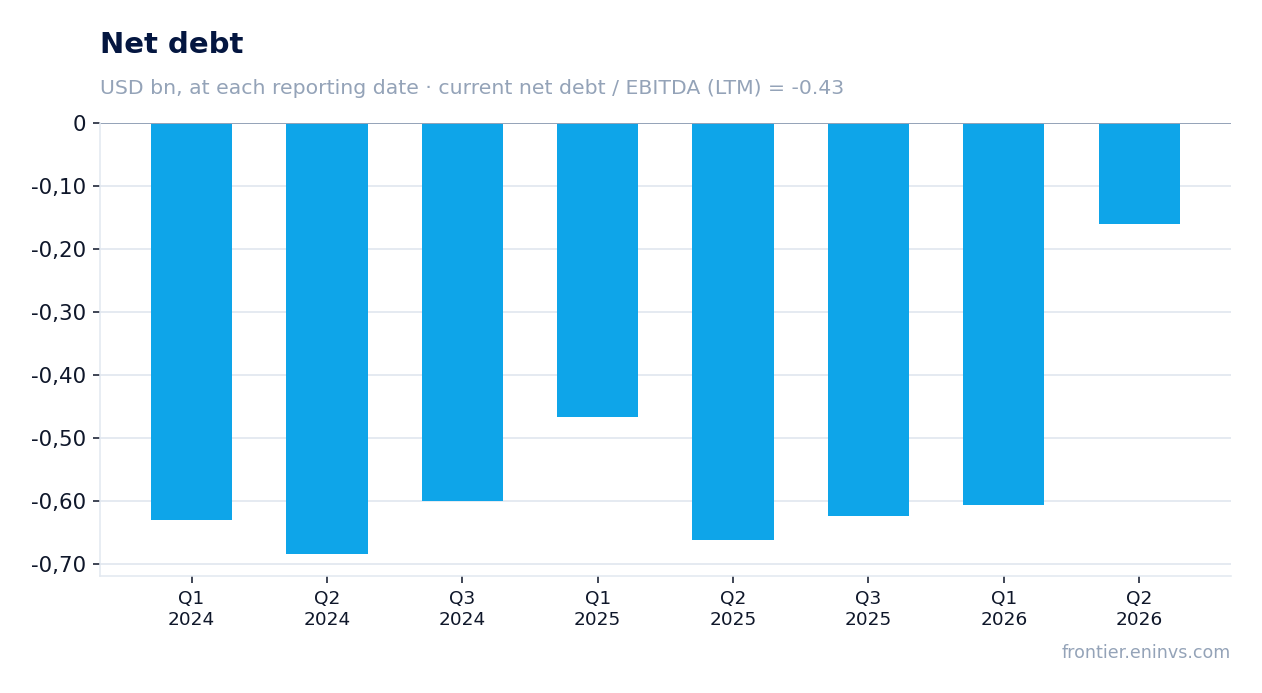
Net debt decreased from -$0.7 billion on August 3, 2025 to -$0.2 billion on August 2, 2026
Net debt as of August 2, 2026 was -$0.2 billion, meaning cash exceeds debt. A year earlier, on August 3, 2025, net debt was -$0.7 billion. Thus, the change over the year was +$0.5 billion – the company reduced its net cash position.
The net debt to EBITDA LTM ratio is -0.43, reflecting a net cash position. This is a low level of debt burden, giving the company financial flexibility. However, the direction of the ratio change is not provided in the facts, so it cannot be stated whether the debt situation improved or worsened.
The EV/EBITDA LTM multiple is 111.2, above the three-year average of 88.3
The EV/EBITDA LTM multiple currently stands at 111.2, above the three-year average of 88.3. This means the stock is valued more expensively than its average over the past three years. The P/E LTM is 166.6, also indicating a high valuation.
On the portal's model, the upside to fair value is estimated at +8%. This is the portal's own calculation, not a market consensus. Given the high multiples, even this upside may only materialise if strong financial results continue.
On the portal's model, the upside to fair value is estimated at +8%
According to the portal's model, the fair value of Everpure (Pure Storage) shares implies an upside of +8% from the current price. This is a moderate potential that does not compensate for high multiples and cash flow risks.
The model takes into account EBITDA growth and a target multiple, but is not a market consensus or a target price. It shows that at current fundamentals, the stock is valued close to fair value, and further growth requires improvement in cash flow.
Valuation on the latest reported figures
| Metric | Value |
|---|---|
| Market cap | 42.2 bn USD |
| P/E (LTM) | 166.6 |
| EV/EBITDA (LTM) | 111.2 |
| P/B | 29.19 |
| Net debt / EBITDA (LTM) | -0.43 |
| Operating cash flow (LTM) | 0.43 bn |
| ROE | 19.9% |
| EV/EBITDA, 3-year average | 88.3 |
Bottom line
Bottom line: Everpure (Pure Storage) delivered strong revenue acceleration to 37.7% and EBITDA margin expansion to 8.8%, which is genuinely strong. However, operating cash flow turned negative and capital expenditures rose, casting doubt on earnings quality. Valuation remains extremely high: EV/EBITDA 111.2 versus the three-year average of 88.3. The portal's model upside is only +8%, which does not compensate for the risks. Verdict – neutral: the current price already reflects most of the positive news.
Open the company's financial profile PSTG →
See also: market overview · valuation map · stock screeners