Clicks: revenue up 5.4% but profit lagged as margin narrowed to 6.6%
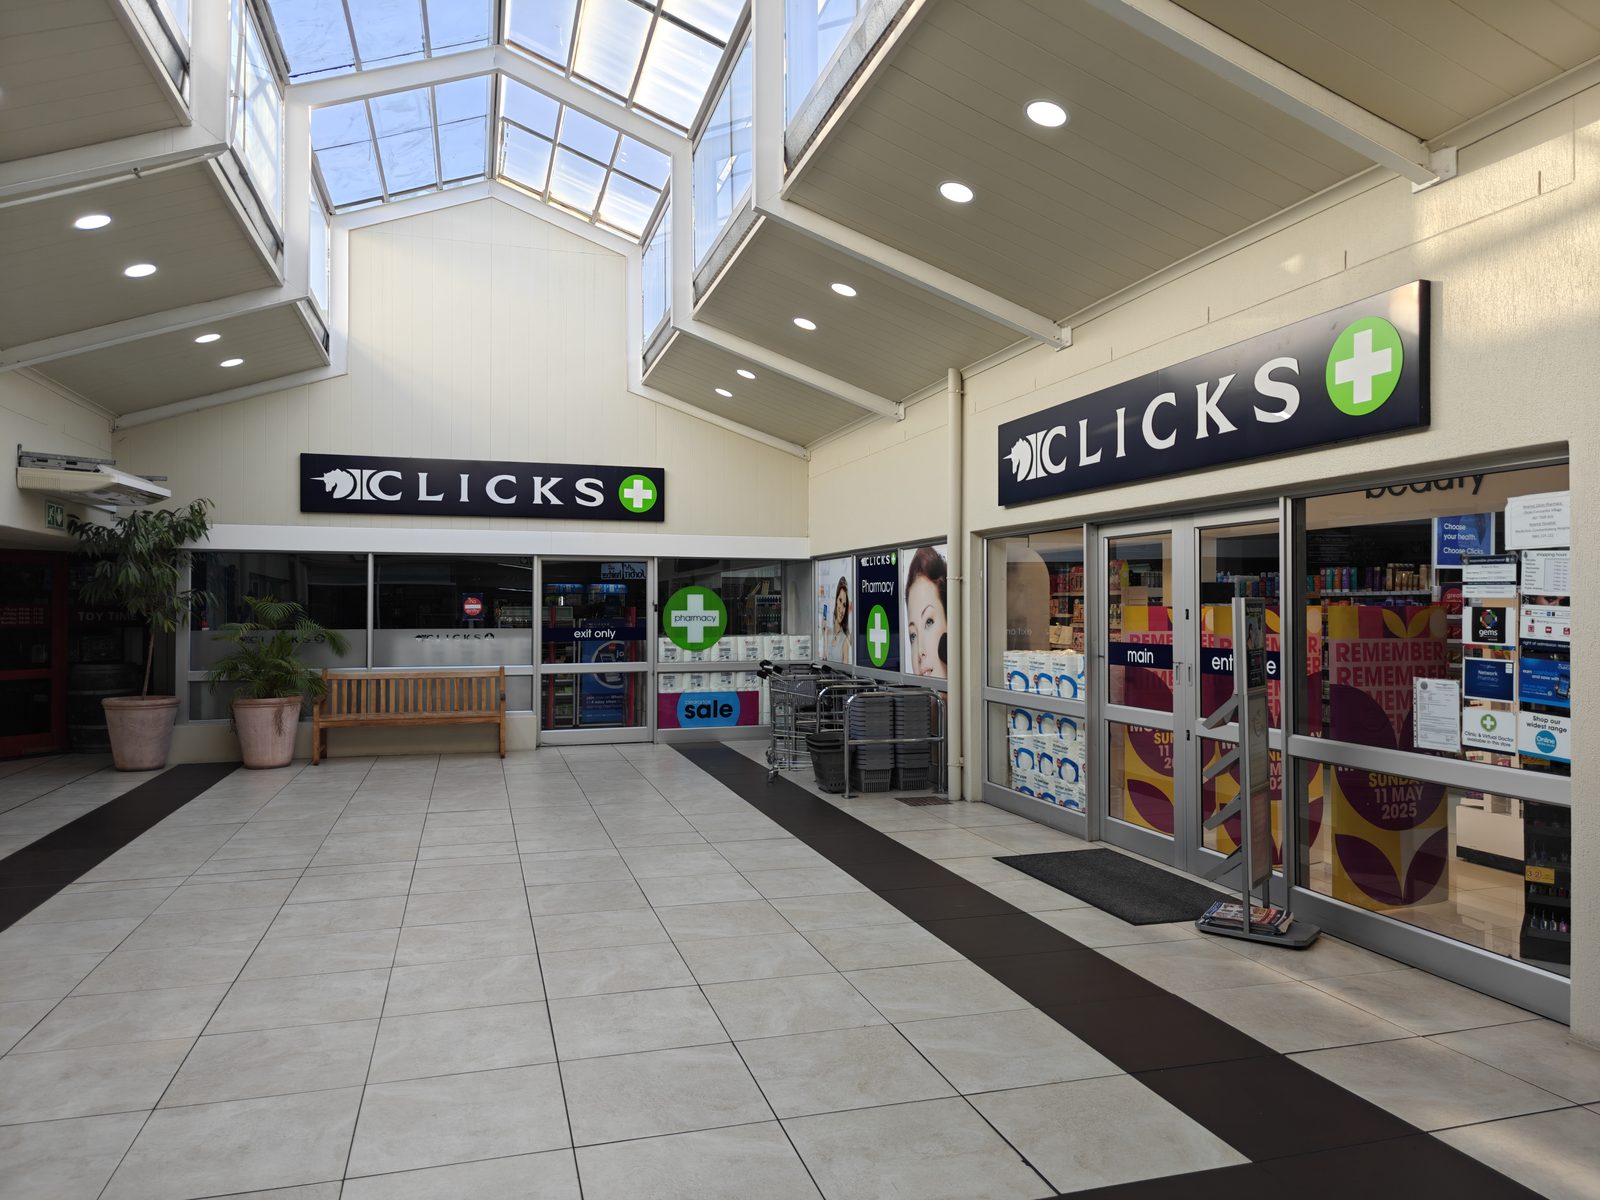
Clicks' results for the financial year ended 31 August 2026 showed revenue of ZAR 50,414.0m (+5.4% YoY) and net profit of ZAR 3,318.6m (+2.5%). Profit grew slower than revenue, and the net margin narrowed to 6.6% from 6.8% a year earlier. Leverage is moderate – net debt of ZAR 2.2bn, or 0.31x LTM EBITDA – and a 4.1% dividend yield at a P/E of 16.3 looks fair but offers no cushion. The share is rated neutral: growth is there, but it is not translating into faster profit growth.
Key takeaways
— Revenue rose 5.4% to ZAR 50,414.0m, but profit added only 2.5%
— Net margin narrowed to 6.6% from 6.8% – revenue growth did not reach profit
— Operating cash flow of ZAR 4,803.1m covered capital expenditure of ZAR 1,165.6m
— Net debt of ZAR 2.2bn equals 0.31x LTM EBITDA
— A 4.1% dividend yield at a P/E of 16.3 offers no clear advantage
— On the portal's model, the share has 6% upside to fair value
Attractiveness
Key figures, ZAR bn
| Metric | FY 2025 | FY 2026 | Change |
|---|---|---|---|
| Revenue | 47.8 | 50.4 | +5.4% |
| EBITDA | 5.28 | — | — |
| Operating profit | 4.67 | 4.90 | +4.9% |
| Net profit | 3.24 | 3.32 | +2.5% |
| Operating cash flow | 5.24 | 4.80 | -8.4% |
| Capex | 0.98 | -1.17 | -218.4% |
| EBITDA margin | 11.0% | — | — |
| Net margin | 6.8% | 6.6% | -0.2 pp |
Revenue rose 5.4% to ZAR 50,414.0m, but profit added only 2.5%
For the financial year ended 31 August 2026, Clicks reported revenue of ZAR 50,414.0m, up 5.4% from a year earlier. Net profit came in at ZAR 3,318.6m, up 2.5%. The gap between revenue and profit growth means costs rose faster than income.
Operating profit for the reported period was ZAR 4,898.1m. Against revenue of ZAR 50,414.0m, that implies an operating margin of about 9.7%. The net margin was 6.6% versus 6.8% a year earlier – a 0.2 percentage point contraction.
For the trailing twelve months, revenue was ZAR 50,400.0m, essentially in line with the reported period since the fiscal year has just closed. LTM net profit was ZAR 3,318.6m and LTM EBITDA was ZAR 6,951.2m. These figures underpin the valuation multiples.
Net margin narrowed to 6.6% from 6.8% – revenue growth did not reach profit
The drop in net margin to 6.6% from 6.8% a year earlier is the main signal in the report. With revenue up 5.4%, profit rose only 2.5%, meaning each rand of additional revenue delivered less profit than last year.
Operating profit of ZAR 4,898.1m on revenue of ZAR 50,414.0m implies an operating margin of about 9.7%. The gap between operating and net margin reflects interest costs and taxes. Net debt of ZAR 2.2bn means interest payments remain a material line item.
LTM net profit was ZAR 3,318.6m, in line with the reported period. Return on equity of 51.4% remains high, but that is a function of a small equity base alongside significant debt, not a sign of accelerating profit.
Operating cash flow of ZAR 4,803.1m covered capital expenditure of ZAR 1,165.6m
Operating cash flow for the reported period was ZAR 4,803.1m, with capital expenditure of ZAR 1,165.6m. Free cash flow after capex exceeds ZAR 3.6bn, covering both interest payments and dividends.
Capex is about 2.3% of revenue – a moderate level for a retail chain that does not require heavy fixed-asset investment. Cash generation is steady and does not rely on one-off inflows.
For the trailing twelve months, operating cash flow was also ZAR 4,803.1m, confirming the stability of cash generation. This is the flow that services debt and funds shareholder payouts.
Net debt of ZAR 2.2bn equals 0.31x LTM EBITDA
As of 31 August 2026, Clicks' net debt stood at ZAR 2,187.9m, or ZAR 2.2bn. With LTM EBITDA of ZAR 6,951.2m, the net debt to EBITDA ratio is 0.31x. That is a low leverage level.
From 28 February 2026, net debt fell from ZAR 3.2bn to ZAR 2.2bn – a decrease of ZAR 1.0bn. Over the twelve months to 31 August 2026, net debt rose from ZAR 0.8bn to ZAR 2.2bn, an increase of ZAR 1.4bn. The annual increase reflects funding of operations and shareholder payouts.
At this level of leverage, interest costs do not pressure profit. A net debt to EBITDA ratio of 0.31x leaves substantial headroom before levels typically considered risky.
A 4.1% dividend yield at a P/E of 16.3 offers no clear advantage
The trailing twelve-month dividend yield is 4.1%. Against a market capitalisation of ZAR 53,939.8m, that implies payouts of about ZAR 2.2bn. The company pays dividends regularly, and the current yield is moderate.
Our estimate for the current year's dividend is based on LTM profit of ZAR 3,318.6m and a payout ratio close to the current level. If the payout ratio is maintained, the dividend should stay in the 4–4.5% yield range. The risk of a lower payout is tied to further margin compression.
A 4.1% yield does not look high relative to the risk-free rate, but it is not weak for a company with revenue growth. The dividend is covered by free cash flow, which exceeds ZAR 3.6bn.
On the portal's model, the share has 6% upside to fair value
On the portal's model, which compares EBITDA growth with a target multiple, the fair value of Clicks shares is 6% above the current market price. This is the portal's own calculation, not a market consensus.
The current LTM P/E is 16.3 and EV/EBITDA is 8.1. With a market capitalisation of ZAR 53,939.8m and net debt of ZAR 2.2bn, EV is about ZAR 56.1bn. The multiples are neither overheated nor cheap.
The 6% upside is modest and does not provide a sufficient margin of safety. A more attractive valuation would require either faster profit growth or a lower multiple that the market is willing to pay for similar growth.
Valuation on the latest reported figures
| Metric | Value |
|---|---|
| Market cap | 53.9 bn ZAR |
| P/E (LTM) | 16.3 |
| EV/EBITDA (LTM) | 8.1 |
| P/B | 7.93 |
| Net debt / EBITDA (LTM) | 0.31 |
| Operating cash flow (LTM) | 4.80 bn |
| ROE | 51.4% |
| Dividend yield (12m) | 4.1% |
Bottom line
Clicks delivered 5.4% revenue growth, but profit rose only 2.5% and the margin narrowed to 6.6%. Cash flow is steady, leverage is low at 0.31x EBITDA, and the dividend is covered by free cash flow. However, the portal model shows only 6% upside, and a P/E of 16.3 offers no clear cushion. The share is rated neutral: growth is present but is not translating into faster profit growth, and a turnaround in margin is needed to improve the valuation.
Open the company's financial profile CLS →
See also: market overview · valuation map · stock screeners