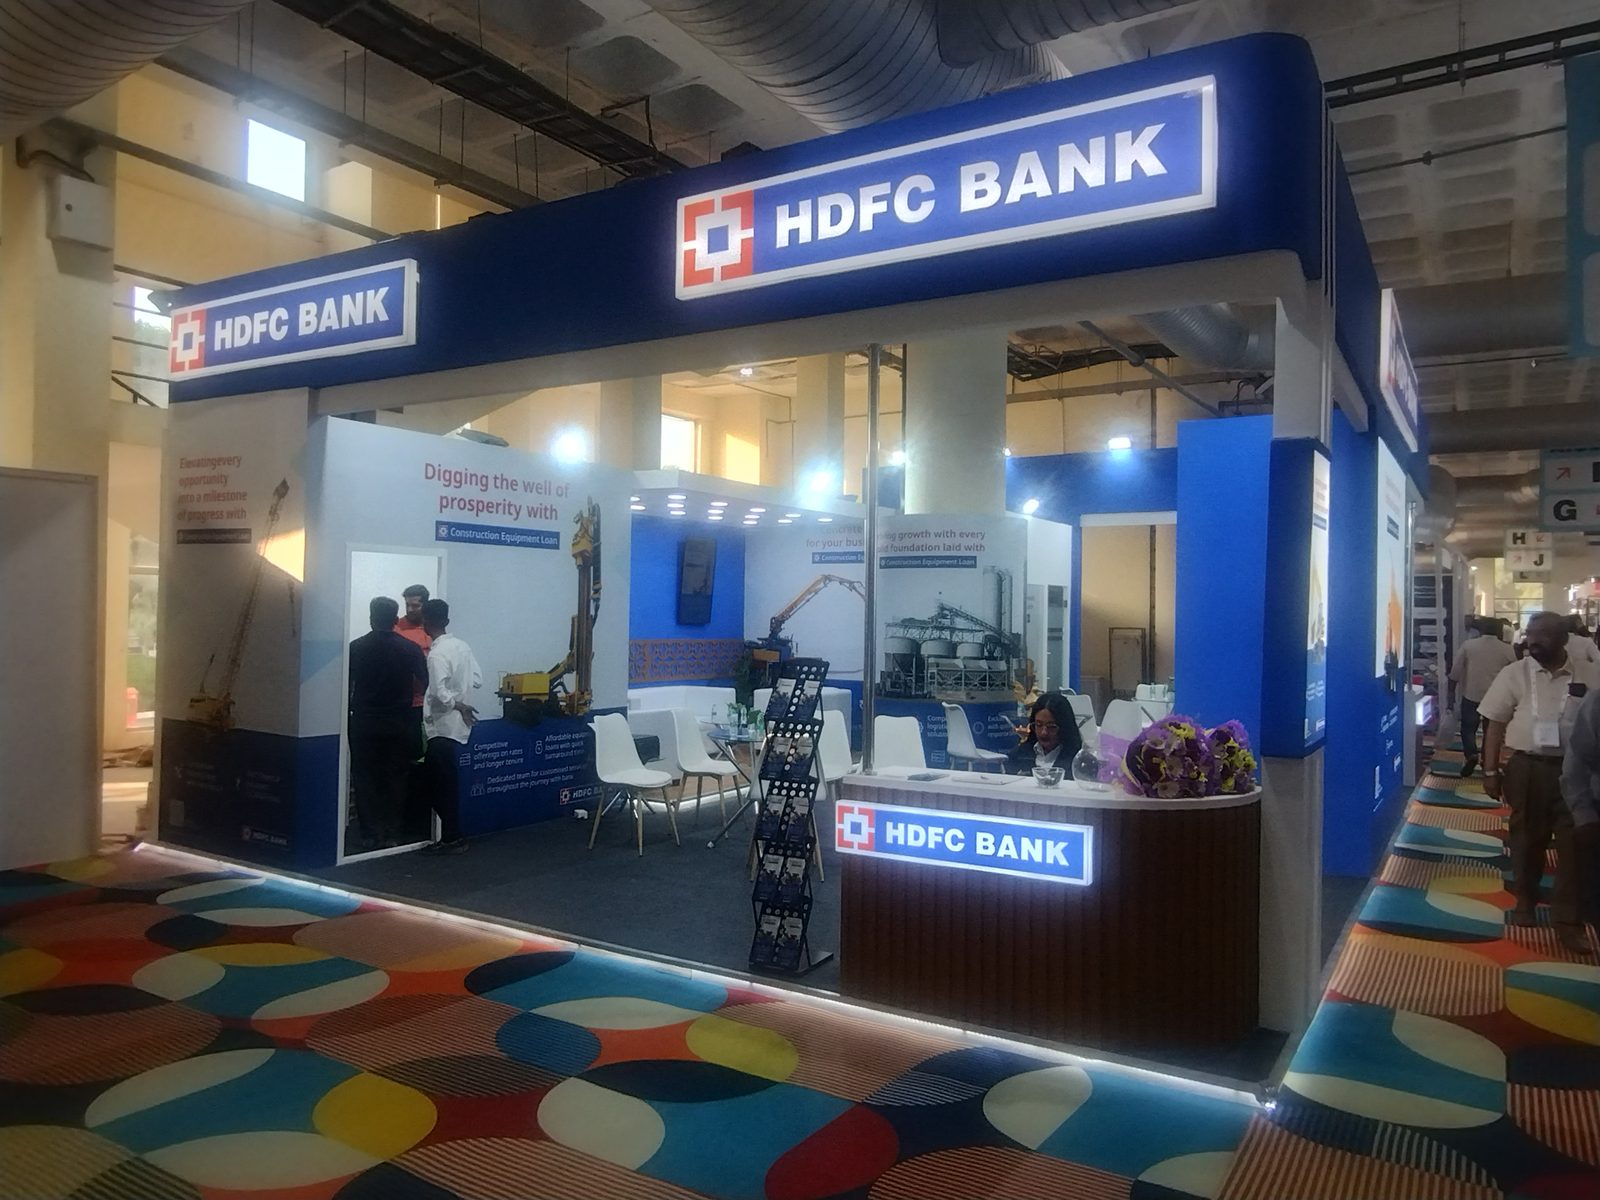
HDFC Bank is an Indian banking and financial services company offering a wide range of retail and wholesale banking products, including deposits, loans, credit cards, and trade finance, along with treasury and insurance services. It operates primarily in India with some international branches.
Sector: Banks
IN_HDFCBANK
Shares: connector/market_inputs
Monetary columns are in B INR, one decimal; scale (K/M/B/T) keeps values readable. For the period (default) shows P&L and cash flow for that row’s reporting window: quarterly amounts when the feed uses quarter-duration facts (typical US 10-Q revenue and income), quarterly cash flows after stripping YTD where only cumulative tags exist, and an implied Q4 on 31 Dec FY rows (P&L: FY minus Q1–Q3; operating / investing cash flow: FY 12m minus 9M YTD to 30 Sep when sourced from SEC builder evidence) so they match 10-Q scale. Some issuers still use cumulative YTD minus the prior row in the same calendar year. As reported shows values stored on each row (e.g. full-year on FY). Balance sheet is always as reported. Source JSON may use millions etc.; conversion uses amounts_unit per row.
| Date | Period | Status | Net interest incomeB INR | Net profitB INR | AssetsB INR | EquityB INR | ROE (annualized) | Source |
|---|---|---|---|---|---|---|---|---|
| 2026-06-30 | Q2 2026 (3M) | OK | 816.8 y/y -4.3% | 192.4 y/y 18.4% | 49714.7 y/y 11.6% | 6293.9 y/y 16.0% | 10.6% | stockanalysis.com |
| 2026-03-31 | FY 2026 (12M) | OK | — y/y 4.7% | 173.5 y/y 9.6% | 52621.2 y/y 9.2% | 8167.4 y/y 6.4% | 10.0% | Yahoo Finance |
| 2025-12-31 | Q4 2025 (3M) | OK | 774.9 y/y 18.7% | 198.1 y/y 12.2% | 46260.4 y/y 9.4% | 5868.1 y/y 16.8% | 3.6% | stockanalysis.com |
| 2025-09-30 | Q3 2025 (3M) | OK | 412.0 y/y 0.9% | 170.6 y/y -1.8% | 48978.7 y/y 7.2% | 8887.1 y/y 8.3% | 9.5% | stockanalysis.com |
| 2025-06-30 | Q2 2025 (3M) | OK | 853.5 y/y 23.2% | 162.6 y/y -1.3% | 44560.5 y/y 11.2% | 5426.3 y/y 10.7% | 9.9% | Yahoo Finance |
| 2025-03-31 | Q1 2025 (3M) | OK | 84.8 y/y — | 158.4 y/y — | 48187.7 y/y 9.2% | 7676.9 y/y 10.5% | 10.6% | Yahoo Finance |
| 2024-12-31 | Q4 2024 (3M) | OK | 652.8 y/y -2.8% | 176.6 y/y 2.3% | 42281.8 y/y 8.9% | 5021.9 y/y 11.5% | 3.6% | Yahoo Finance |
| 2024-09-30 | Q3 2024 (3M) | OK | 408.3 y/y -8.5% | 173.8 y/y 36.3% | 45703.5 y/y 20.9% | 8204.4 y/y 90.2% | 10.6% | stockanalysis.com |
| 2024-06-30 | Q2 2024 (3M) | OK | 692.7 y/y — | 164.7 y/y — | 40065.4 y/y — | 4902.3 y/y — | 11.1% | stockanalysis.com |
| 2024-03-31 | FY 2024 (12M) | OK | — y/y 33.2% | — y/y 25.7% | 44118.6 y/y 71.3% | 6947.3 y/y 138.6% | 10.9% | Yahoo Finance |
| 2023-12-31 | Q4 2023 (3M) | OK | 671.7 y/y — | 172.6 y/y — | 38818.3 y/y — | 4503.5 y/y — | 5.2% | stockanalysis.com |
| 2023-09-30 | Q3 2023 (3M) | OK | 446.4 y/y — | 127.5 y/y — | 37813.5 y/y — | 4313.3 y/y — | 14.1% | stockanalysis.com |
| 2023-03-31 | FY 2023 (12M) | OK | 1205.4 y/y — | 495.4 y/y — | 25755.6 y/y — | 2912.2 y/y — | — | Yahoo Finance |
Our earnings breakdowns and investment notes on this issuer.
Group: Banks. Each peer is shown as it trades and re-priced onto this company's market (India) by the ratio of our coverage medians.
| Company | Market | Cap, $bn | P/E | P/E, adjusted |
|---|---|---|---|---|
| State Bank of India | India | 93.6 | 10.3x | 10.3x |
| Emirates NBD | UAE | 54.3 | 8.2x | 14.6x |
| Bradesco | Brazil | 42.4 | 9.0x | 15.5x |
| Abu Dhabi Commercial Bank | UAE | 34.6 | 9.6x | 17.2x |
| Shinhan Financial Group | Korea | 32.6 | 7.9x | 17.7x |
| ICICI Bank | India | 105.6 | 17.9x | 17.9x |
| First Abu Dhabi Bank | UAE | 58.1 | 10.1x | 17.9x |
| KB Financial Group | Korea | 42.4 | 9.0x | 20.2x |
| Bank Central Asia | Indonesia | 35.3 | 11.0x | 46.1x |
| Royal Bank of Canada | Canada | 274.2 | 19.1x | — |
| Mitsubishi UFJ Financial Group | Japan | 247.5 | 14.5x | — |
| Bank of Nova Scotia | Canada | 112.6 | 20.5x | — |
| Group median | 10.2x | 17.7x | ||
| Group average | 12.3x | 19.7x | ||
| This company | India | 118.3 | 15.9x | 15.9x |
Group median 10.2x as traded, 17.7x adjusted; this company 15.9x — a 10% discount.
Group average 12.3x as traded, 19.7x adjusted; against the average this company is at a 19% discount.
At the adjusted group median the market cap would be +11% versus today.
The gap and the implied upside are measured against the median: one richly priced peer moves an average, not a median. The market adjustment uses our coverage medians (US 27.9x, Russia 6.2x, South Africa 11.1x, Kazakhstan 9.3x, India 27.8x, Indonesia 6.6x); it is about where a name is listed, not what it does. Peer multiples come from the nightly rebuild of 2026-10-17; the company's own is live.
| Date | Per share | Details | Status | Source |
|---|---|---|---|---|
| 2026-06-19 | 13 INR | Ex-dividend: 13 INR per share | Paid | Yahoo Finance (ex-div) |
| 2025-07-25 | 2.5 INR | Ex-dividend: 2.5 INR per share | Paid | Yahoo Finance (ex-div) |
| 2025-06-27 | 11 INR | Ex-dividend: 11 INR per share | Paid | Yahoo Finance (ex-div) |
| 2024-05-10 | 9.75 INR | Ex-dividend: 9.75 INR per share | Paid | Yahoo Finance (ex-div) |
| 2023-05-16 | 9.5 INR | Ex-dividend: 9.5 INR per share | Paid | Yahoo Finance (ex-div) |
| 2022-05-12 | 7.75 INR | Ex-dividend: 7.75 INR per share | Paid | Yahoo Finance (ex-div) |
KASE: status follows wording in the news headline (paid vs intends to pay). Yahoo: amounts are cash dividends per share on ex-dividend dates (UTC calendar date). stockscope.uz (UZ): amounts are per share in UZS by publication date (not necessarily ex-div).
Reporting forms detected in loaded periods: ✓ ✓ ✓ (Balance sheet / Profit or loss (P&L) / Cash flows)
Financial results, valuation multiples (P/E, P/B), profitability and dividend yield of HDFC Bank (HDFCBANK) — from primary filings.
See also: The Cheapest Bank Stocks in the World (2026): Where Global Banks Trade Below Book · The Cheapest Stocks in the World (2026): What Value Investing Says About Buying Cheap · global valuation map