Emaar Development: revenue up 14.4% but profit lags as margin narrows to 39.8%
In its Q3 2026 report, Emaar Development posted revenue of AED 8,821.3 mn, up 14.4% year on year, and net profit of AED 3,506.5 mn (+7.9%). Net margin narrowed to 39.8% from 42.1% a year earlier, and revenue growth decelerated from 32.1% in Q2. With EV/EBITDA at 1.2 against its own three-year average of 3.8 and a dividend yield of 6.8%, the share looks attractive, but the margin weakness and slower growth need confirmation in the next report.
Key takeaways
— Q3 revenue grew 14.4%, but that is half the pace of Q2
— Net profit added only 7.9%, and the margin narrowed to 39.8% from 42.1%
— The company sits on a net cash cushion of AED 39.8 bn, with net debt down AED 4.7 bn over the year
— A dividend yield of 6.8% remains the main support for the shareholder
— EV/EBITDA of 1.2 is 69% below its own three-year average of 3.8
— On the portal's model the share is 18% undervalued versus fair value
Attractiveness
Key figures, AED bn
| Metric | Q3 2025 | Q3 2026 | Change |
|---|---|---|---|
| Revenue | 7.71 | 8.82 | +14.4% |
| EBITDA | 3.79 | — | — |
| Operating profit | 3.79 | 4.06 | +7.2% |
| Net profit | 3.25 | 3.51 | +7.9% |
| Operating cash flow | 3.13 | 2.38 | -23.8% |
| Capex | 0.00 | -0.00 | -129.2% |
| EBITDA margin | 49.2% | — | — |
| Net margin | 42.1% | 39.8% | -2.3 pp |
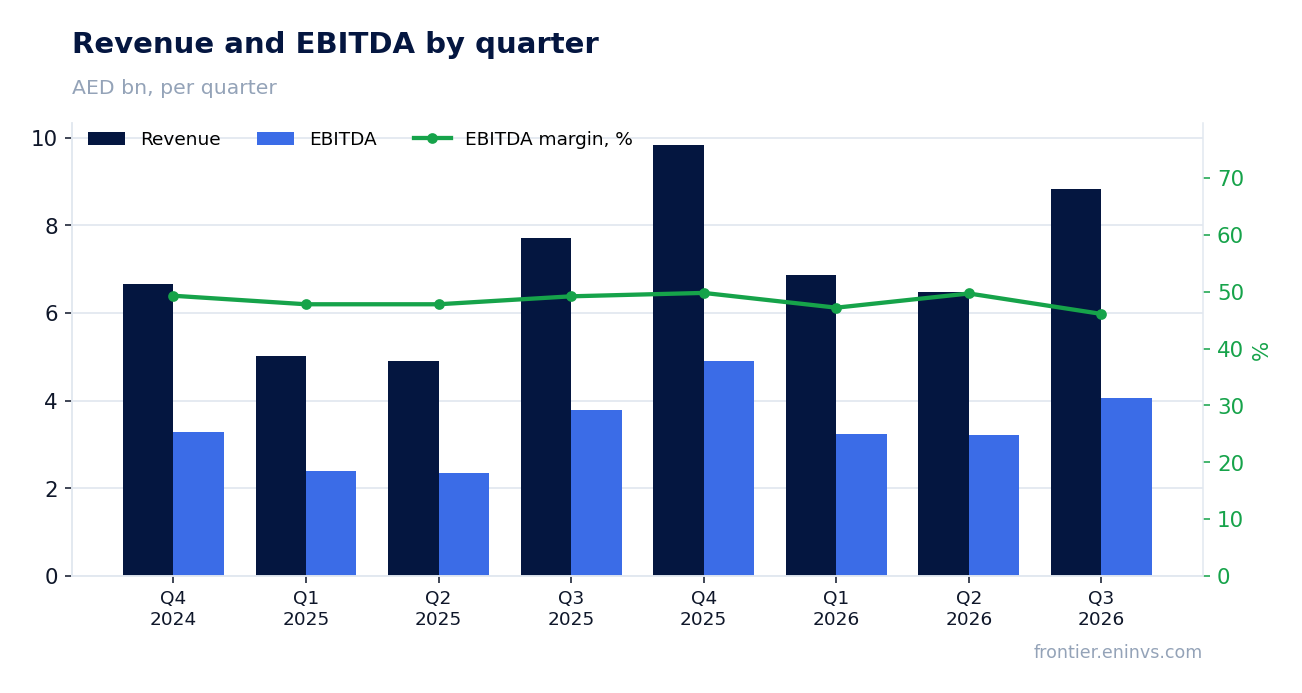
Q3 revenue grew 14.4%, but that is half the pace of Q2
Q3 2026 revenue came in at AED 8,821.3 mn, up 14.4% year on year. That is a marked deceleration from Q2, when growth was 32.1%. In absolute terms, quarterly revenue was the highest in the last four quarters, exceeding the AED 7,713.98 mn of Q3 2025.
Slower growth does not mean a decline – revenue is still growing at a double-digit pace. But the market had grown used to faster rates: growth was 47.6% in Q4 2025 and 36.5% in Q1 2026. The current 14.4% is the weakest quarterly growth in five quarters, which may signal demand saturation or a shift in revenue recognition timing.
The next quarter is key to judging the trend: if growth holds above 10%, the slowdown can be seen as gradual rather than a reversal. For now, revenue dynamics remain positive, but their contribution to the overall picture is weakening.
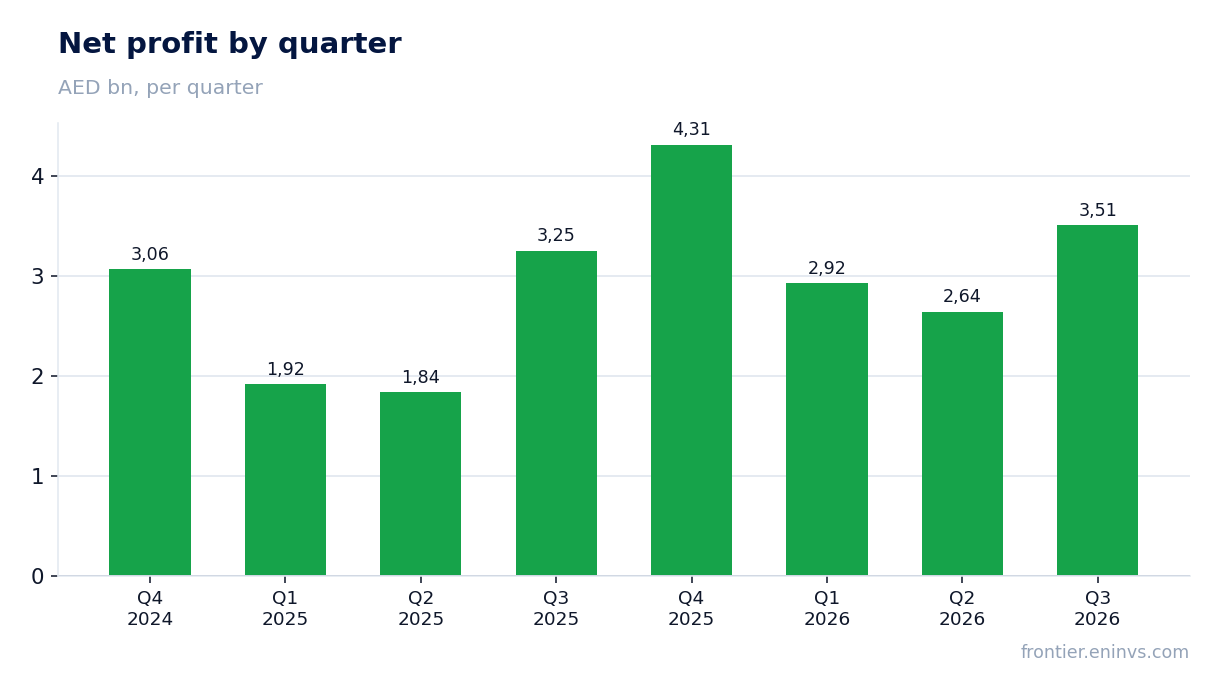
Net profit added only 7.9%, and the margin narrowed to 39.8% from 42.1%
Q3 2026 net profit was AED 3,506.5 mn, up 7.9% year on year. Profit growth lags revenue growth, and the reason is lower profitability: net margin fell to 39.8% from 42.1% in Q3 2025.
A 2.3 percentage point margin contraction alongside 14.4% revenue growth means costs are rising faster than income. Operating profit was AED 4,061.4 mn, and its ratio to revenue also declined. The facts do not disclose cost details, so the exact cause cannot be named, but the effect on profit is clear: each percentage point of margin is worth roughly AED 88 mn of quarterly profit.
For the shareholder, this means that even with double-digit revenue growth, profit may grow more slowly. If the margin continues to decline, the dividend base will come under pressure despite the strong balance sheet.
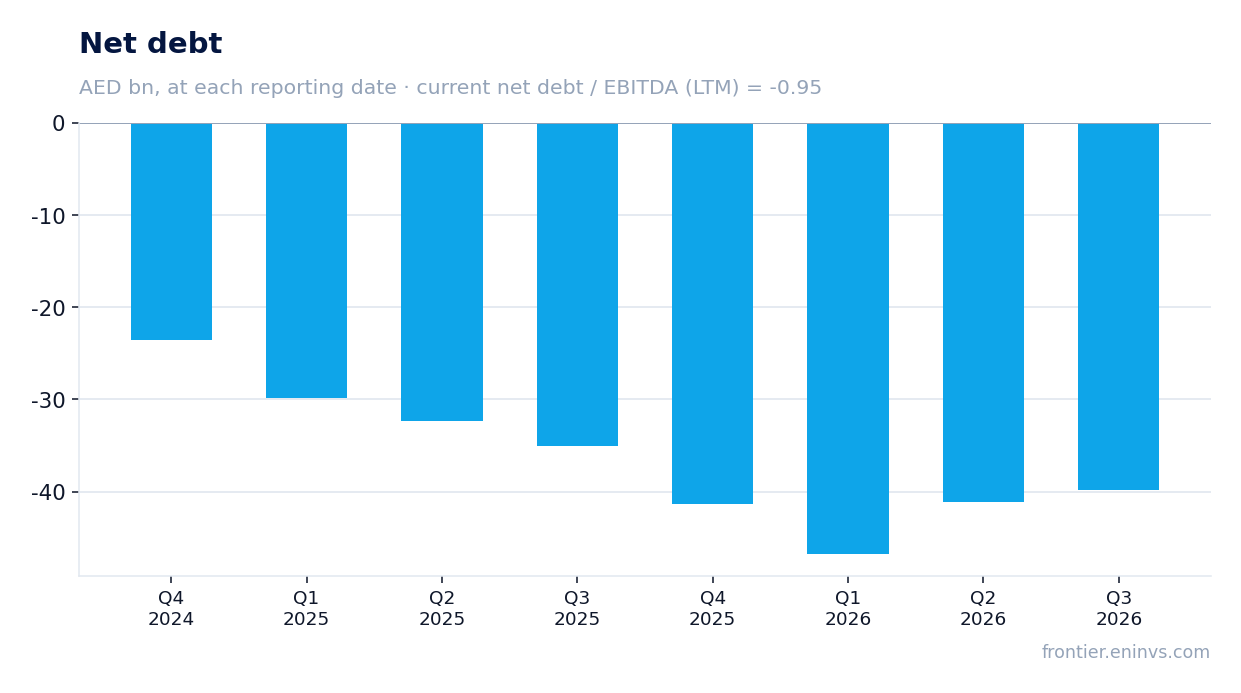
The company sits on a net cash cushion of AED 39.8 bn, with net debt down AED 4.7 bn over the year
Net debt at 30 September 2026 was negative – minus AED 39.8 bn, meaning the company has a net cash position. Over the year, the figure moved from minus AED 35.1 bn on 30 September 2025 to minus AED 39.8 bn, so the cash cushion grew by AED 4.7 bn. Relative to 30 June 2026, net debt was minus AED 41.1 bn, and by the end of Q3 it had decreased by AED 1.3 bn.
The net debt to EBITDA ratio for the trailing twelve months is minus 0.95 – a negative value confirms there is no debt and cash exceeds liabilities. This gives the company a margin of safety to pay dividends and fund construction without borrowing.
Operating cash flow in Q3 was AED 2,382.7 mn, lower than in previous quarters but still positive. Over the last twelve months, operating cash flow reached AED 16,239.2 mn, covering dividend payments and capital expenditures, which were minimal in Q3.
A dividend yield of 6.8% remains the main support for the shareholder
The dividend yield over the last twelve months is 6.8% – one of the key arguments in favour of the share. The company pays dividends out of net profit, which over the last twelve months amounted to AED 13,378.2 mn. With a market capitalisation of AED 58,080 mn, dividend payments for the year are about AED 3,950 mn, corresponding to roughly 30% of net profit.
Our estimate for the current year's dividend assumes the payout ratio stays near 30% and is based on trailing twelve-month profit. However, the margin decline in Q3 may limit profit growth and therefore the dividend. If the margin stays at 39.8%, full-year profit could be lower than in the previous period, creating a risk to the payout size.
A yield of 6.8% looks attractive against current rates, but it is not guaranteed. The company has a net cash position and can sustain payments even with a temporary profit decline, but dividend sustainability depends on a margin recovery.
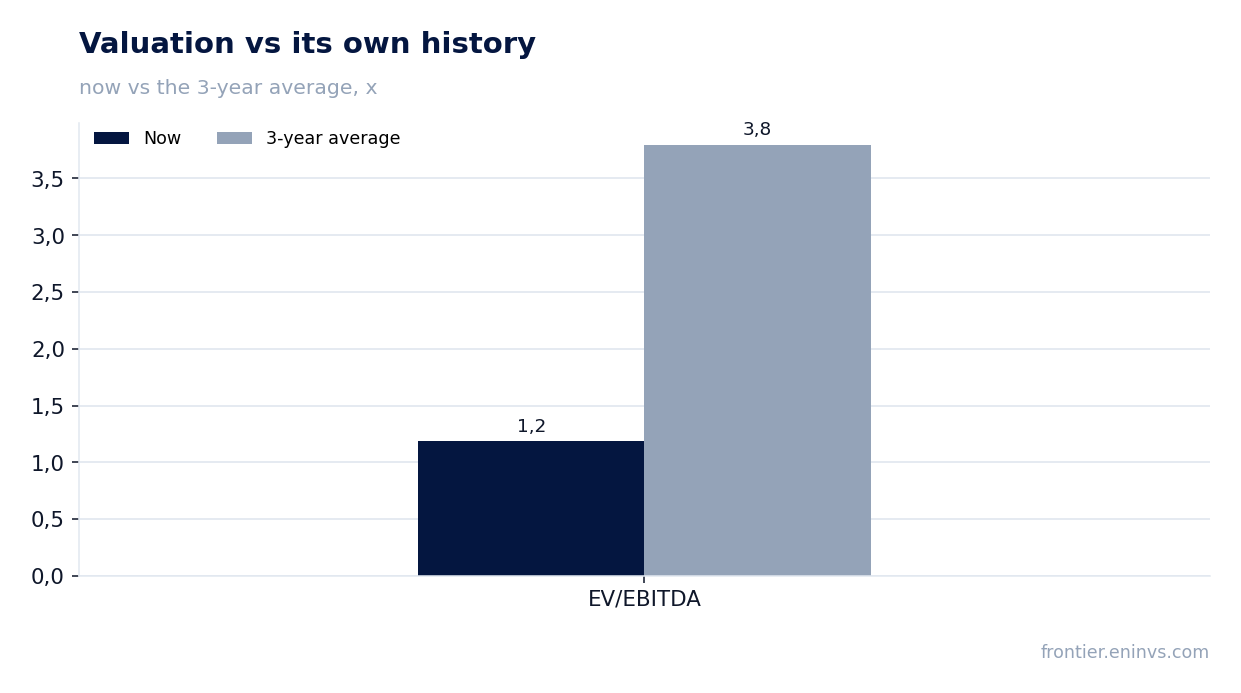
EV/EBITDA of 1.2 is 69% below its own three-year average of 3.8
EV/EBITDA for the trailing twelve months is 1.2, which is 69% below its own three-year average of 3.8. This means the share trades significantly cheaper than its average over the last three years. The trailing P/E is 4.3, also pointing to a low valuation.
Such a low multiple is explained by the combination of high EBITDA (trailing twelve months AED 41,945.1 mn) and a net cash position that reduces enterprise value. The market, however, may be pricing in slower growth and margin compression, which justifies the discount to historical valuation.
On the portal's model, the share's fair value is 18% above the current market price. This is our own calculation based on EBITDA growth and a target multiple, and it is not a consensus forecast. If the company restores its margin and growth rates, the discount could narrow.
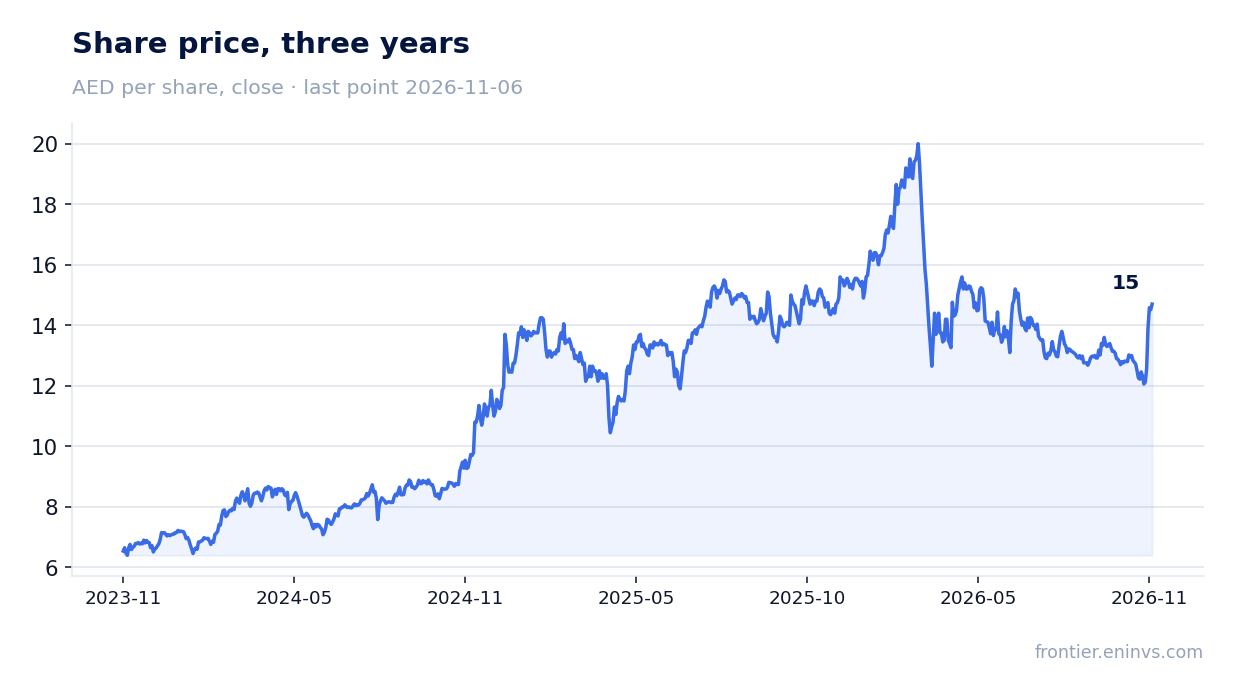
On the portal's model the share is 18% undervalued versus fair value
Our fundamental valuation model, based on EBITDA growth and a target multiple, shows 18% upside to fair value. This is the portal's own calculation, not a market consensus or a target price. The model uses trailing twelve-month EBITDA and historical multiples.
However, the model cannot predict when the discount will close. That requires triggers: margin recovery, faster revenue growth, or higher dividend payouts. While the margin is declining, the market may remain cautious, and the upside will stay unrealised.
Nevertheless, the combination of a low valuation, a net cash position and dividend yield creates asymmetry: downside risk is limited by the strong balance sheet, while upside potential remains significant if performance recovers.
Valuation on the latest reported figures
| Metric | Value |
|---|---|
| Market cap | 58.1 bn AED |
| P/E (LTM) | 4.3 |
| EV/EBITDA (LTM) | 1.2 |
| P/B | 1.41 |
| Net debt / EBITDA (LTM) | -0.95 |
| Operating cash flow (LTM) | 16.2 bn |
| ROE | 30.8% |
| Dividend yield (12m) | 6.8% |
| EV/EBITDA, 3-year average | 3.8 |
Bottom line
The report's strengths are 14.4% revenue growth and a net cash position of AED 39.8 bn, which grew by AED 4.7 bn over the year. However, profit rose only 7.9% due to margin compression to 39.8%, and that is the main question for the shareholder. A dividend yield of 6.8% and EV/EBITDA of 1.2 against a historical average of 3.8 make the share attractive, but realising the upside requires a margin recovery. The verdict is 'rather attractive': the low valuation and dividend outweigh the current slowdown, but without an improvement in profitability, share price growth remains in question.
Open the company's financial profile EMAARDEV →
See also: market overview · valuation map · stock screeners