WEG: revenue growth slows and margin compresses – profit up just 1.2%
WEG reported results for the third quarter of 2026. Revenue came in at USD 2,021.5 mn, up 5.9% year on year, EBITDA at USD 436.5 mn (+3.2%), and net profit at USD 328.1 mn (+1.2%). Growth decelerated from the second quarter (+9.1%), and the EBITDA margin fell to 21.6% from 22.2%. At an EV/EBITDA of 21.5 against its own three-year average of 24.0 and a dividend yield of 4.2%, the share looks rather attractive than not, but slowing growth and margin compression leave room for caution.
Key takeaways
— Revenue grew 5.9% year on year, slower than the 9.1% a quarter earlier
— EBITDA rose 3.2%, lagging revenue, and the margin fell to 21.6% from 22.2%
— Net profit added just 1.2%, with its margin down to 16.2% from 17.0%
— Operating cash flow of USD 264.6 mn comfortably covered capex of USD 160.6 mn
— Net debt is negative: a cash cushion of USD 481.1 mn and net debt/EBITDA of minus 0.28
— A 4.2% dividend yield on trailing-twelve-month payouts remains the main support for valuation
— EV/EBITDA of 21.5 is below its own three-year average of 24.0 – the share is cheaper than its history
Attractiveness
Key figures, USD bn
| Metric | Q3 2025 | Q3 2026 | Change |
|---|---|---|---|
| Revenue | 1.91 | 2.02 | +5.9% |
| EBITDA | 0.42 | 0.44 | +3.2% |
| Operating profit | 0.38 | 0.39 | +2.4% |
| Net profit | 0.32 | 0.33 | +1.2% |
| Operating cash flow | 0.42 | 0.26 | -37.3% |
| Capex | 0.12 | 0.16 | +28.5% |
| EBITDA margin | 22.2% | 21.6% | -0.6 pp |
| Net margin | 17.0% | 16.2% | -0.8 pp |
Revenue grew 5.9% year on year, slower than the 9.1% a quarter earlier
In the third quarter of 2026 WEG's revenue reached USD 2,021.5 mn, up 5.9% year on year. That is a deceleration from the second quarter, when growth was 9.1%. The quarterly trend has been uneven: growth was 5.2% in the first quarter of 2026, 9.1% in the second, and 5.9% now.
Over the trailing twelve months revenue reached USD 7,800.0 mn. That level sets the base for valuation multiples and leverage. Slowing quarterly growth at this scale suggests the company is nearing saturation on its current trajectory, and the next report will show whether this is temporary or the new normal.
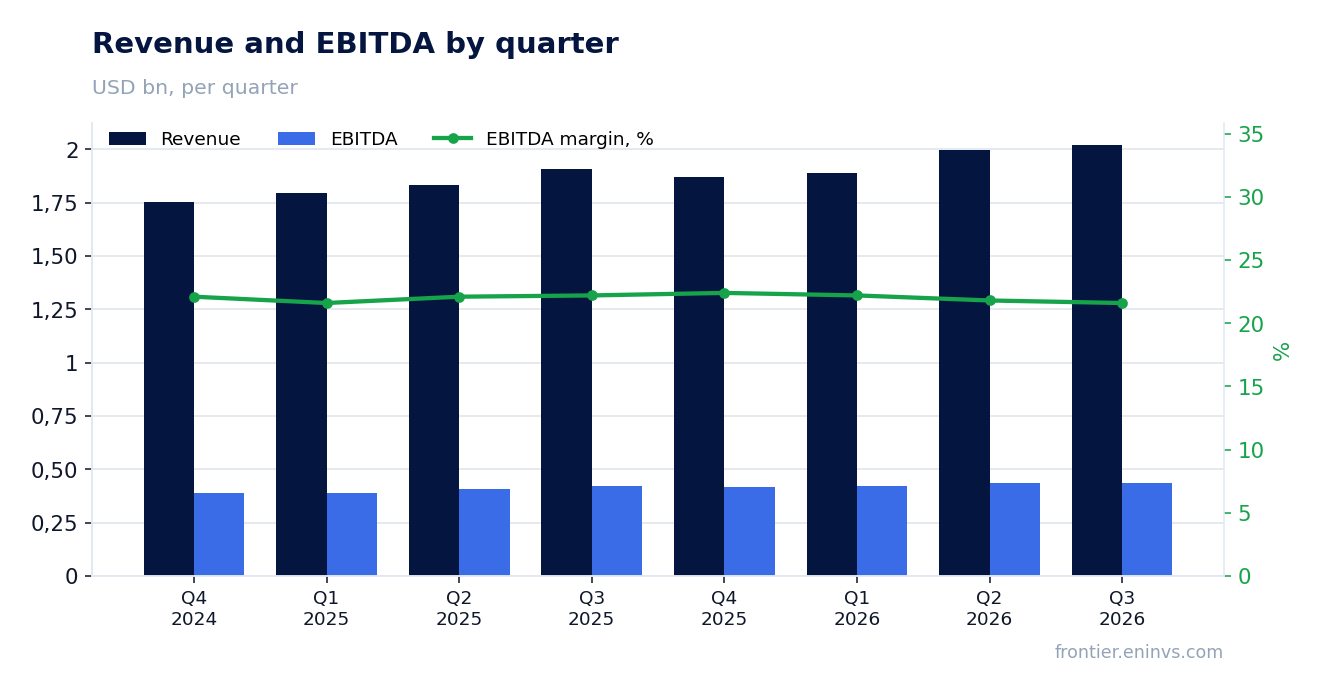
EBITDA rose 3.2%, lagging revenue, and the margin fell to 21.6% from 22.2%
EBITDA for the third quarter of 2026 was USD 436.5 mn, up 3.2% year on year. Revenue over the same period grew 5.9%, meaning costs rose faster than income. The EBITDA margin fell to 21.6% from 22.2% a year earlier.
Operating profit was USD 387.6 mn on revenue of USD 2,021.5 mn. The gap between revenue and EBITDA growth points to cost pressure, though the facts do not identify the specific expense line. Over the trailing twelve months EBITDA reached USD 1,709.4 mn, and that is the base used for leverage.
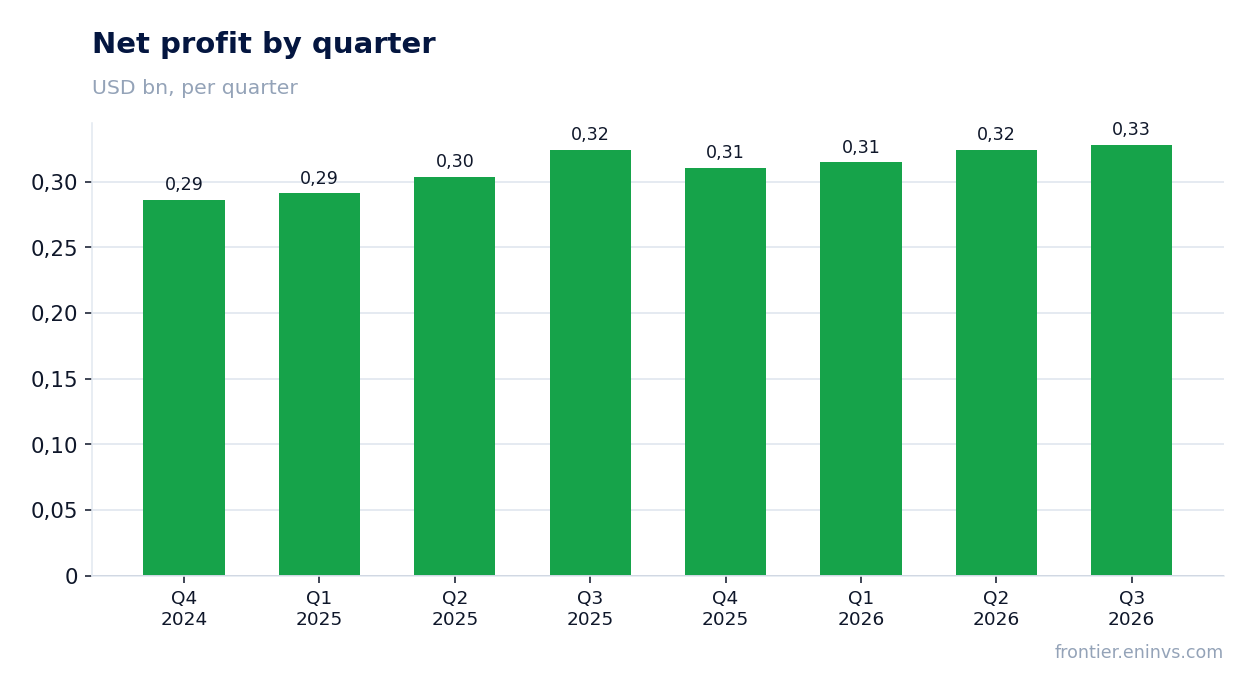
Net profit added just 1.2%, with its margin down to 16.2% from 17.0%
Net profit for the third quarter of 2026 was USD 328.1 mn, just 1.2% above the year-earlier result. The net margin fell to 16.2% from 17.0%. The compression at the net level is sharper than at the EBITDA level, indicating additional pressure below the operating line.
Over the trailing twelve months net profit was USD 1,277.8 mn. Against a market capitalisation of USD 37,175.3 mn that gives a P/E LTM of 29.1. Profit is growing, but its growth lags revenue, and that is a key argument for a cautious assessment.
Operating cash flow of USD 264.6 mn comfortably covered capex of USD 160.6 mn
Operating cash flow for the third quarter of 2026 was USD 264.6 mn, capital expenditures USD 160.6 mn. The USD 104.0 mn difference remained at the company's disposal after investment. That is a healthy ratio: the flow covers capex about 1.6 times.
Over the trailing twelve months operating cash flow reached USD 1,154.3 mn. On that base the company funds investment and dividends from its own resources without resorting to debt. This supports the assessment of business resilience, though quarterly flow is volatile.
Net debt is negative: a cash cushion of USD 481.1 mn and net debt/EBITDA of minus 0.28
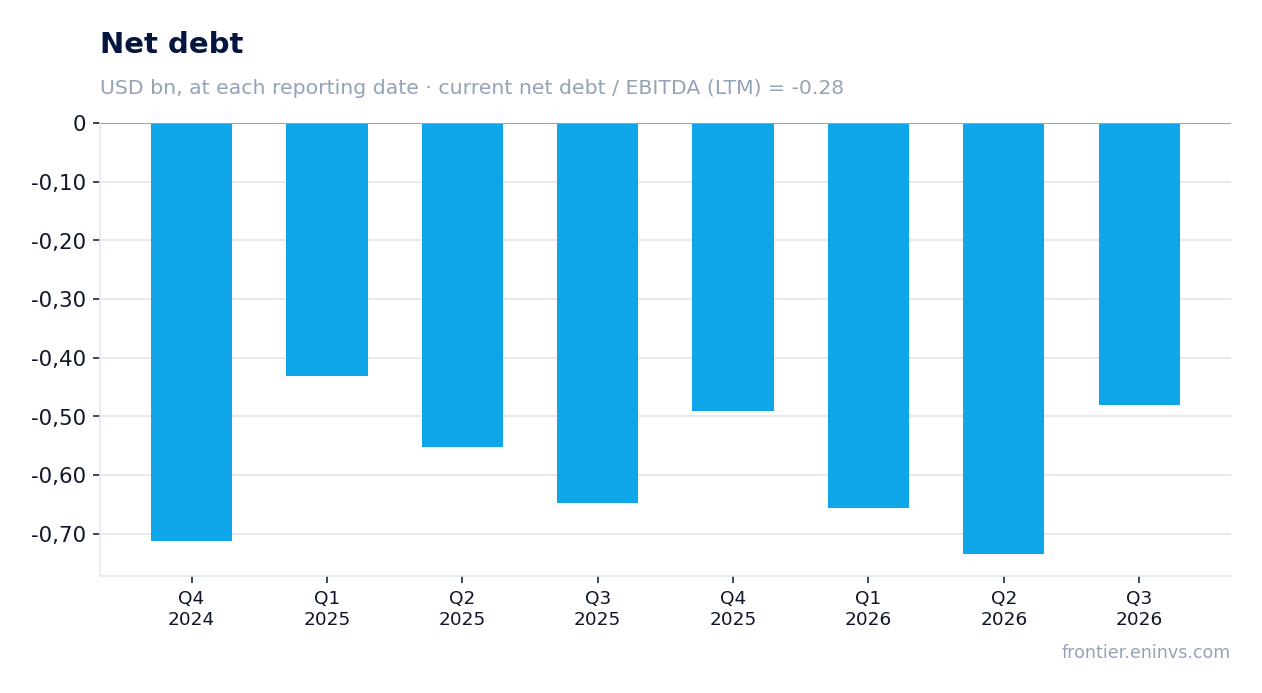
As of 30 September 2026 WEG's net debt stood at minus USD 481.1 mn, meaning the company holds a net cash position. The net debt/EBITDA ratio for the trailing twelve months is minus 0.28. That is a level, not a direction: the facts contain no comparison with earlier values.
Over the quarter net debt moved from minus USD 0.7 bn on 30 June 2026 to minus USD 0.5 bn on 30 September 2026 (+USD 0.3 bn). Over twelve months it moved from minus USD 0.6 bn on 30 September 2025 to minus USD 0.5 bn (+USD 0.2 bn). The cash cushion remains substantial, and debt financing is not a constraint on the business.
A 4.2% dividend yield on trailing-twelve-month payouts remains the main support for valuation
The dividend yield over the trailing twelve months is 4.2%. That is a substantial part of the share's total return at the current price. Payouts are covered by operating cash flow, which over the trailing twelve months was USD 1,154.3 mn.
Our estimate of the current-year dividend rests on trailing-twelve-month profit of USD 1,277.8 mn and established payout practice. The risk to the dividend is further margin compression: if net profit stops growing, the company may revise the payout. At a 4.2% yield the share offers a premium to the risk-free rate, but not a record one.
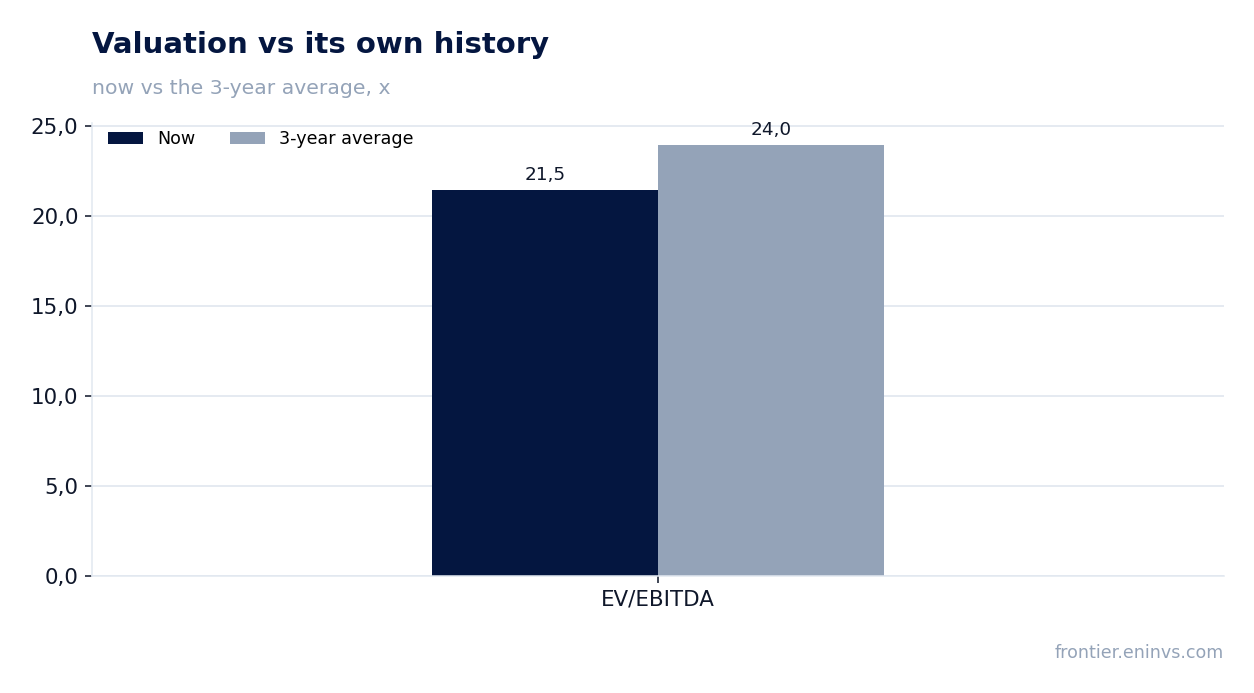
EV/EBITDA of 21.5 is below its own three-year average of 24.0 – the share is cheaper than its history
The trailing-twelve-month EV/EBITDA multiple is 21.5 against its own three-year average of 24.0. The share trades 10% below its historical valuation on this multiple. That is the only comparison with history supported by the facts.
P/E LTM is 29.1, and market capitalisation is USD 37,175.3 mn. On the portal's model the upside to fair value is estimated at +2%. That is our own estimate, not market consensus. The combination of a discount to its own history and modest upside suggests the valuation is broadly fair but leaves little room.
Valuation on the latest reported figures
| Metric | Value |
|---|---|
| Market cap | 37.2 bn USD |
| P/E (LTM) | 29.1 |
| EV/EBITDA (LTM) | 21.5 |
| P/B | 10.97 |
| Net debt / EBITDA (LTM) | -0.28 |
| Operating cash flow (LTM) | 1.15 bn |
| ROE | 33.0% |
| Dividend yield (12m) | 4.2% |
| EV/EBITDA, 3-year average | 24.0 |
Bottom line
The report's strength remains its cash position: net debt is negative and operating flow comfortably covers capex. The weakness is in the dynamics: revenue is growing more slowly, the margin is compressing, and profit added just 1.2%. A 4.2% dividend yield and a discount to its own history on EV/EBITDA support the valuation, but the portal model's upside is only +2%. The verdict is rather attractive: the share is cheaper than its history and pays a dividend, but slowing growth and margin compression prevent calling it outright attractive.
Open the company's financial profile WEGE →
See also: market overview · valuation map · stock screeners