Atalaya Mining: copper up a third, but the company earned twice what the price implied
Contents
On 14 November Atalaya Mining released its third-quarter 2026 results. The average copper price in the period was USD 14,408 versus USD 10,825 a year earlier (+33.1%), while spot is now USD 13,530, 6.1% below the quarterly average. Revenue reached USD 215.7m (+72.8% YoY), EBITDA USD 105.7m (+215.9%) and net profit USD 72.3m (+466.0%). At year-ago volumes and costs and moving only prices, our calculation puts revenue at USD 164.1m and EBITDA at USD 63.1m; the reported figures are USD 51.6m and USD 42.6m higher respectively. Our conclusion: rather attractive – the portal model puts the upside to fair value at +18%. Our view: the share is rather attractive at the current price; upside on the portal model +18%.
Our view: is there upside
Our view in numbers
| Metric | Our read |
|---|---|
| Verdict | Rather attractive |
| Upside on the portal model | +18% |
| How the model works | spot model: EBITDA re-priced to current commodity prices at the target EV/EBITDA, against market cap |
| Dividend yield, 12m | 1.2% |
| Net debt / EBITDA | -1.20 – net cash |
| Strongest case for | On the portal model the share trades 18% below fair value, with EV/EBITDA LTM at 4.9 against net cash of USD 388.5m and a 30.3% return on equity. |
| Strongest case against | Copper spot at USD 13,530 is already 6.1% below the quarterly average, and USD 42.6m of EBITDA above the price-implied figure rests on volumes and costs the facts do not break out. |
| What would change the view | If copper stays below USD 13,530 on spot, the verdict moves one step down to 'fairly valued'; a return to the period average of USD 14,408 would restore the +18% upside and more. |
Key takeaways
— Copper averaged USD 14,408 in the quarter – 33.1% above a year earlier – but spot is already 6.1% below that
— By our calculation, price explains only USD 63.1m of the USD 105.7m EBITDA – volumes and costs delivered the rest
— Revenue growth accelerated from +20.9% in Q2 to +72.8% in Q3
— EBITDA margin rose to 49.0% from 26.8%, and net margin to 33.5% from 10.2%
— Net cash of USD 388.5m is 1.2x annual EBITDA, leaving room for both dividends and capex
— The trailing dividend yield is 1.2%, and the payout rests on profit rather than a one-off sale
— On the portal model the share trades 18% below fair value, with EV/EBITDA LTM at 4.9
Key figures, USD bn
| Metric | Q3 2025 | Q3 2026 | Change |
|---|---|---|---|
| Revenue | 0.12 | 0.22 | +72.8% |
| EBITDA | 0.03 | 0.11 | +215.9% |
| Operating profit | 0.02 | 0.08 | +345.2% |
| Net profit | 0.01 | 0.07 | +466.0% |
| Operating cash flow | 0.05 | 0.07 | +34.2% |
| EBITDA margin | 26.8% | 49.0% | +22.2 pp |
| Net margin | 10.2% | 33.5% | +23.3 pp |
Copper averaged USD 14,408 in the quarter – 33.1% above a year earlier – but spot is already 6.1% below that
The average copper price in Q3 2026 was USD 14,408 versus USD 10,825 a year earlier, up 33.1%. Against the previous quarter the price added 5.3%, from USD 13,682. For a company where copper accounts for 95% of revenue in the portal model, this is the main external driver of the report.
Spot on 14 November is USD 13,530, 6.1% below the quarterly average. The quarter's revenue and EBITDA were therefore earned at prices the market no longer confirms. The next report will land on a more modest price base if spot does not recover.
Commodity prices: period average and now
| Benchmark | Year ago | Q3 2026 | YoY | Spot 2026-11-14 |
|---|---|---|---|---|
| Copper, USD | 10 825 | 14 408 | +33,1% | 13 530 |
| US Diesel Index (EIA) (input cost), USD | 3,75 | 5,45 | +45,3% | 6,13 |
| Electricity Spot (input cost), USD | 62,9 | 102,8 | +63,3% | 78,8 |
By our calculation, price explains only USD 63.1m of the USD 105.7m EBITDA – volumes and costs delivered the rest
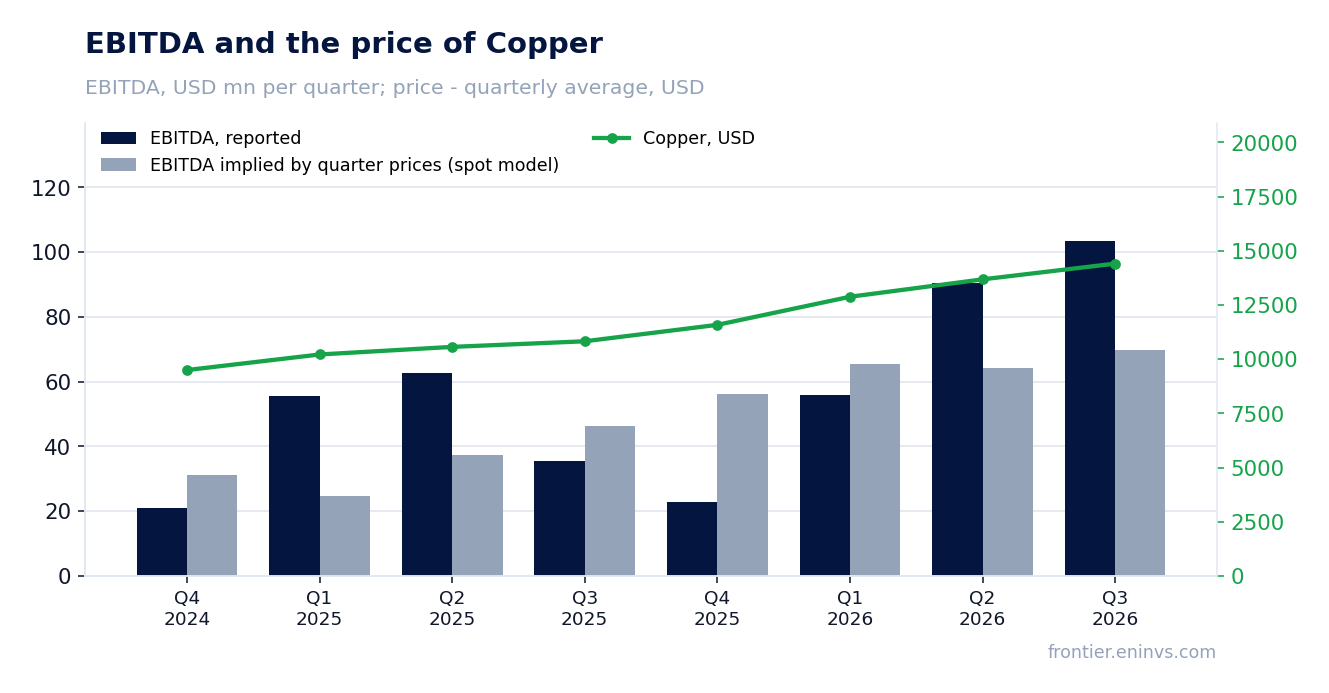
Holding Q3 2025 volumes and costs and moving only prices, revenue would have been USD 164.1m and EBITDA USD 63.1m. The company actually reported USD 215.7m of revenue and USD 105.7m of EBITDA – USD 51.6m and USD 42.6m above the price-implied figures respectively.
The USD 42.6m EBITDA gap cannot be explained by the copper price alone. Its sources are production volumes, the realised price against the benchmark, unit costs and one-off items; the facts and the source document do not specify them, so we record the gap itself rather than attribute it to a single factor.
The portal's spot model, re-priced from the average of the previous four quarters, expected EBITDA of USD 69.9m and revenue of USD 167.7m. The reported figures beat the model by 51.2% on EBITDA and 28.7% on revenue. The deviation of actual from model in the four preceding periods was -27.9%, -59.4%, -11.8% and +45.8% – the model has historically erred in both directions on this issuer.
What the prices implied and what the company earned
| Base (Q3 2025) | Implied at period prices | Reported | Reported vs implied | |
|---|---|---|---|---|
| Revenue, USD mn | 124,8 | 164,1 | 215,7 | +31,5% |
| EBITDA, USD mn | 33,5 | 63,1 | 105,7 | +67,5% |
| EBITDA, portal spot model, USD mn | — | 69,9 | 105,7 | +51,2% |
Revenue and EBITDA by quarter
| Period | Measure | bn USD |
|---|---|---|
| Q4 2024 | Revenue | 0.08300400000000001 |
| Q1 2025 | Revenue | 0.138002 |
| Q2 2025 | Revenue | 0.141221 |
| Q3 2025 | Revenue | 0.124821 |
| Q4 2025 | Revenue | 0.141427 |
| Q1 2026 | Revenue | 0.136434 |
| Q2 2026 | Revenue | 0.170737 |
| Q3 2026 | Revenue | 0.215705 |
| Q4 2024 | EBITDA | 0.020893000000000002 |
| Q1 2025 | EBITDA | 0.055462000000000004 |
| Q2 2025 | EBITDA | 0.062686 |
| Q3 2025 | EBITDA | 0.035419 |
| Q4 2025 | EBITDA | 0.022810000000000004 |
| Q1 2026 | EBITDA | 0.055881 |
| Q2 2026 | EBITDA | 0.090514 |
| Q3 2026 | EBITDA | 0.10355099999999999 |
EBITDA margin
| Period | Measure | % |
|---|---|---|
| Q4 2024 | EBITDA margin | 25.2 |
| Q1 2025 | EBITDA margin | 40.2 |
| Q2 2025 | EBITDA margin | 44.4 |
| Q3 2025 | EBITDA margin | 28.4 |
| Q4 2025 | EBITDA margin | 16.1 |
| Q1 2026 | EBITDA margin | 41.0 |
| Q2 2026 | EBITDA margin | 53.0 |
| Q3 2026 | EBITDA margin | 48.0 |
Revenue growth accelerated from +20.9% in Q2 to +72.8% in Q3
Q3 revenue was USD 215.7m, 72.8% above a year earlier. In Q2 growth was 20.9%, so this is an acceleration. Against the previous quarter revenue added 26.4%, from USD 170.7m.
The acceleration coincided with copper up 33.1% YoY and 5.3% QoQ, but price alone does not explain it: at unchanged volumes and costs our calculation gives revenue growth of only 31.4%. The rest came from volumes and the realised price, which the facts do not break out.
EBITDA margin rose to 49.0% from 26.8%, and net margin to 33.5% from 10.2%
EBITDA was USD 105.7m on revenue of USD 215.7m, a 49.0% margin versus 26.8% a year earlier. Net profit was USD 72.3m, a 33.5% net margin versus 10.2%. Such margin expansion with more expensive copper means revenue grew faster than costs.
Diesel and electricity costs also rose in the period: diesel to USD 5.454 from USD 3.754 a year earlier (+45.3%), electricity to USD 102.8 from USD 62.9 (+63.3%). By our calculation these dearer inputs added USD 9.6m to costs, so they weighed on the margin rather than supporting it. The expansion came from the revenue side and from unit costs per tonne, not from energy savings.
Net cash of USD 388.5m is 1.2x annual EBITDA, leaving room for both dividends and capex
At 30 September 2026 net cash stood at USD 388.5m – debt net of cash. That is 1.2x trailing-twelve-month EBITDA of USD 323.1m. The company runs on net cash rather than debt, and interest costs do not weigh on profit.
Operating cash flow was USD 65.5m in the quarter and USD 275.8m over the last twelve months. Capex in the quarter was USD 24.3m – reinvestment that sustains production. Free cash flow for the quarter was therefore about USD 41.2m, enough for both dividends and maintaining output.
The trailing dividend yield is 1.2%, and the payout rests on profit rather than a one-off sale
The trailing twelve-month dividend yield is 1.2% on a market cap of USD 1,717.6m. Payouts rest on profit: net profit over the last twelve months was USD 186.8m, and the dividend is a small share of it. No one-off asset sale is visible in the profit, so the payout base is stable.
Our estimate for the current year's dividend is a yield of about 1.2% if the company keeps its current payout ratio; it hinges on quarterly profit and on a policy the facts do not detail. The yield is modest against the key rate, but the payout is covered by net cash and needs no borrowing. A fall in the copper price could cut the payout: spot is already 6.1% below the quarterly average.
Share price, three years
close, last point 2026-11-13
| Period | Measure | USD per share |
|---|---|---|
| 2025-11-13 | Closing price | 689.0 |
| 2025-11-14 | Closing price | 673.0 |
| 2025-11-17 | Closing price | 652.0 |
| 2025-11-18 | Closing price | 647.0 |
| 2025-11-19 | Closing price | 647.0 |
| 2025-11-20 | Closing price | 679.0 |
| 2025-11-21 | Closing price | 657.0 |
| 2025-11-24 | Closing price | 685.0 |
| 2025-11-25 | Closing price | 694.0 |
| 2025-11-26 | Closing price | 695.0 |
| 2025-11-27 | Closing price | 694.0 |
| 2025-11-28 | Closing price | 711.0 |
| 2025-12-01 | Closing price | 730.0 |
| 2025-12-02 | Closing price | 725.0 |
| 2025-12-03 | Closing price | 741.0 |
| 2025-12-04 | Closing price | 759.0 |
| 2025-12-05 | Closing price | 750.0 |
| 2025-12-08 | Closing price | 749.0 |
| 2025-12-09 | Closing price | 754.0 |
| 2025-12-10 | Closing price | 752.0 |
| 2025-12-11 | Closing price | 774.0 |
| 2025-12-12 | Closing price | 762.0 |
| 2025-12-15 | Closing price | 776.0 |
| 2025-12-16 | Closing price | 771.0 |
| 2025-12-17 | Closing price | 786.0 |
| 2025-12-18 | Closing price | 796.0 |
| 2025-12-19 | Closing price | 804.0 |
| 2025-12-22 | Closing price | 820.0 |
| 2025-12-23 | Closing price | 827.0 |
| 2025-12-24 | Closing price | 816.0 |
| 2025-12-29 | Closing price | 826.0 |
| 2025-12-30 | Closing price | 860.0 |
| 2025-12-31 | Closing price | 855.0 |
| 2026-01-02 | Closing price | 847.0 |
| 2026-01-05 | Closing price | 899.0 |
| 2026-01-06 | Closing price | 934.0 |
| 2026-01-07 | Closing price | 878.0 |
| 2026-01-08 | Closing price | 865.0 |
| 2026-01-09 | Closing price | 885.0 |
| 2026-01-12 | Closing price | 931.0 |
| 2026-01-13 | Closing price | 910.0 |
| 2026-01-14 | Closing price | 927.0 |
| 2026-01-15 | Closing price | 933.0 |
| 2026-01-16 | Closing price | 920.0 |
| 2026-01-19 | Closing price | 945.0 |
| 2026-01-20 | Closing price | 943.0 |
| 2026-01-21 | Closing price | 956.0 |
| 2026-01-22 | Closing price | 956.0 |
| 2026-01-23 | Closing price | 985.0 |
| 2026-01-26 | Closing price | 1050.0 |
| 2026-01-27 | Closing price | 1074.0 |
| 2026-01-28 | Closing price | 1036.0 |
| 2026-01-29 | Closing price | 1038.0 |
| 2026-01-30 | Closing price | 1028.0 |
| 2026-02-02 | Closing price | 993.0 |
| 2026-02-03 | Closing price | 1028.0 |
| 2026-02-04 | Closing price | 927.0 |
| 2026-02-05 | Closing price | 922.0 |
| 2026-02-06 | Closing price | 918.0 |
| 2026-02-09 | Closing price | 951.0 |
| 2026-02-10 | Closing price | 929.0 |
| 2026-02-11 | Closing price | 952.0 |
| 2026-02-12 | Closing price | 941.0 |
| 2026-02-13 | Closing price | 944.0 |
| 2026-02-16 | Closing price | 949.0 |
| 2026-02-17 | Closing price | 950.0 |
| 2026-02-18 | Closing price | 997.0 |
| 2026-02-19 | Closing price | 978.0 |
| 2026-02-20 | Closing price | 987.0 |
| 2026-02-23 | Closing price | 999.0 |
| 2026-02-24 | Closing price | 1026.0 |
| 2026-02-25 | Closing price | 1050.0 |
| 2026-02-26 | Closing price | 1006.0 |
| 2026-02-27 | Closing price | 1028.0 |
| 2026-03-02 | Closing price | 1014.0 |
| 2026-03-03 | Closing price | 956.0 |
| 2026-03-04 | Closing price | 966.0 |
| 2026-03-05 | Closing price | 926.0 |
| 2026-03-06 | Closing price | 904.0 |
| 2026-03-09 | Closing price | 884.0 |
| 2026-03-10 | Closing price | 942.0 |
| 2026-03-11 | Closing price | 919.0 |
| 2026-03-12 | Closing price | 891.0 |
| 2026-03-13 | Closing price | 837.0 |
| 2026-03-16 | Closing price | 834.0 |
| 2026-03-17 | Closing price | 824.0 |
| 2026-03-18 | Closing price | 817.0 |
| 2026-03-19 | Closing price | 712.0 |
| 2026-03-20 | Closing price | 696.0 |
| 2026-03-23 | Closing price | 715.0 |
| 2026-03-24 | Closing price | 701.0 |
| 2026-03-25 | Closing price | 729.0 |
| 2026-03-26 | Closing price | 710.0 |
| 2026-03-27 | Closing price | 699.0 |
| 2026-03-30 | Closing price | 682.0 |
| 2026-03-31 | Closing price | 709.0 |
| 2026-04-01 | Closing price | 748.0 |
| 2026-04-02 | Closing price | 744.0 |
| 2026-04-07 | Closing price | 732.5 |
| 2026-04-08 | Closing price | 786.0 |
| 2026-04-09 | Closing price | 768.0 |
| 2026-04-10 | Closing price | 794.0 |
| 2026-04-13 | Closing price | 805.5 |
| 2026-04-14 | Closing price | 809.0 |
| 2026-04-15 | Closing price | 798.0 |
| 2026-04-16 | Closing price | 786.5 |
| 2026-04-17 | Closing price | 821.0 |
| 2026-04-20 | Closing price | 798.0 |
| 2026-04-21 | Closing price | 768.5 |
| 2026-04-22 | Closing price | 770.5 |
| 2026-04-23 | Closing price | 779.0 |
| 2026-04-24 | Closing price | 760.0 |
| 2026-04-27 | Closing price | 762.5 |
| 2026-04-28 | Closing price | 741.0 |
| 2026-04-29 | Closing price | 730.5 |
| 2026-04-30 | Closing price | 743.0 |
| 2026-05-01 | Closing price | 745.5 |
| 2026-05-05 | Closing price | 740.5 |
| 2026-05-06 | Closing price | 789.5 |
| 2026-05-07 | Closing price | 814.0 |
| 2026-05-08 | Closing price | 815.0 |
| 2026-05-11 | Closing price | 858.5 |
| 2026-05-12 | Closing price | 847.0 |
| 2026-05-13 | Closing price | 884.5 |
| 2026-05-14 | Closing price | 877.0 |
| 2026-05-15 | Closing price | 813.0 |
| 2026-05-18 | Closing price | 816.0 |
| 2026-05-19 | Closing price | 776.0 |
| 2026-05-20 | Closing price | 783.0 |
| 2026-05-21 | Closing price | 796.5 |
| 2026-05-22 | Closing price | 789.5 |
| 2026-05-26 | Closing price | 816.0 |
| 2026-05-27 | Closing price | 837.5 |
| 2026-05-28 | Closing price | 863.0 |
| 2026-05-29 | Closing price | 875.0 |
| 2026-06-01 | Closing price | 860.0 |
| 2026-06-02 | Closing price | 877.0 |
| 2026-06-03 | Closing price | 858.0 |
| 2026-06-04 | Closing price | 841.5 |
| 2026-06-05 | Closing price | 788.0 |
| 2026-06-08 | Closing price | 784.5 |
| 2026-06-09 | Closing price | 757.5 |
| 2026-06-10 | Closing price | 757.5 |
| 2026-06-11 | Closing price | 763.5 |
| 2026-06-12 | Closing price | 812.5 |
| 2026-06-15 | Closing price | 880.0 |
| 2026-06-16 | Closing price | 885.5 |
| 2026-06-17 | Closing price | 889.0 |
| 2026-06-18 | Closing price | 880.0 |
| 2026-06-19 | Closing price | 850.0 |
| 2026-06-22 | Closing price | 846.5 |
| 2026-06-23 | Closing price | 809.0 |
| 2026-06-24 | Closing price | 784.0 |
| 2026-06-25 | Closing price | 786.5 |
| 2026-06-26 | Closing price | 808.5 |
| 2026-06-29 | Closing price | 784.5 |
| 2026-06-30 | Closing price | 816.5 |
| 2026-07-01 | Closing price | 813.0 |
| 2026-07-02 | Closing price | 799.5 |
| 2026-07-03 | Closing price | 822.0 |
| 2026-07-06 | Closing price | 820.0 |
| 2026-07-07 | Closing price | 788.5 |
| 2026-07-08 | Closing price | 740.0 |
| 2026-07-09 | Closing price | 773.0 |
| 2026-07-10 | Closing price | 800.0 |
| 2026-07-13 | Closing price | 795.0 |
| 2026-07-14 | Closing price | 847.0 |
| 2026-07-15 | Closing price | 835.5 |
| 2026-07-16 | Closing price | 807.0 |
| 2026-07-17 | Closing price | 797.0 |
| 2026-07-20 | Closing price | 817.5 |
| 2026-07-21 | Closing price | 881.0 |
| 2026-07-22 | Closing price | 927.0 |
| 2026-07-23 | Closing price | 901.5 |
| 2026-07-24 | Closing price | 905.0 |
| 2026-07-27 | Closing price | 905.5 |
| 2026-07-28 | Closing price | 890.5 |
| 2026-07-29 | Closing price | 883.5 |
| 2026-07-30 | Closing price | 885.5 |
| 2026-07-31 | Closing price | 885.5 |
| 2026-08-03 | Closing price | 879.0 |
| 2026-08-04 | Closing price | 917.0 |
| 2026-08-05 | Closing price | 960.0 |
| 2026-08-06 | Closing price | 954.0 |
| 2026-08-07 | Closing price | 968.5 |
| 2026-08-10 | Closing price | 992.0 |
| 2026-08-11 | Closing price | 994.5 |
| 2026-08-12 | Closing price | 957.5 |
| 2026-08-13 | Closing price | 921.5 |
| 2026-08-14 | Closing price | 917.0 |
| 2026-08-17 | Closing price | 925.0 |
| 2026-08-18 | Closing price | 908.0 |
| 2026-08-19 | Closing price | 939.0 |
| 2026-08-20 | Closing price | 939.5 |
| 2026-08-21 | Closing price | 1000.0 |
| 2026-08-24 | Closing price | 1010.0 |
| 2026-08-25 | Closing price | 1030.0 |
| 2026-08-26 | Closing price | 1057.0 |
| 2026-08-27 | Closing price | 1100.0 |
| 2026-08-28 | Closing price | 1109.0 |
| 2026-09-01 | Closing price | 1041.0 |
| 2026-09-02 | Closing price | 1025.0 |
| 2026-09-03 | Closing price | 1058.0 |
| 2026-09-04 | Closing price | 1046.0 |
| 2026-09-07 | Closing price | 1033.0 |
| 2026-09-08 | Closing price | 1068.0 |
| 2026-09-09 | Closing price | 1036.0 |
| 2026-09-10 | Closing price | 988.5 |
| 2026-09-11 | Closing price | 975.0 |
| 2026-09-14 | Closing price | 924.5 |
| 2026-09-15 | Closing price | 918.5 |
| 2026-09-16 | Closing price | 943.5 |
| 2026-09-17 | Closing price | 1004.0 |
| 2026-09-18 | Closing price | 1008.0 |
| 2026-09-21 | Closing price | 1015.0 |
| 2026-09-22 | Closing price | 1070.0 |
| 2026-09-23 | Closing price | 1045.0 |
| 2026-09-24 | Closing price | 1030.0 |
| 2026-09-25 | Closing price | 1036.0 |
| 2026-09-28 | Closing price | 1042.0 |
| 2026-09-29 | Closing price | 1055.0 |
| 2026-09-30 | Closing price | 1080.0 |
| 2026-10-01 | Closing price | 1042.0 |
| 2026-10-02 | Closing price | 1043.0 |
| 2026-10-05 | Closing price | 1055.0 |
| 2026-10-06 | Closing price | 1032.0 |
| 2026-10-07 | Closing price | 1006.0 |
| 2026-10-08 | Closing price | 1016.0 |
| 2026-10-09 | Closing price | 1072.0 |
| 2026-10-12 | Closing price | 1075.0 |
| 2026-10-13 | Closing price | 1065.0 |
| 2026-10-14 | Closing price | 1027.0 |
| 2026-10-15 | Closing price | 988.0 |
| 2026-10-16 | Closing price | 968.0 |
| 2026-10-19 | Closing price | 929.5 |
| 2026-10-20 | Closing price | 920.5 |
| 2026-10-21 | Closing price | 890.5 |
| 2026-10-22 | Closing price | 824.5 |
| 2026-10-23 | Closing price | 799.5 |
| 2026-10-26 | Closing price | 841.0 |
| 2026-10-27 | Closing price | 882.0 |
| 2026-10-28 | Closing price | 869.5 |
| 2026-10-29 | Closing price | 865.5 |
| 2026-10-30 | Closing price | 822.5 |
| 2026-11-02 | Closing price | 862.5 |
| 2026-11-03 | Closing price | 824.5 |
| 2026-11-04 | Closing price | 852.5 |
| 2026-11-05 | Closing price | 832.5 |
| 2026-11-06 | Closing price | 826.5 |
| 2026-11-09 | Closing price | 878.5 |
| 2026-11-10 | Closing price | 843.0 |
| 2026-11-11 | Closing price | 872.5 |
| 2026-11-12 | Closing price | 851.5 |
| 2026-11-13 | Closing price | 833.5 |
On the portal model the share trades 18% below fair value, with EV/EBITDA LTM at 4.9
On the portal model, which re-prices EBITDA to current copper prices at a target EV/EBITDA, fair value is 18% above the market. This is our own estimate, not a consensus. EV/EBITDA over the last twelve months is 4.9, P/E 9.2 and return on equity 30.3%.
At current copper prices the portal spot model gives annual EBITDA of USD 269.4m versus USD 279.9m over the last twelve months, 3.7% lower. EV/EBITDA at current prices is 4.9, and net cash is 1.44x annual EBITDA. The valuation rests on the current copper price of USD 13,530; a return to the period average of USD 14,408 would lift both earnings and the valuation.
Valuation on the latest reported figures
| Metric | Value |
|---|---|
| Market cap | 1.72 bn USD |
| P/E (LTM) | 9.2 |
| EV/EBITDA (LTM) | 4.9 |
| P/B | 2.48 |
| Net debt / EBITDA (LTM) | -1.20 |
| Operating cash flow (LTM) | 0.28 bn |
| ROE | 30.3% |
| Dividend yield (12m) | 1.2% |
Net profit by quarter
| Period | Measure | bn USD |
|---|---|---|
| Q4 2024 | Net profit | 0.015909 |
| Q1 2025 | Net profit | 0.032177 |
| Q2 2025 | Net profit | 0.033781 |
| Q3 2025 | Net profit | 0.012773999999999999 |
| Q4 2025 | Net profit | 0.016895 |
| Q1 2026 | Net profit | 0.033206000000000006 |
| Q2 2026 | Net profit | 0.064357 |
| Q3 2026 | Net profit | 0.072307 |
Bottom line
Everything in the report was strong: revenue rose 72.8%, EBITDA 215.9%, net profit 466.0%, the EBITDA margin reached 49.0% and net cash stood at USD 388.5m. But USD 42.6m of EBITDA above the price-implied figure came not from copper but from volumes and costs the facts do not break out – that is the main question for the durability of the result. The copper price has already retreated 6.1% from the quarterly average and diesel has become dearer, so the next quarter will be a test. The 1.2% dividend is modest but cash-covered. Our conclusion: rather attractive – the portal model puts the upside at +18%. Our view: the share is rather attractive at the current price; upside on the portal model +18%.