Barrick Mining Corporation: gold rose 23%, yet EBITDA came in 9% below what that price implied
Contents

On 13 November Barrick Mining Corporation released its third-quarter 2026 results. The average gold price in the period was 4268 dollars per ounce against 3459 a year earlier (+23.4%), copper – 14,408 dollars (+33.1%). Revenue rose 22.3% to 5073 million dollars, EBITDA – 27.3% to 3244 million, while net profit added only 1.2% to 1317 million. At the year-ago volumes and costs, our calculation shows those prices should have produced revenue of 5174.8 million and EBITDA of 3574.8 million – the company fell short by 101.8 million on revenue and 330.8 million on EBITDA. Our conclusion: rather unattractive – on the portal's model the share trades 19% above its modelled fair value. Our view: the share is rather unattractive at the current price; upside on the portal model -19%.
Our view: is there upside
Our view in numbers
| Metric | Our read |
|---|---|
| Verdict | Rather unattractive |
| Upside on the portal model | -19% |
| How the model works | spot model: EBITDA re-priced to current commodity prices at the target EV/EBITDA, against market cap |
| EV/EBITDA now and 3-year average | 4.7 vs 5.7 – a 19% discount to its history |
| Dividend yield, 12m | 2.5% |
| Net debt / EBITDA | -0.07 – net cash |
| Strongest case for | EV/EBITDA LTM of 4.7 against its own three-year average of 5.7 is a 19% discount, while net cash of 909 million and ROE of 19.2% make the balance sheet strong. |
| Strongest case against | On the portal's spot model the share trades 19% above fair value, because at current gold of 3890 dollars EBITDA falls to 10,991 million from 13,515 million LTM. |
| What would change the view | A return of gold to 4268 dollars and a quarter held at that level would remove the price discount and move the verdict one step up; settling below 3890 would move it one step down. |
Key takeaways
— Gold averaged 4268 dollars per ounce in the quarter – 23.4% above a year earlier but already 5.5% below the previous quarter
— The price promised EBITDA of 3574.8 million, the company earned 3244 million – the 330.8 million gap comes from volumes and costs, not from price
— Revenue rose 22.3% to 5073 million, but growth decelerated from 43.8% a quarter earlier
— The EBITDA margin rose to 63.9% from 61.4%, while the net margin fell to 26.0% from 31.4% – profit is not being held up by operations
— Net cash of 909 million and leverage at minus 0.07 EBITDA LTM – the balance sheet creates neither risk nor cushion
— A 2.5% dividend yield, with payouts taking only part of profit, is not the argument that outweighs valuation
— EV/EBITDA LTM of 4.7 against its own three-year average of 5.7 – a 19% discount, but at current prices the multiple is already 5.7
Key figures, USD bn
| Metric | Q3 2025 | Q3 2026 | Change |
|---|---|---|---|
| Revenue | 4.15 | 5.07 | +22.3% |
| EBITDA | 2.55 | 3.24 | +27.3% |
| Operating profit | 2.08 | 2.54 | +21.8% |
| Net profit | 1.30 | 1.32 | +1.2% |
| Operating cash flow | 2.42 | 2.49 | +2.8% |
| Capex | 0.94 | — | — |
| EBITDA margin | 61.4% | 63.9% | +2.5 pp |
| Net margin | 31.4% | 26.0% | -5.4 pp |
Gold averaged 4268 dollars per ounce in the quarter – 23.4% above a year earlier but already 5.5% below the previous quarter
The gold price is the main external driver for Barrick: it accounts for 86% of revenue in the portal's model. In the third quarter of 2026 an ounce averaged 4268 dollars against 3459 a year earlier, up 23.4%. Copper, which provides 14% of revenue, rose even more – from 10,825 to 14,408 dollars per tonne, up 33.1%.
The quarter-on-quarter picture is different: gold fell 5.5% against the previous quarter, copper rose 5.3%. As of 13 November 2026 gold trades at 3890 dollars – 8.9% below the reported-period average – and copper at 13,663 dollars, 5.2% below. The price tailwind that carried revenue all year is weakening in the fourth quarter.
Commodity prices: period average and now
| Benchmark | Year ago | Q3 2026 | YoY | Spot 2026-11-13 |
|---|---|---|---|---|
| Gold, USD | 3 459 | 4 268 | +23,4% | 3 890 |
| Copper, USD | 10 825 | 14 408 | +33,1% | 13 663 |
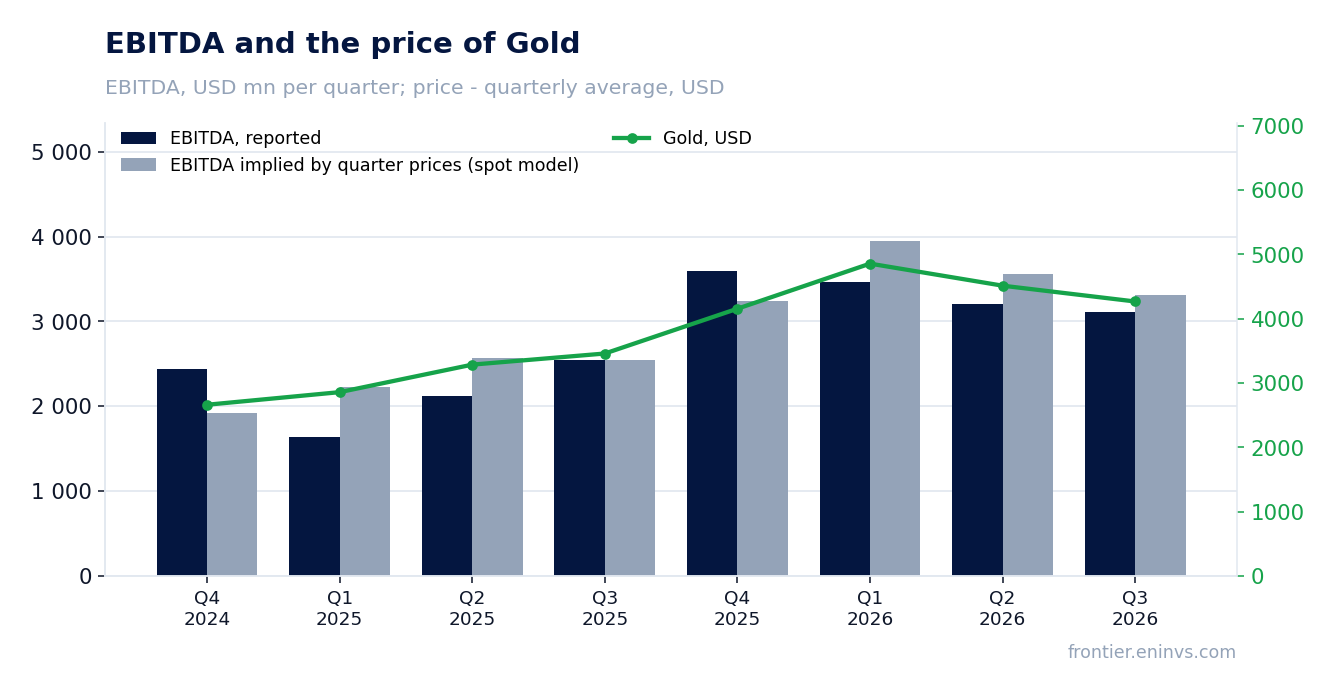
The price promised EBITDA of 3574.8 million, the company earned 3244 million – the 330.8 million gap comes from volumes and costs, not from price
At the year-ago volumes and non-commodity costs, with only gold and copper prices moving, our calculation gives revenue of 5174.8 million dollars and EBITDA of 3574.8 million. Actual revenue was 5073 million and EBITDA 3244 million. The shortfall is 101.8 million, or 2.0%, on revenue and 330.8 million, or 9.3%, on EBITDA.
The price effect alone would have added 1026.8 million to revenue, or 24.8%. So the company lost ground on volumes, on the realised price against the benchmark, or on unit costs – the facts do not break this down, so the exact cause cannot be named. What is visible is that EBITDA lagged the price-implied level by more than revenue did: every dollar of missing revenue came with more than three dollars of missing EBITDA, meaning cost per ounce rose.
The portal's spot model, built from the average of the previous four quarters, expected EBITDA of 3311.3 million and revenue of 5319.4 million. The actual result is 2.0% below the model on EBITDA and 4.6% below on revenue. In the four prior periods the deviation was +0.3%, +11.0%, -12.3% and -9.9% – within the usual range, but consistently below the price-implied level.
What the prices implied and what the company earned
| Base (Q3 2025) | Implied at period prices | Reported | Reported vs implied | |
|---|---|---|---|---|
| Revenue, USD mn | 4 148 | 5 175 | 5 073 | -2,0% |
| EBITDA, USD mn | 2 548 | 3 575 | 3 244 | -9,3% |
| EBITDA, portal spot model, USD mn | — | 3 311 | 3 244 | -2,0% |
Revenue and EBITDA by quarter
| Period | Measure | bn USD |
|---|---|---|
| Q4 2024 | Revenue | 3.645 |
| Q1 2025 | Revenue | 3.13 |
| Q2 2025 | Revenue | 3.681 |
| Q3 2025 | Revenue | 4.148 |
| Q4 2025 | Revenue | 5.997 |
| Q1 2026 | Revenue | 5.218 |
| Q2 2026 | Revenue | 5.292 |
| Q3 2026 | Revenue | 5.073 |
| Q4 2024 | EBITDA | 2.433 |
| Q1 2025 | EBITDA | 1.641 |
| Q2 2025 | EBITDA | 2.126 |
| Q3 2025 | EBITDA | 2.545 |
| Q4 2025 | EBITDA | 3.599 |
| Q1 2026 | EBITDA | 3.467 |
| Q2 2026 | EBITDA | 3.205 |
| Q3 2026 | EBITDA | 3.106 |
EBITDA margin
| Period | Measure | % |
|---|---|---|
| Q4 2024 | EBITDA margin | 66.7 |
| Q1 2025 | EBITDA margin | 52.4 |
| Q2 2025 | EBITDA margin | 57.8 |
| Q3 2025 | EBITDA margin | 61.4 |
| Q4 2025 | EBITDA margin | 60.0 |
| Q1 2026 | EBITDA margin | 66.4 |
| Q2 2026 | EBITDA margin | 60.6 |
| Q3 2026 | EBITDA margin | 61.2 |
Revenue rose 22.3% to 5073 million, but growth decelerated from 43.8% a quarter earlier
Third-quarter 2026 revenue was 5073 million dollars, 22.3% above a year earlier. That is a deceleration: growth was 43.8% in the second quarter and 66.7% in the first. The slowdown is mainly a base effect – revenue had already jumped 23.2% a year earlier – and the fact that gold fell 5.5% against the previous quarter.
Quarter on quarter, revenue declined 4.0%, from 5292 to 5073 million. At the previous quarter's volumes and costs and the new prices, our calculation gives 5082.9 million, so the actual figure almost matched the price-implied level: a deviation of just 9.9 million, or 0.2%. The sequential decline is therefore almost entirely a price story, not a volume loss.
The EBITDA margin rose to 63.9% from 61.4%, while the net margin fell to 26.0% from 31.4% – profit is not being held up by operations
The EBITDA margin in the reported quarter was 63.9% against 61.4% a year earlier. A rising margin while gold fell against the previous quarter means unit costs declined or that items unrelated to mining landed in EBITDA; the facts do not disclose the causes. Operating profit was 2539 million and EBITDA 3244 million, a 705 million difference that is depreciation.
Net profit rose only 1.2% to 1317 million, and the net margin fell to 26.0% from 31.4%. With EBITDA up 27.3%, that profit dynamic means costs or one-off items arose below the operating line that were absent a year earlier. The facts do not list them, so they cannot be named; what is visible is that the EBITDA growth did not reach net profit.
Net cash of 909 million and leverage at minus 0.07 EBITDA LTM – the balance sheet creates neither risk nor cushion
As of 30 September 2026 Barrick had net cash of 909 million dollars – debt is smaller than cash. Net debt to EBITDA over the last twelve months is minus 0.07. That is a level, not a trend: the facts give no earlier value, so whether leverage rose or fell cannot be said.
Operating cash flow was 2489 million in the reported quarter and 6919 million over the last twelve months. Capital expenditure in the quarter was 1322 million, up from 943 million a year earlier: the company is investing to sustain output. Free cash flow for the quarter was about 1167 million, comfortably covering the dividend. The balance sheet is strong, but at EV/EBITDA of 4.7 that is already in the price.
Valuation vs its own history
now vs the 3-year average
| Period | Measure | × |
|---|---|---|
| EV/EBITDA | Now | 4.671199622247141 |
| EV/EBITDA | 3-year average | 5.748785236427339 |
A 2.5% dividend yield, with payouts taking only part of profit, is not the argument that outweighs valuation
The trailing twelve-month dividend yield is 2.5%. With LTM net profit of 4940 million and a market capitalisation of 63,396 million, that is a moderate payout: dividends take only part of profit, and the rest stays in the company. The facts do not give the exact amount of the last payment or the year it relates to, so we stick to the yield.
Our estimate for the current year's dividend is a yield of about 2.5%, and it rests on profit rather than one-off items. The risk to the payout is a fall in gold: spot is already 8.9% below the reported-period average, and at 3890 dollars the portal model puts EBITDA at 10,991 million against 13,515 million LTM. A 2.5% yield is below the key rate and does not offset valuation – for this share the dividend is not the deciding argument.
Share price, three years
close, last point 2026-11-12
| Period | Measure | USD per share |
|---|---|---|
| 2025-11-13 | Closing price | 36.41999816894531 |
| 2025-11-14 | Closing price | 37.029998779296875 |
| 2025-11-17 | Closing price | 36.959999084472656 |
| 2025-11-18 | Closing price | 37.7400016784668 |
| 2025-11-19 | Closing price | 37.72999954223633 |
| 2025-11-20 | Closing price | 36.0 |
| 2025-11-21 | Closing price | 36.54999923706055 |
| 2025-11-24 | Closing price | 39.540000915527344 |
| 2025-11-25 | Closing price | 39.119998931884766 |
| 2025-11-26 | Closing price | 40.97999954223633 |
| 2025-11-28 | Closing price | 41.34000015258789 |
| 2025-12-01 | Closing price | 42.33000183105469 |
| 2025-12-02 | Closing price | 41.029998779296875 |
| 2025-12-03 | Closing price | 40.5 |
| 2025-12-04 | Closing price | 40.90999984741211 |
| 2025-12-05 | Closing price | 41.040000915527344 |
| 2025-12-08 | Closing price | 40.02000045776367 |
| 2025-12-09 | Closing price | 40.90999984741211 |
| 2025-12-10 | Closing price | 41.7599983215332 |
| 2025-12-11 | Closing price | 43.150001525878906 |
| 2025-12-12 | Closing price | 43.09000015258789 |
| 2025-12-15 | Closing price | 43.34000015258789 |
| 2025-12-16 | Closing price | 42.93000030517578 |
| 2025-12-17 | Closing price | 43.56999969482422 |
| 2025-12-18 | Closing price | 43.869998931884766 |
| 2025-12-19 | Closing price | 44.72999954223633 |
| 2025-12-22 | Closing price | 45.59000015258789 |
| 2025-12-23 | Closing price | 45.630001068115234 |
| 2025-12-24 | Closing price | 45.45000076293945 |
| 2025-12-26 | Closing price | 46.209999084472656 |
| 2025-12-29 | Closing price | 44.02000045776367 |
| 2025-12-30 | Closing price | 44.2400016784668 |
| 2025-12-31 | Closing price | 43.54999923706055 |
| 2026-01-02 | Closing price | 44.08000183105469 |
| 2026-01-05 | Closing price | 45.7400016784668 |
| 2026-01-06 | Closing price | 47.7400016784668 |
| 2026-01-07 | Closing price | 47.27000045776367 |
| 2026-01-08 | Closing price | 47.439998626708984 |
| 2026-01-09 | Closing price | 47.810001373291016 |
| 2026-01-12 | Closing price | 49.029998779296875 |
| 2026-01-13 | Closing price | 49.709999084472656 |
| 2026-01-14 | Closing price | 49.95000076293945 |
| 2026-01-15 | Closing price | 49.63999938964844 |
| 2026-01-16 | Closing price | 48.72999954223633 |
| 2026-01-20 | Closing price | 50.0099983215332 |
| 2026-01-21 | Closing price | 49.06999969482422 |
| 2026-01-22 | Closing price | 49.2400016784668 |
| 2026-01-23 | Closing price | 51.08000183105469 |
| 2026-01-26 | Closing price | 51.290000915527344 |
| 2026-01-27 | Closing price | 52.16999816894531 |
| 2026-01-28 | Closing price | 52.97999954223633 |
| 2026-01-29 | Closing price | 52.04999923706055 |
| 2026-01-30 | Closing price | 45.790000915527344 |
| 2026-02-02 | Closing price | 46.43000030517578 |
| 2026-02-03 | Closing price | 47.529998779296875 |
| 2026-02-04 | Closing price | 47.36000061035156 |
| 2026-02-05 | Closing price | 43.970001220703125 |
| 2026-02-06 | Closing price | 45.15999984741211 |
| 2026-02-09 | Closing price | 46.630001068115234 |
| 2026-02-10 | Closing price | 46.95000076293945 |
| 2026-02-11 | Closing price | 47.63999938964844 |
| 2026-02-12 | Closing price | 45.380001068115234 |
| 2026-02-13 | Closing price | 47.90999984741211 |
| 2026-02-17 | Closing price | 46.650001525878906 |
| 2026-02-18 | Closing price | 48.220001220703125 |
| 2026-02-19 | Closing price | 48.54999923706055 |
| 2026-02-20 | Closing price | 47.959999084472656 |
| 2026-02-23 | Closing price | 49.220001220703125 |
| 2026-02-24 | Closing price | 49.709999084472656 |
| 2026-02-25 | Closing price | 49.810001373291016 |
| 2026-02-26 | Closing price | 50.349998474121094 |
| 2026-02-27 | Closing price | 50.7400016784668 |
| 2026-03-02 | Closing price | 50.54999923706055 |
| 2026-03-03 | Closing price | 46.349998474121094 |
| 2026-03-04 | Closing price | 46.77000045776367 |
| 2026-03-05 | Closing price | 45.36000061035156 |
| 2026-03-06 | Closing price | 45.41999816894531 |
| 2026-03-09 | Closing price | 45.810001373291016 |
| 2026-03-10 | Closing price | 46.13999938964844 |
| 2026-03-11 | Closing price | 45.439998626708984 |
| 2026-03-12 | Closing price | 44.4900016784668 |
| 2026-03-13 | Closing price | 42.34000015258789 |
| 2026-03-16 | Closing price | 43.099998474121094 |
| 2026-03-17 | Closing price | 42.79999923706055 |
| 2026-03-18 | Closing price | 40.459999084472656 |
| 2026-03-19 | Closing price | 38.279998779296875 |
| 2026-03-20 | Closing price | 37.13999938964844 |
| 2026-03-23 | Closing price | 37.689998626708984 |
| 2026-03-24 | Closing price | 38.029998779296875 |
| 2026-03-25 | Closing price | 38.970001220703125 |
| 2026-03-26 | Closing price | 37.47999954223633 |
| 2026-03-27 | Closing price | 38.59000015258789 |
| 2026-03-30 | Closing price | 38.45000076293945 |
| 2026-03-31 | Closing price | 40.790000915527344 |
| 2026-04-01 | Closing price | 42.20000076293945 |
| 2026-04-02 | Closing price | 41.63999938964844 |
| 2026-04-06 | Closing price | 41.08000183105469 |
| 2026-04-07 | Closing price | 41.380001068115234 |
| 2026-04-08 | Closing price | 42.5099983215332 |
| 2026-04-09 | Closing price | 42.43000030517578 |
| 2026-04-10 | Closing price | 43.54999923706055 |
| 2026-04-13 | Closing price | 43.02000045776367 |
| 2026-04-14 | Closing price | 43.81999969482422 |
| 2026-04-15 | Closing price | 43.06999969482422 |
| 2026-04-16 | Closing price | 42.400001525878906 |
| 2026-04-17 | Closing price | 43.29999923706055 |
| 2026-04-20 | Closing price | 42.959999084472656 |
| 2026-04-21 | Closing price | 40.45000076293945 |
| 2026-04-22 | Closing price | 40.72999954223633 |
| 2026-04-23 | Closing price | 40.20000076293945 |
| 2026-04-24 | Closing price | 41.09000015258789 |
| 2026-04-27 | Closing price | 40.66999816894531 |
| 2026-04-28 | Closing price | 39.16999816894531 |
| 2026-04-29 | Closing price | 38.45000076293945 |
| 2026-04-30 | Closing price | 39.34000015258789 |
| 2026-05-01 | Closing price | 38.81999969482422 |
| 2026-05-04 | Closing price | 38.34000015258789 |
| 2026-05-05 | Closing price | 38.720001220703125 |
| 2026-05-06 | Closing price | 41.58000183105469 |
| 2026-05-07 | Closing price | 41.84000015258789 |
| 2026-05-08 | Closing price | 43.130001068115234 |
| 2026-05-11 | Closing price | 47.0 |
| 2026-05-12 | Closing price | 45.849998474121094 |
| 2026-05-13 | Closing price | 44.869998931884766 |
| 2026-05-14 | Closing price | 43.15999984741211 |
| 2026-05-15 | Closing price | 40.61000061035156 |
| 2026-05-18 | Closing price | 40.599998474121094 |
| 2026-05-19 | Closing price | 39.5 |
| 2026-05-20 | Closing price | 40.939998626708984 |
| 2026-05-21 | Closing price | 41.279998779296875 |
| 2026-05-22 | Closing price | 40.68000030517578 |
| 2026-05-26 | Closing price | 42.099998474121094 |
| 2026-05-27 | Closing price | 41.25 |
| 2026-05-28 | Closing price | 41.689998626708984 |
| 2026-05-29 | Closing price | 42.54999923706055 |
| 2026-06-01 | Closing price | 42.31999969482422 |
| 2026-06-02 | Closing price | 43.20000076293945 |
| 2026-06-03 | Closing price | 41.86000061035156 |
| 2026-06-04 | Closing price | 42.790000915527344 |
| 2026-06-05 | Closing price | 39.459999084472656 |
| 2026-06-08 | Closing price | 39.459999084472656 |
| 2026-06-09 | Closing price | 39.150001525878906 |
| 2026-06-10 | Closing price | 37.189998626708984 |
| 2026-06-11 | Closing price | 39.099998474121094 |
| 2026-06-12 | Closing price | 40.20000076293945 |
| 2026-06-15 | Closing price | 41.83000183105469 |
| 2026-06-16 | Closing price | 42.77000045776367 |
| 2026-06-17 | Closing price | 41.290000915527344 |
| 2026-06-18 | Closing price | 40.34000015258789 |
| 2026-06-22 | Closing price | 40.13999938964844 |
| 2026-06-23 | Closing price | 38.18000030517578 |
| 2026-06-24 | Closing price | 36.459999084472656 |
| 2026-06-25 | Closing price | 36.75 |
| 2026-06-26 | Closing price | 37.290000915527344 |
| 2026-06-29 | Closing price | 36.93000030517578 |
| 2026-06-30 | Closing price | 36.72999954223633 |
| 2026-07-01 | Closing price | 36.45000076293945 |
| 2026-07-02 | Closing price | 38.209999084472656 |
| 2026-07-06 | Closing price | 38.11000061035156 |
| 2026-07-07 | Closing price | 36.86000061035156 |
| 2026-07-08 | Closing price | 35.7400016784668 |
| 2026-07-09 | Closing price | 36.83000183105469 |
| 2026-07-10 | Closing price | 36.68000030517578 |
| 2026-07-13 | Closing price | 35.939998626708984 |
| 2026-07-14 | Closing price | 36.4900016784668 |
| 2026-07-15 | Closing price | 35.90999984741211 |
| 2026-07-16 | Closing price | 34.84000015258789 |
| 2026-07-17 | Closing price | 34.93000030517578 |
| 2026-07-20 | Closing price | 34.88999938964844 |
| 2026-07-21 | Closing price | 36.369998931884766 |
| 2026-07-22 | Closing price | 37.5099983215332 |
| 2026-07-23 | Closing price | 37.15999984741211 |
| 2026-07-24 | Closing price | 37.11000061035156 |
| 2026-07-27 | Closing price | 37.380001068115234 |
| 2026-07-28 | Closing price | 36.689998626708984 |
| 2026-07-29 | Closing price | 36.36000061035156 |
| 2026-07-30 | Closing price | 37.70000076293945 |
| 2026-07-31 | Closing price | 36.72999954223633 |
| 2026-08-03 | Closing price | 37.36000061035156 |
| 2026-08-04 | Closing price | 38.209999084472656 |
| 2026-08-05 | Closing price | 41.04999923706055 |
| 2026-08-06 | Closing price | 41.369998931884766 |
| 2026-08-07 | Closing price | 43.68000030517578 |
| 2026-08-10 | Closing price | 40.880001068115234 |
| 2026-08-11 | Closing price | 40.130001068115234 |
| 2026-08-12 | Closing price | 41.22999954223633 |
| 2026-08-13 | Closing price | 40.90999984741211 |
| 2026-08-14 | Closing price | 41.599998474121094 |
| 2026-08-17 | Closing price | 42.52000045776367 |
| 2026-08-18 | Closing price | 42.09000015258789 |
| 2026-08-19 | Closing price | 45.130001068115234 |
| 2026-08-20 | Closing price | 46.27000045776367 |
| 2026-08-21 | Closing price | 47.599998474121094 |
| 2026-08-24 | Closing price | 48.15999984741211 |
| 2026-08-25 | Closing price | 48.869998931884766 |
| 2026-08-26 | Closing price | 47.0 |
| 2026-08-27 | Closing price | 47.31999969482422 |
| 2026-08-28 | Closing price | 45.650001525878906 |
| 2026-08-31 | Closing price | 44.83000183105469 |
| 2026-09-01 | Closing price | 43.099998474121094 |
| 2026-09-02 | Closing price | 44.130001068115234 |
| 2026-09-03 | Closing price | 45.7599983215332 |
| 2026-09-04 | Closing price | 44.75 |
| 2026-09-08 | Closing price | 44.099998474121094 |
| 2026-09-09 | Closing price | 44.59000015258789 |
| 2026-09-10 | Closing price | 43.459999084472656 |
| 2026-09-11 | Closing price | 43.68000030517578 |
| 2026-09-14 | Closing price | 42.43000030517578 |
| 2026-09-15 | Closing price | 42.70000076293945 |
| 2026-09-16 | Closing price | 42.54999923706055 |
| 2026-09-17 | Closing price | 43.689998626708984 |
| 2026-09-18 | Closing price | 43.33000183105469 |
| 2026-09-21 | Closing price | 42.689998626708984 |
| 2026-09-22 | Closing price | 43.880001068115234 |
| 2026-09-23 | Closing price | 42.4900016784668 |
| 2026-09-24 | Closing price | 42.31999969482422 |
| 2026-09-25 | Closing price | 42.880001068115234 |
| 2026-09-28 | Closing price | 41.09000015258789 |
| 2026-09-29 | Closing price | 41.2400016784668 |
| 2026-09-30 | Closing price | 40.66999816894531 |
| 2026-10-01 | Closing price | 40.099998474121094 |
| 2026-10-02 | Closing price | 40.22999954223633 |
| 2026-10-05 | Closing price | 40.0 |
| 2026-10-06 | Closing price | 40.720001220703125 |
| 2026-10-07 | Closing price | 39.18000030517578 |
| 2026-10-08 | Closing price | 39.9900016784668 |
| 2026-10-09 | Closing price | 41.060001373291016 |
| 2026-10-12 | Closing price | 40.83000183105469 |
| 2026-10-13 | Closing price | 40.52000045776367 |
| 2026-10-14 | Closing price | 38.88999938964844 |
| 2026-10-15 | Closing price | 40.54999923706055 |
| 2026-10-16 | Closing price | 40.81999969482422 |
| 2026-10-19 | Closing price | 40.439998626708984 |
| 2026-10-20 | Closing price | 40.43000030517578 |
| 2026-10-21 | Closing price | 40.7599983215332 |
| 2026-10-22 | Closing price | 38.650001525878906 |
| 2026-10-23 | Closing price | 38.13999938964844 |
| 2026-10-26 | Closing price | 38.2400016784668 |
| 2026-10-27 | Closing price | 39.2599983215332 |
| 2026-10-28 | Closing price | 39.689998626708984 |
| 2026-10-29 | Closing price | 38.66999816894531 |
| 2026-10-30 | Closing price | 37.0099983215332 |
| 2026-11-02 | Closing price | 37.970001220703125 |
| 2026-11-03 | Closing price | 37.04999923706055 |
| 2026-11-04 | Closing price | 40.130001068115234 |
| 2026-11-05 | Closing price | 40.34000015258789 |
| 2026-11-06 | Closing price | 40.560001373291016 |
| 2026-11-09 | Closing price | 42.27000045776367 |
| 2026-11-10 | Closing price | 39.689998626708984 |
| 2026-11-11 | Closing price | 39.060001373291016 |
| 2026-11-12 | Closing price | 37.84000015258789 |
EV/EBITDA LTM of 4.7 against its own three-year average of 5.7 – a 19% discount, but at current prices the multiple is already 5.7
At an EV/EBITDA LTM of 4.7 the share trades below its own three-year average of 5.7 – a 19% discount. But LTM earnings were made at past gold prices. On the portal's spot model, which re-prices EBITDA to current prices, annual EBITDA is 10,991 million against 13,515 million LTM, and EV/EBITDA at current prices is already 5.7 – exactly at the historical average. There is no discount to its own history at today's prices.
At current prices and the target multiple, the portal model puts fair value 19% below the market. P/E LTM is 12.8 and ROE 19.2%. Both metrics look decent, but they are built on earnings that gold at 4268 dollars will no longer deliver: spot is 3890. It is the gold price, not the multiple, that will decide whether the valuation holds.
Valuation on the latest reported figures
| Metric | Value |
|---|---|
| Market cap | 63.4 bn USD |
| P/E (LTM) | 12.8 |
| EV/EBITDA (LTM) | 4.7 |
| P/B | 2.39 |
| Net debt / EBITDA (LTM) | -0.07 |
| Operating cash flow (LTM) | 6.92 bn |
| ROE | 19.2% |
| Dividend yield (12m) | 2.5% |
| EV/EBITDA, 3-year average | 5.7 |
Net profit by quarter
| Period | Measure | bn USD |
|---|---|---|
| Q4 2024 | Net profit | 0.996 |
| Q1 2025 | Net profit | 0.474 |
| Q2 2025 | Net profit | 0.811 |
| Q3 2025 | Net profit | 1.302 |
| Q4 2025 | Net profit | 2.406 |
| Q1 2026 | Net profit | 1.602 |
| Q2 2026 | Net profit | 1.217 |
| Q3 2026 | Net profit | 1.317 |
Bottom line
The strong part of the report is price: gold +23.4% and copper +33.1% year on year lifted revenue 22.3% and EBITDA 27.3%, and the EBITDA margin rose to 63.9%. But the price promised more: at the year-ago volumes and costs, our calculation puts EBITDA at 3574.8 million, while the company earned 3244 million – a 330.8 million gap. Net profit added only 1.2% because costs arose below the operating line that were absent a year earlier. The balance sheet is strong – net cash of 909 million – but at current gold prices EV/EBITDA is already 5.7, at its own three-year average, and the portal model shows a 19% downside to fair value. Our conclusion: rather unattractive – the upside is negative, minus 19% on the portal's model. Our view: the share is rather unattractive at the current price; upside on the portal model -19%.