Bunge Global: profit up 91.6% while revenue adds just 7.4% – growth rests on margin, not volume

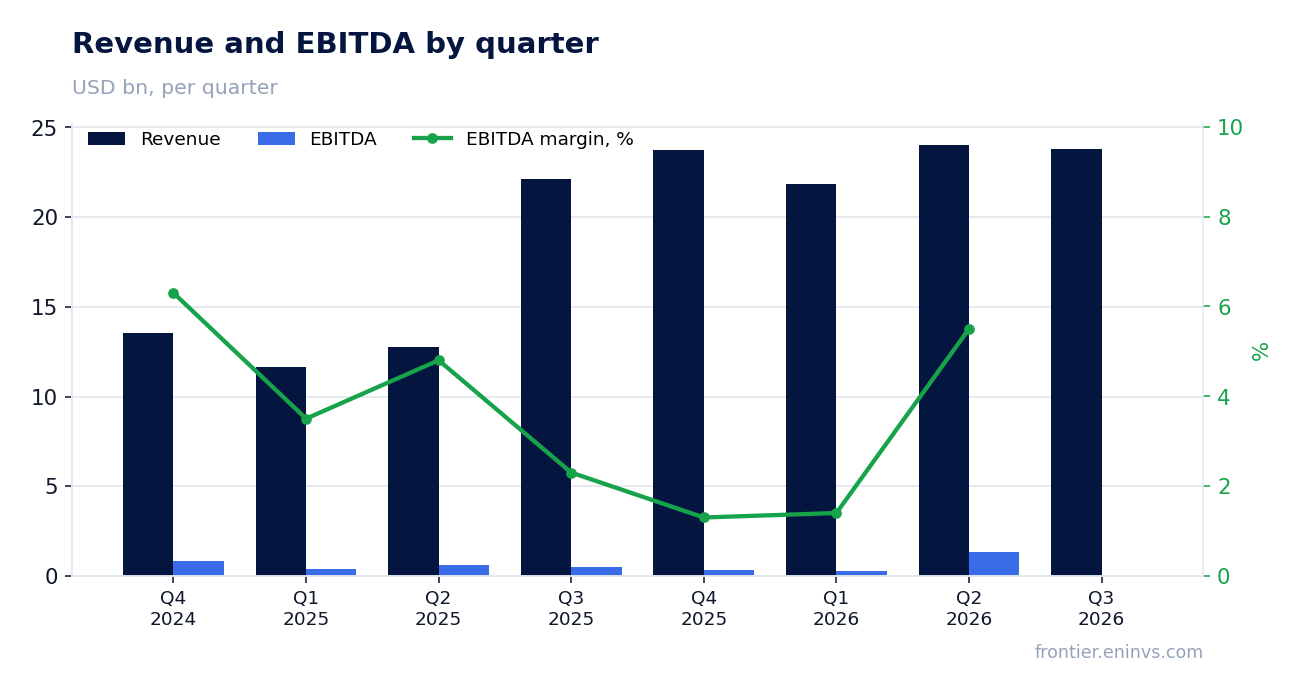
On 29 October Bunge Global reported results for the third quarter of 2026. Revenue came in at USD 23,804 mn, up 7.4% year on year, while net profit reached USD 318 mn against 166 mn a year earlier, a gain of 91.6%. The net margin rose to 1.3% from 0.7%, and net debt at the end of September fell to USD 9,751 mn from 14,069 mn on 30 September 2025. Yet the top-line growth rate decelerated sharply: 88.3% in the second quarter versus 7.4% in the third. The share fell 4.7% after the release, and with an EV/EBITDA of 11.5 against its own three-year average of 11.1 the stock looks neutral: profit rose, but operating cash flow for the quarter was negative at minus USD 1,176 mn.
Key takeaways
— Revenue added 7.4% after 88.3% in the second quarter – growth decelerated, and the quarter rests on a high base from a year earlier
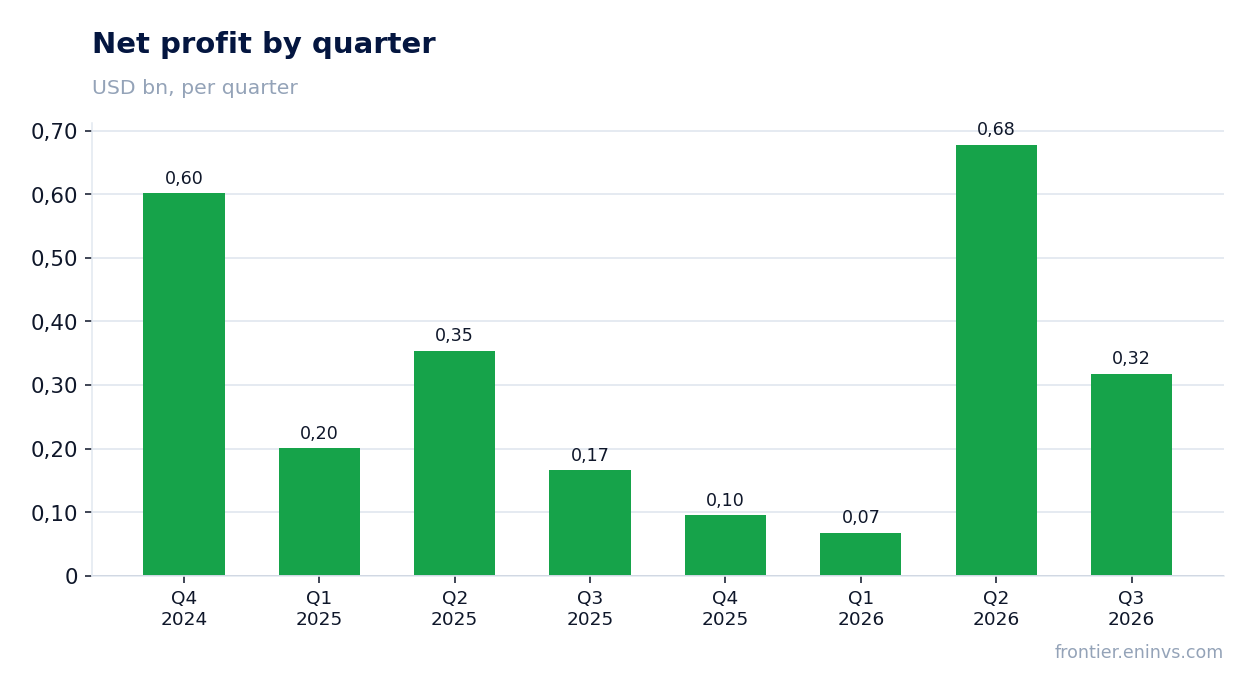
— Net profit rose 91.6% to USD 318 mn and the margin climbed to 1.3% from 0.7% – margin, not volume, delivered the profit
— Operating cash flow for the quarter was negative at minus USD 1,176 mn against capital expenditure of USD 384 mn
— Net debt fell to USD 9,751 mn from 14,069 mn a year earlier, and the net debt to LTM EBITDA ratio stands at 3.38
— Trailing twelve-month dividend yield is 3.0%, above the yield we consider fair for a neutral multiple
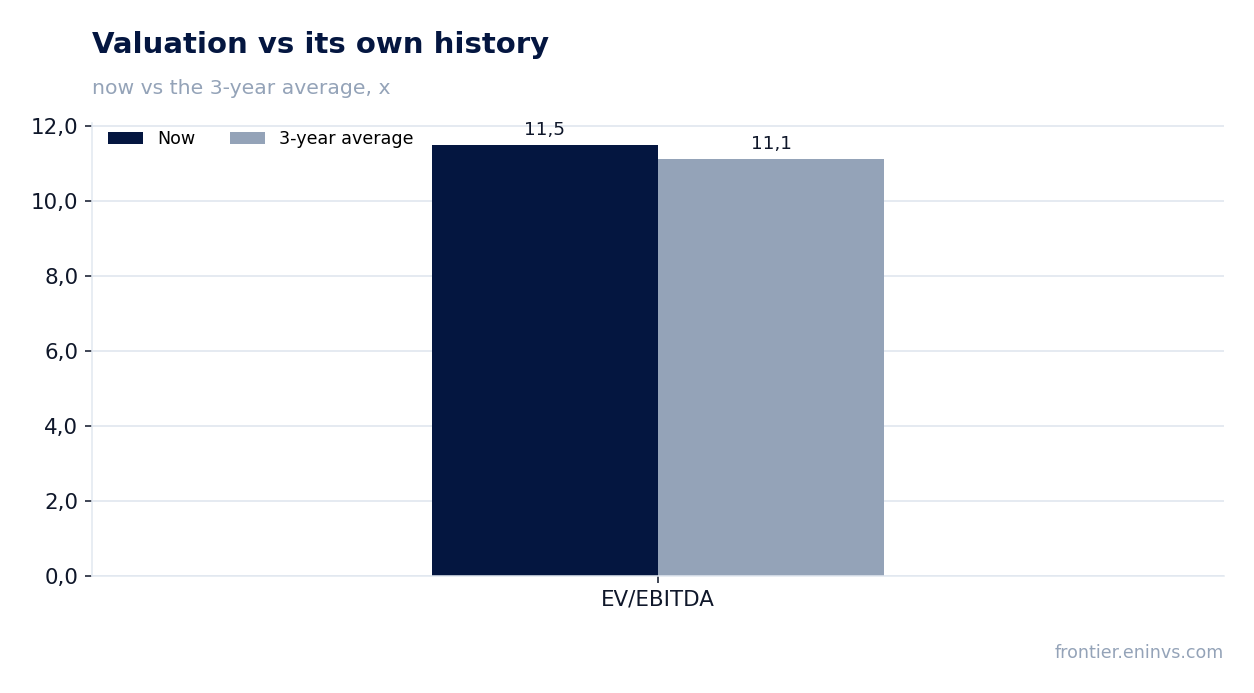
— LTM EV/EBITDA of 11.5 is in line with its own three-year average of 11.1 – the market values the company as it has on average over three years
Attractiveness
Key figures, USD bn
| Metric | Q3 2025 | Q3 2026 | Change |
|---|---|---|---|
| Revenue | 22.2 | 23.8 | +7.4% |
| EBITDA | 0.51 | — | — |
| Operating profit | 0.27 | — | — |
| Net profit | 0.17 | 0.32 | +91.6% |
| Operating cash flow | 0.85 | -1.18 | -237.7% |
| Capex | 0.47 | 0.38 | -18.1% |
| EBITDA margin | 2.3% | — | — |
| Net margin | 0.7% | 1.3% | +0.6 pp |
Revenue added 7.4% after 88.3% in the second quarter – growth decelerated, and the quarter rests on a high base from a year earlier
Revenue for the third quarter of 2026 was USD 23,804 mn, 7.4% more than a year earlier. In the second quarter growth was 88.3%, so the pace decelerated more than tenfold. The reason is the base: the third quarter of 2025 was already strong – revenue jumped 71.6% then, and the new quarter is measured against a high bar.
Deceleration does not mean contraction: absolute revenue in the third quarter is almost level with the second (USD 24,041 mn). But the annual rate shows that the low-base effect which powered the 2025–early 2026 reports is exhausted. From here growth will be set by real volume and prices, not by comparison with a weak period.
For an investor this is the main signal of the report: the company has returned to a normal growth pace, and further revenue expansion will be modest. The valuation should therefore rest on margin and cash flow, not on an expectation that double-digit rates will repeat.
Net profit rose 91.6% to USD 318 mn and the margin climbed to 1.3% from 0.7% – margin, not volume, delivered the profit
Net profit for the third quarter of 2026 was USD 318 mn against 166 mn a year earlier, up 91.6%. Revenue over the same period grew only 7.4%, so the entire profit gain came from margin: the net margin rose to 1.3% from 0.7%.
This means the company earned more on every dollar of sales. On revenue of USD 23,804 mn, a 0.6 percentage point margin difference yields roughly USD 143 mn of extra profit – that is the main source of growth. The facts do not disclose what drove the margin improvement, so we state only what moved: profit grew faster than revenue thanks to profitability.
The durability of this improvement is the key question. A 1.3% margin for a company with quarterly revenue near USD 24 bn remains thin: swings in raw-material prices and capacity utilisation easily shift it by several tenths. If the margin holds, next quarter's profit will be well above last year's even with modest revenue growth.
Operating cash flow for the quarter was negative at minus USD 1,176 mn against capital expenditure of USD 384 mn
Operating cash flow for the third quarter of 2026 was minus USD 1,176 mn, whereas a year earlier it was positive at 854 mn. Capital expenditure for the quarter was USD 384 mn, so even before investment the quarter generated no cash from operations.
Negative cash flow alongside positive profit usually means an outflow into working capital: the company built inventories or receivables faster than it collected payment. The facts do not disclose the cause, so we record the gap itself: profit of USD 318 mn and operating cash flow of minus USD 1,176 mn diverge by almost USD 1.5 bn.
Over the trailing twelve months operating cash flow is also negative at minus USD 955 mn on revenue of USD 93,500 mn. Reported profit is not yet converting into cash, and dividends are not being funded from operations. For a holder this is the main risk in the report: profit growth on paper is not backed by cash receipts.
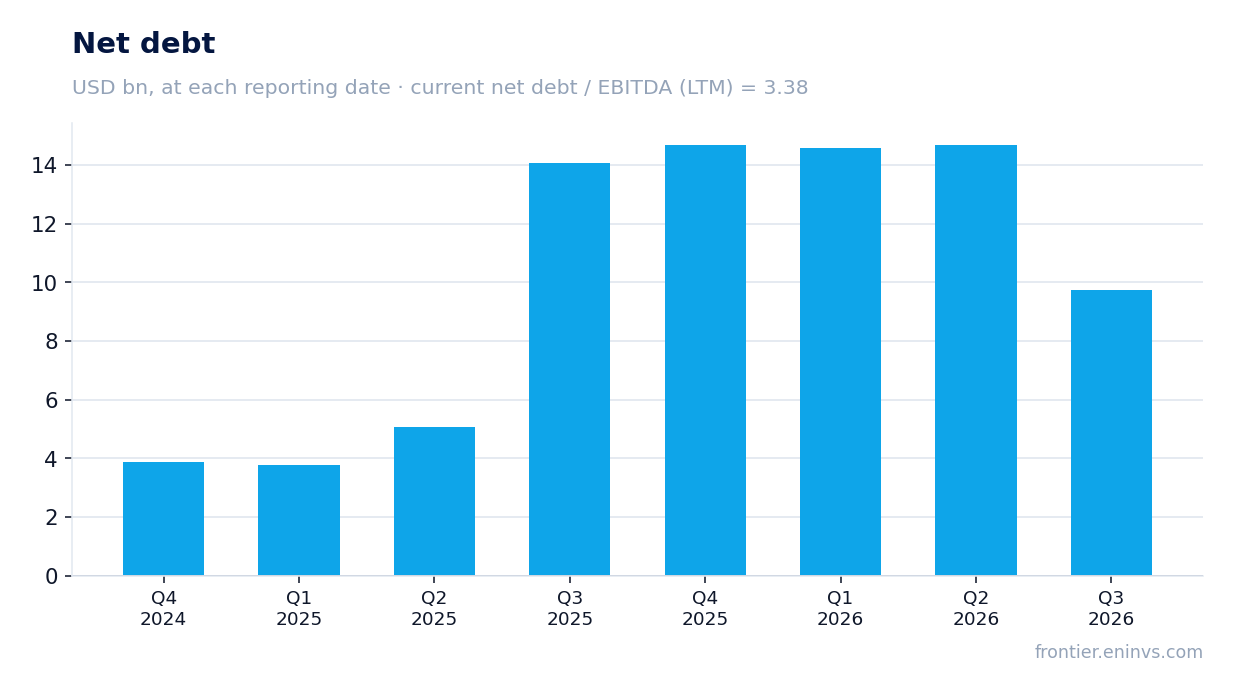
Net debt fell to USD 9,751 mn from 14,069 mn a year earlier, and the net debt to LTM EBITDA ratio stands at 3.38
Net debt on 30 September 2026 was USD 9,751 mn, down from 14,069 mn on 30 September 2025 – a reduction of 4,318 mn over the year. At the previous reporting date, 30 June 2026, debt stood at 14,666 mn, so it fell 4,915 mn over the quarter.
The ratio of net debt to trailing twelve-month EBITDA is 3.38. That is a level requiring servicing: with LTM EBITDA of USD 2,882.7 mn, debt equals roughly three and a half years of the company's cash earnings. Interest expense at this debt level absorbs part of profit and is another argument for a cautious valuation.
The quarterly debt reduction is a strong point of the report. The facts do not provide an earlier value of the ratio, however, so we do not assess the direction of leverage: we record only the level of 3.38 and the fact that absolute debt fell.
Trailing twelve-month dividend yield is 3.0%, above the yield we consider fair for a neutral multiple
The trailing twelve-month dividend yield is 3.0%. On a market capitalisation of USD 18,454 mn that corresponds to payouts of about USD 550 mn a year. For a company with LTM net profit of USD 1,159 mn, the dividend is covered by profit roughly twice over.
Operating cash flow over the trailing twelve months, however, is negative at minus USD 955 mn. Payouts are therefore funded not from operations but from the balance sheet and possibly asset sales. While debt is falling this is acceptable, but the dividend's durability depends on a recovery in cash flow.
A 3.0% yield on a neutral multiple looks adequate: it compensates for risk but offers no premium. If operating cash flow stays negative, the dividend could be cut – the main risk for an income-oriented holder.
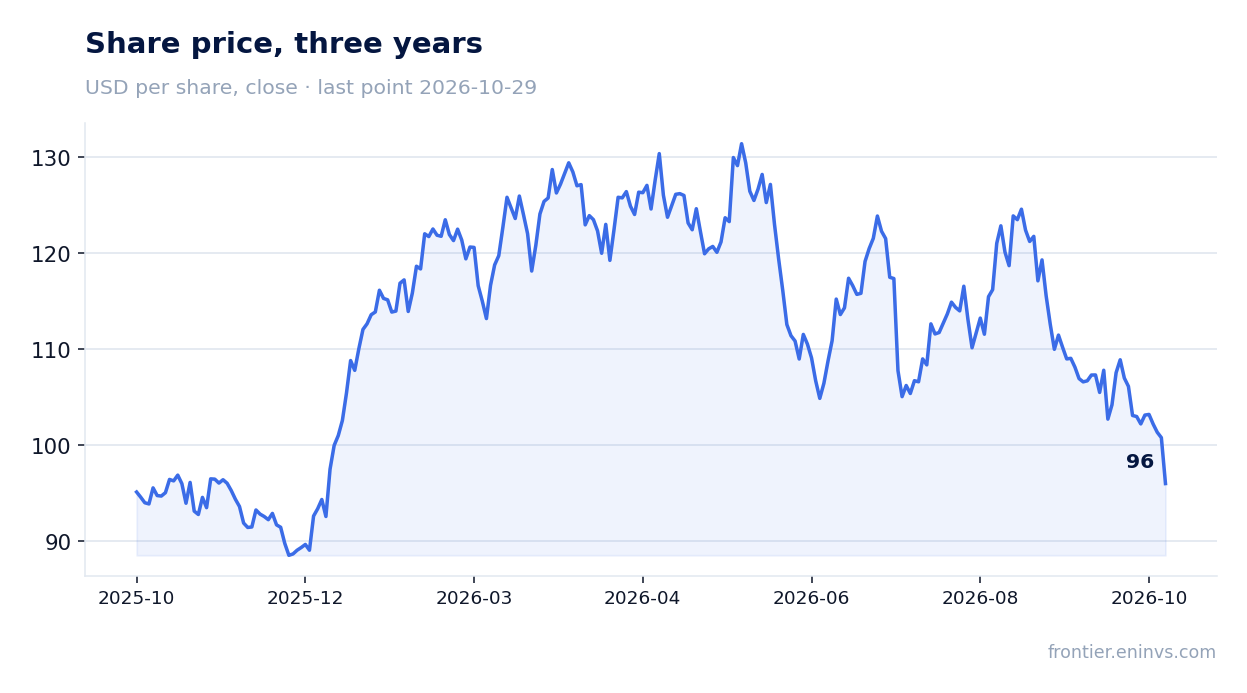
LTM EV/EBITDA of 11.5 is in line with its own three-year average of 11.1 – the market values the company as it has on average over three years
The trailing twelve-month EV/EBITDA multiple is 11.5 against its own three-year average of 11.1. The difference is within 5%, meaning the stock trades exactly at its historical level. The market is pricing in neither a growth premium nor a risk discount.
The LTM P/E is 15.9, which with LTM net profit of USD 1,159 mn and a market capitalisation of USD 18,454 mn corresponds to expectations of moderate growth. For a company with revenue of USD 93,500 mn and a margin near 1.2%, this valuation looks neither cheap nor expensive.
The share's reaction to the report – down 4.7% on the publication day and the same from the release to 29 October – suggests the market expected more. With a neutral multiple and negative cash flow, further movement will depend on a recovery in operating cash flow and on the margin holding.
Valuation on the latest reported figures
| Metric | Value |
|---|---|
| Market cap | 18.5 bn USD |
| P/E (LTM) | 15.9 |
| EV/EBITDA (LTM) | 11.5 |
| P/B | 1.16 |
| Net debt / EBITDA (LTM) | 3.38 |
| Operating cash flow (LTM) | -0.95 bn |
| ROE | 7.9% |
| Dividend yield (12m) | 3.0% |
| EV/EBITDA, 3-year average | 11.1 |
Bottom line
The report's strengths are net profit growth of 91.6% to USD 318 mn and a reduction in net debt to USD 9,751 mn from 14,069 mn a year earlier. But profit grew on margin, not revenue, which added only 7.4% after 88.3% in the second quarter. Operating cash flow is negative at minus USD 1,176 mn for the quarter – the main question for a holder is whether profit will convert into cash. With EV/EBITDA of 11.5 against its own three-year average of 11.1 the stock is neutrally valued, and a 3.0% dividend yield offers no premium for risk. The verdict is neutral: the arguments for profit and debt are balanced by weak cash flow and decelerating revenue.
Open the company's financial profile BG →
See also: market overview · valuation map · stock screeners