Baytex Energy: WTI rose 31.7% but revenue fell 35.9% – the 422.7m gap is not about price
Contents
On 10 November Baytex Energy released its third-quarter 2026 results. The average WTI price in the reported period was 85.4 USD against 64.9 USD a year earlier (+31.7%), yet revenue fell 35.9% to 431.3m USD, EBITDA declined 19.7% to 244.7m USD, and net profit rose 391.9% to 114.1m USD. At the year-ago volumes and costs and current prices, our calculation implies revenue of 854m USD and EBITDA of 485.7m USD; the company actually earned 422.7m and 241.0m less respectively. With EV/EBITDA LTM at 5.45x, negative net debt and a 1.16% dividend yield, the share looks rather attractive, but only if the gap to the price-implied level proves one-off rather than structural.
Key takeaways
— WTI averaged 85.4 USD against 64.9 USD a year earlier – price was on revenue's side, yet revenue still fell 35.9%
— At year-ago volumes and costs, our calculation implies EBITDA of 485.7m USD – actual was 244.7m, a gap of 241.0m
— EBITDA margin rose to 56.7% from 45.3%, and that is not price's doing – with price up 31.7%, revenue nearly halved
— Net profit of 114.1m USD at a 26.5% margin against 3.4% a year earlier – a 3.9x increase while EBITDA fell 19.7%
— Net debt is negative: from 1.4bn USD on 30 September 2025 to minus 0.4bn on 30 September 2026, a 1.8bn change over 12 months
— Operating cash flow of 201.5m USD against capex of 146.3m – free cash flow is positive but thin relative to EBITDA
— A 1.16% dividend yield with EV/EBITDA LTM at 5.45x and the portal model's +29% upside – the dividend is not the main argument, the share price is
Attractiveness
Key figures, USD bn
| Metric | Q3 2025 | Q3 2026 | Change |
|---|---|---|---|
| Revenue | 0.67 | 0.43 | -35.9% |
| EBITDA | 0.30 | 0.24 | -19.7% |
| Operating profit | 0.10 | 0.14 | +39.9% |
| Net profit | 0.02 | 0.11 | +391.9% |
| Operating cash flow | 0.34 | 0.20 | -41.2% |
| EBITDA margin | 45.3% | 56.7% | +11.4 pp |
| Net margin | 3.4% | 26.5% | +23.1 pp |
WTI averaged 85.4 USD against 64.9 USD a year earlier – price was on revenue's side, yet revenue still fell 35.9%
The average WTI price in the third quarter of 2026 was 85.4 USD per barrel against 64.9 USD a year earlier, up 31.7%. Against the previous quarter the price fell 7.9% from 92.8 USD. Spot on 10 November is 86.1 USD, 0.9% above the reported-period average.
Henry Hub gas averaged 2.893 USD against 3.083 USD a year earlier, down 6.2%; against the previous quarter, down 1.1%. Spot is now 3.31 USD, 14.4% above the reported-period average. Propane rose 5.8% year on year to 0.73 USD but fell 8.6% quarter on quarter; spot at 1.195 USD is 63.7% above the average.
Oil accounts for 85% of sales in the portal model, gas and propane 5% each. The price backdrop in the quarter was clearly better than a year earlier, which is why the 35.9% fall in revenue to 431.3m USD cannot be explained by price – the cause lies elsewhere.
Commodity prices: period average and now
| Benchmark | Year ago | Q3 2026 | YoY | Spot 2026-11-10 |
|---|---|---|---|---|
| WTI, USD | 64,9 | 85,4 | +31,7% | 86,1 |
| Henry Hub, USD | 3,08 | 2,89 | -6,2% | 3,31 |
| Propane, USD | 0,69 | 0,73 | +5,8% | 1,20 |
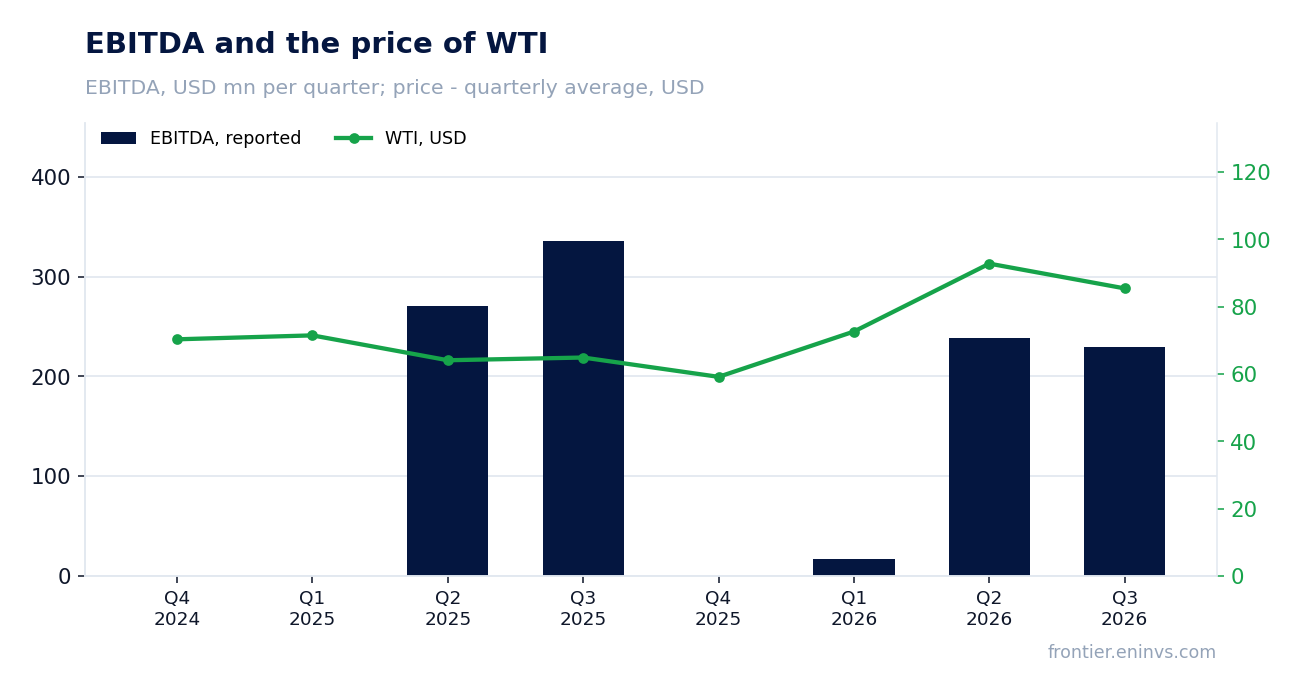
At year-ago volumes and costs, our calculation implies EBITDA of 485.7m USD – actual was 244.7m, a gap of 241.0m
Holding third-quarter 2025 volumes and non-commodity costs and moving only reported-period prices, revenue would have been 854m USD and EBITDA 485.7m USD. The price effect alone would have added 181.0m, or 26.9%, to revenue.
Actual revenue was 431.3m USD – 422.7m, or 49.5%, below the price-implied level; EBITDA was 244.7m, 241.0m, or 49.6%, below. The gap is almost symmetric across revenue and EBITDA, meaning it arose before costs, not in them.
Against the previous quarter the picture reverses: at second-quarter 2026 volumes and costs, prices would have implied revenue of 427m USD and EBITDA of 205.5m. Actual revenue is 4.3m, or 1.0%, higher, and EBITDA 39.2m, or 19.1%, higher. So the company earned less than prices allowed in the second quarter and more in the third.
The facts do not name the cause of the gap to a year earlier. We will not attribute it to volumes, realised price or one-offs – there is no data for that. We record the gap itself: 422.7m on revenue and 241.0m on EBITDA.
What the prices implied and what the company earned
| Base (Q3 2025) | Implied at period prices | Reported | Reported vs implied | |
|---|---|---|---|---|
| Revenue, USD mn | 673,0 | 854,0 | 431,3 | -49,5% |
| EBITDA, USD mn | 304,7 | 485,7 | 244,7 | -49,6% |
Revenue and EBITDA by quarter
| Period | Measure | bn USD |
|---|---|---|
| Q4 2024 | Revenue | −1.1703 |
| Q1 2025 | Revenue | 0.31565699999999997 |
| Q2 2025 | Revenue | 0.297224 |
| Q3 2025 | Revenue | 0.673033 |
| Q4 2025 | Revenue | −0.22619999999999998 |
| Q1 2026 | Revenue | 0.329259 |
| Q2 2026 | Revenue | 0.46026999999999996 |
| Q3 2026 | Revenue | 0.43128500000000003 |
| Q2 2025 | EBITDA | 0.27036899999999997 |
| Q3 2025 | EBITDA | 0.336275 |
| Q1 2026 | EBITDA | 0.017053000000000013 |
| Q2 2026 | EBITDA | 0.23875799999999997 |
| Q3 2026 | EBITDA | 0.229751 |
EBITDA margin
| Period | Measure | % |
|---|---|---|
| Q4 2024 | EBITDA margin | — |
| Q1 2025 | EBITDA margin | — |
| Q2 2025 | EBITDA margin | 91.0 |
| Q3 2025 | EBITDA margin | 50.0 |
| Q4 2025 | EBITDA margin | — |
| Q1 2026 | EBITDA margin | 5.2 |
| Q2 2026 | EBITDA margin | 51.9 |
| Q3 2026 | EBITDA margin | 53.3 |
Missing EBITDA shown as zero, as in the original chart
EBITDA margin rose to 56.7% from 45.3%, and that is not price's doing – with price up 31.7%, revenue nearly halved
The EBITDA margin in the reported quarter was 56.7% against 45.3% a year earlier. An 11.4 percentage-point rise in margin alongside a 35.9% fall in revenue means costs fell faster than revenue – either within cost of sales or in operating expenses.
The facts do not disclose which line produced this effect. We will not name production, realised price or unit costs as the driver – that requires data from the statements we do not have. Only the result is visible: EBITDA of 244.7m USD on revenue of 431.3m.
What matters more for an investor: the margin rose not because the company became more efficient, but because revenue fell faster than costs. If the gap to the price-implied level is one-off, the margin will return to a lower level as revenue recovers. If structural, 56.7% may prove a new ceiling rather than a floor.
Net profit of 114.1m USD at a 26.5% margin against 3.4% a year earlier – a 3.9x increase while EBITDA fell 19.7%
Net profit in the reported quarter was 114.1m USD against 23.2m a year earlier, up 391.9%. The net margin was 26.5% against 3.4%. At the same time EBITDA fell 19.7% to 244.7m and operating profit was 136.4m.
The divergence between falling EBITDA and a 3.9x rise in net profit means something below operating profit increased the result. The facts do not name the line – it could be taxes, interest expense, FX or one-off income. We will not guess.
What matters for earnings quality is the scale: 114.1m of net profit on 244.7m of EBITDA is a high conversion, unusual for a company with falling revenue. If it is one-off, the next quarter will show materially lower profit on the same EBITDA.
Net debt
at each reporting date, current net debt / EBITDA (LTM) = -0.45
| Period | Measure | bn USD |
|---|---|---|
| Q4 2024 | Net debt | 1.60218 |
| Q1 2025 | Net debt | 1.546694 |
| Q2 2025 | Net debt | 1.53573 |
| Q3 2025 | Net debt | 1.424175 |
| Q4 2025 | Net debt | −0.625012 |
| Q1 2026 | Net debt | −0.47422400000000003 |
| Q2 2026 | Net debt | −0.43597900000000006 |
| Q3 2026 | Net debt | −0.38987700000000003 |
Net debt is negative: from 1.4bn USD on 30 September 2025 to minus 0.4bn on 30 September 2026, a 1.8bn change over 12 months
Net debt on 30 September 2026 was minus 0.4bn USD. A year earlier, on 30 September 2025, it was 1.4bn USD – a 1.8bn change over 12 months. Against the previous reporting date, 30 June 2026, net debt was minus 0.4bn, so it did not change over the quarter.
Negative net debt means cash and equivalents exceed debt obligations. The net debt to LTM EBITDA ratio is minus 0.45. We do not assess the direction of this ratio: the earlier value is not in the facts.
For a shareholder this is a strength of the report: the company is not burdened by debt and has a liquidity cushion. But negative net debt does not create value by itself – it only reduces risk. The question is where the free cash goes: dividends, buybacks or drilling.
Operating cash flow of 201.5m USD against capex of 146.3m – free cash flow is positive but thin relative to EBITDA
Operating cash flow in the reported quarter was 201.5m USD, capex 146.3m. Free cash flow before dividends is about 55m USD. On EBITDA of 244.7m, conversion to operating cash flow is 82%, normal for an oil and gas company.
Capex of 146.3m is 60% of EBITDA. To hold production flat with 11.8 years of reserve life, the company must reinvest a significant share of the flow. If prices fall, free cash flow will compress quickly.
Over the last 12 months operating cash flow was 619.9m USD on revenue of 1100m and EBITDA of 876m. That is a retrospective earned at past prices and should not be mixed with quarterly figures.
Share price, three years
close, last point 2026-11-09
| Period | Measure | USD per share |
|---|---|---|
| 2025-11-10 | Closing price | 2.5899999141693115 |
| 2025-11-11 | Closing price | 2.6700000762939453 |
| 2025-11-12 | Closing price | 3.0299999713897705 |
| 2025-11-13 | Closing price | 3.140000104904175 |
| 2025-11-14 | Closing price | 3.1600000858306885 |
| 2025-11-17 | Closing price | 3.0199999809265137 |
| 2025-11-18 | Closing price | 3.140000104904175 |
| 2025-11-19 | Closing price | 3.180000066757202 |
| 2025-11-20 | Closing price | 3.1600000858306885 |
| 2025-11-21 | Closing price | 3.180000066757202 |
| 2025-11-24 | Closing price | 3.240000009536743 |
| 2025-11-25 | Closing price | 3.1700000762939453 |
| 2025-11-26 | Closing price | 3.1600000858306885 |
| 2025-11-28 | Closing price | 3.2200000286102295 |
| 2025-12-01 | Closing price | 3.2200000286102295 |
| 2025-12-02 | Closing price | 3.1700000762939453 |
| 2025-12-03 | Closing price | 3.25 |
| 2025-12-04 | Closing price | 3.200000047683716 |
| 2025-12-05 | Closing price | 3.25 |
| 2025-12-08 | Closing price | 3.1700000762939453 |
| 2025-12-09 | Closing price | 3.0899999141693115 |
| 2025-12-10 | Closing price | 3.0999999046325684 |
| 2025-12-11 | Closing price | 3.0399999618530273 |
| 2025-12-12 | Closing price | 3.0299999713897705 |
| 2025-12-15 | Closing price | 3.0999999046325684 |
| 2025-12-16 | Closing price | 3.009999990463257 |
| 2025-12-17 | Closing price | 3.1500000953674316 |
| 2025-12-18 | Closing price | 3.0399999618530273 |
| 2025-12-19 | Closing price | 3.0899999141693115 |
| 2025-12-22 | Closing price | 3.119999885559082 |
| 2025-12-23 | Closing price | 3.1600000858306885 |
| 2025-12-24 | Closing price | 3.1600000858306885 |
| 2025-12-26 | Closing price | 3.119999885559082 |
| 2025-12-29 | Closing price | 3.1700000762939453 |
| 2025-12-30 | Closing price | 3.240000009536743 |
| 2025-12-31 | Closing price | 3.2300000190734863 |
| 2026-01-02 | Closing price | 3.299999952316284 |
| 2026-01-05 | Closing price | 3.200000047683716 |
| 2026-01-06 | Closing price | 3.109999895095825 |
| 2026-01-07 | Closing price | 3.109999895095825 |
| 2026-01-08 | Closing price | 3.3299999237060547 |
| 2026-01-09 | Closing price | 3.309999942779541 |
| 2026-01-12 | Closing price | 3.390000104904175 |
| 2026-01-13 | Closing price | 3.3399999141693115 |
| 2026-01-14 | Closing price | 3.369999885559082 |
| 2026-01-15 | Closing price | 3.380000114440918 |
| 2026-01-16 | Closing price | 3.299999952316284 |
| 2026-01-20 | Closing price | 3.3499999046325684 |
| 2026-01-21 | Closing price | 3.440000057220459 |
| 2026-01-22 | Closing price | 3.2300000190734863 |
| 2026-01-23 | Closing price | 3.319999933242798 |
| 2026-01-26 | Closing price | 3.3399999141693115 |
| 2026-01-27 | Closing price | 3.4100000858306885 |
| 2026-01-28 | Closing price | 3.450000047683716 |
| 2026-01-29 | Closing price | 3.490000009536743 |
| 2026-01-30 | Closing price | 3.430000066757202 |
| 2026-02-02 | Closing price | 3.369999885559082 |
| 2026-02-03 | Closing price | 3.5199999809265137 |
| 2026-02-04 | Closing price | 3.5299999713897705 |
| 2026-02-05 | Closing price | 3.390000104904175 |
| 2026-02-06 | Closing price | 3.5299999713897705 |
| 2026-02-09 | Closing price | 3.5899999141693115 |
| 2026-02-10 | Closing price | 3.559999942779541 |
| 2026-02-11 | Closing price | 3.619999885559082 |
| 2026-02-12 | Closing price | 3.390000104904175 |
| 2026-02-13 | Closing price | 3.4700000286102295 |
| 2026-02-17 | Closing price | 3.440000057220459 |
| 2026-02-18 | Closing price | 3.619999885559082 |
| 2026-02-19 | Closing price | 3.799999952316284 |
| 2026-02-20 | Closing price | 3.7699999809265137 |
| 2026-02-23 | Closing price | 3.7300000190734863 |
| 2026-02-24 | Closing price | 3.7699999809265137 |
| 2026-02-25 | Closing price | 3.700000047683716 |
| 2026-02-26 | Closing price | 3.75 |
| 2026-02-27 | Closing price | 3.8399999141693115 |
| 2026-03-02 | Closing price | 3.859999895095825 |
| 2026-03-03 | Closing price | 3.859999895095825 |
| 2026-03-04 | Closing price | 3.9800000190734863 |
| 2026-03-05 | Closing price | 3.9800000190734863 |
| 2026-03-06 | Closing price | 3.950000047683716 |
| 2026-03-09 | Closing price | 3.9600000381469727 |
| 2026-03-10 | Closing price | 4.0 |
| 2026-03-11 | Closing price | 4.099999904632568 |
| 2026-03-12 | Closing price | 4.019999980926514 |
| 2026-03-13 | Closing price | 4.039999961853027 |
| 2026-03-16 | Closing price | 4.059999942779541 |
| 2026-03-17 | Closing price | 4.099999904632568 |
| 2026-03-18 | Closing price | 4.130000114440918 |
| 2026-03-19 | Closing price | 4.170000076293945 |
| 2026-03-20 | Closing price | 4.110000133514404 |
| 2026-03-23 | Closing price | 4.099999904632568 |
| 2026-03-24 | Closing price | 4.110000133514404 |
| 2026-03-25 | Closing price | 4.190000057220459 |
| 2026-03-26 | Closing price | 4.21999979019165 |
| 2026-03-27 | Closing price | 4.329999923706055 |
| 2026-03-30 | Closing price | 4.349999904632568 |
| 2026-03-31 | Closing price | 4.46999979019165 |
| 2026-04-01 | Closing price | 4.239999771118164 |
| 2026-04-02 | Closing price | 4.25 |
| 2026-04-06 | Closing price | 4.400000095367432 |
| 2026-04-07 | Closing price | 4.460000038146973 |
| 2026-04-08 | Closing price | 4.159999847412109 |
| 2026-04-09 | Closing price | 4.039999961853027 |
| 2026-04-10 | Closing price | 4.119999885559082 |
| 2026-04-13 | Closing price | 4.289999961853027 |
| 2026-04-14 | Closing price | 4.210000038146973 |
| 2026-04-15 | Closing price | 4.210000038146973 |
| 2026-04-16 | Closing price | 4.309999942779541 |
| 2026-04-17 | Closing price | 4.059999942779541 |
| 2026-04-20 | Closing price | 4.21999979019165 |
| 2026-04-21 | Closing price | 4.329999923706055 |
| 2026-04-22 | Closing price | 4.46999979019165 |
| 2026-04-23 | Closing price | 4.610000133514404 |
| 2026-04-24 | Closing price | 4.579999923706055 |
| 2026-04-27 | Closing price | 4.739999771118164 |
| 2026-04-28 | Closing price | 4.960000038146973 |
| 2026-04-29 | Closing price | 5.139999866485596 |
| 2026-04-30 | Closing price | 5.059999942779541 |
| 2026-05-01 | Closing price | 4.980000019073486 |
| 2026-05-04 | Closing price | 5.119999885559082 |
| 2026-05-05 | Closing price | 5.230000019073486 |
| 2026-05-06 | Closing price | 4.980000019073486 |
| 2026-05-07 | Closing price | 4.860000133514404 |
| 2026-05-08 | Closing price | 4.829999923706055 |
| 2026-05-11 | Closing price | 4.800000190734863 |
| 2026-05-12 | Closing price | 4.929999828338623 |
| 2026-05-13 | Closing price | 4.960000038146973 |
| 2026-05-14 | Closing price | 4.960000038146973 |
| 2026-05-15 | Closing price | 5.170000076293945 |
| 2026-05-18 | Closing price | 5.289999961853027 |
| 2026-05-19 | Closing price | 5.320000171661377 |
| 2026-05-20 | Closing price | 5.190000057220459 |
| 2026-05-21 | Closing price | 5.110000133514404 |
| 2026-05-22 | Closing price | 5.150000095367432 |
| 2026-05-26 | Closing price | 4.900000095367432 |
| 2026-05-27 | Closing price | 4.730000019073486 |
| 2026-05-28 | Closing price | 4.909999847412109 |
| 2026-05-29 | Closing price | 4.889999866485596 |
| 2026-06-01 | Closing price | 4.949999809265137 |
| 2026-06-02 | Closing price | 5.0 |
| 2026-06-03 | Closing price | 5.039999961853027 |
| 2026-06-04 | Closing price | 5.079999923706055 |
| 2026-06-05 | Closing price | 4.760000228881836 |
| 2026-06-08 | Closing price | 4.909999847412109 |
| 2026-06-09 | Closing price | 4.710000038146973 |
| 2026-06-10 | Closing price | 4.75 |
| 2026-06-11 | Closing price | 4.679999828338623 |
| 2026-06-12 | Closing price | 4.639999866485596 |
| 2026-06-15 | Closing price | 4.389999866485596 |
| 2026-06-16 | Closing price | 4.21999979019165 |
| 2026-06-17 | Closing price | 4.090000152587891 |
| 2026-06-18 | Closing price | 3.9800000190734863 |
| 2026-06-22 | Closing price | 4.03000020980835 |
| 2026-06-23 | Closing price | 4.090000152587891 |
| 2026-06-24 | Closing price | 3.9100000858306885 |
| 2026-06-25 | Closing price | 3.990000009536743 |
| 2026-06-26 | Closing price | 3.990000009536743 |
| 2026-06-29 | Closing price | 4.010000228881836 |
| 2026-06-30 | Closing price | 4.0 |
| 2026-07-01 | Closing price | 3.9100000858306885 |
| 2026-07-02 | Closing price | 3.890000104904175 |
| 2026-07-06 | Closing price | 3.8499999046325684 |
| 2026-07-07 | Closing price | 4.010000228881836 |
| 2026-07-08 | Closing price | 4.150000095367432 |
| 2026-07-09 | Closing price | 4.050000190734863 |
| 2026-07-10 | Closing price | 4.070000171661377 |
| 2026-07-13 | Closing price | 4.210000038146973 |
| 2026-07-14 | Closing price | 4.239999771118164 |
| 2026-07-15 | Closing price | 4.130000114440918 |
| 2026-07-16 | Closing price | 4.099999904632568 |
| 2026-07-17 | Closing price | 4.179999828338623 |
| 2026-07-20 | Closing price | 4.190000057220459 |
| 2026-07-21 | Closing price | 4.230000019073486 |
| 2026-07-22 | Closing price | 4.289999961853027 |
| 2026-07-23 | Closing price | 4.389999866485596 |
| 2026-07-24 | Closing price | 4.320000171661377 |
| 2026-07-27 | Closing price | 4.130000114440918 |
| 2026-07-28 | Closing price | 4.010000228881836 |
| 2026-07-29 | Closing price | 4.150000095367432 |
| 2026-07-30 | Closing price | 4.260000228881836 |
| 2026-07-31 | Closing price | 4.559999942779541 |
| 2026-08-03 | Closing price | 4.380000114440918 |
| 2026-08-04 | Closing price | 4.230000019073486 |
| 2026-08-05 | Closing price | 4.090000152587891 |
| 2026-08-06 | Closing price | 4.139999866485596 |
| 2026-08-07 | Closing price | 4.179999828338623 |
| 2026-08-10 | Closing price | 4.380000114440918 |
| 2026-08-11 | Closing price | 4.400000095367432 |
| 2026-08-12 | Closing price | 4.360000133514404 |
| 2026-08-13 | Closing price | 4.289999961853027 |
| 2026-08-14 | Closing price | 4.369999885559082 |
| 2026-08-17 | Closing price | 4.550000190734863 |
| 2026-08-18 | Closing price | 4.679999828338623 |
| 2026-08-19 | Closing price | 4.730000019073486 |
| 2026-08-20 | Closing price | 4.820000171661377 |
| 2026-08-21 | Closing price | 4.809999942779541 |
| 2026-08-24 | Closing price | 4.71999979019165 |
| 2026-08-25 | Closing price | 4.610000133514404 |
| 2026-08-26 | Closing price | 4.679999828338623 |
| 2026-08-27 | Closing price | 4.820000171661377 |
| 2026-08-28 | Closing price | 4.739999771118164 |
| 2026-08-31 | Closing price | 4.869999885559082 |
| 2026-09-01 | Closing price | 5.0 |
| 2026-09-02 | Closing price | 5.070000171661377 |
| 2026-09-03 | Closing price | 4.949999809265137 |
| 2026-09-04 | Closing price | 4.860000133514404 |
| 2026-09-08 | Closing price | 4.889999866485596 |
| 2026-09-09 | Closing price | 4.989999771118164 |
| 2026-09-10 | Closing price | 5.039999961853027 |
| 2026-09-11 | Closing price | 5.03000020980835 |
| 2026-09-14 | Closing price | 5.03000020980835 |
| 2026-09-15 | Closing price | 5.170000076293945 |
| 2026-09-16 | Closing price | 4.889999866485596 |
| 2026-09-17 | Closing price | 4.849999904632568 |
| 2026-09-18 | Closing price | 4.840000152587891 |
| 2026-09-21 | Closing price | 4.670000076293945 |
| 2026-09-22 | Closing price | 4.579999923706055 |
| 2026-09-23 | Closing price | 4.579999923706055 |
| 2026-09-24 | Closing price | 4.590000152587891 |
| 2026-09-25 | Closing price | 4.53000020980835 |
| 2026-09-28 | Closing price | 4.53000020980835 |
| 2026-09-29 | Closing price | 4.46999979019165 |
| 2026-09-30 | Closing price | 4.53000020980835 |
| 2026-10-01 | Closing price | 4.559999942779541 |
| 2026-10-02 | Closing price | 4.630000114440918 |
| 2026-10-05 | Closing price | 4.679999828338623 |
| 2026-10-06 | Closing price | 4.690000057220459 |
| 2026-10-07 | Closing price | 4.579999923706055 |
| 2026-10-08 | Closing price | 4.739999771118164 |
| 2026-10-09 | Closing price | 4.809999942779541 |
| 2026-10-12 | Closing price | 4.869999885559082 |
| 2026-10-13 | Closing price | 5.019999980926514 |
| 2026-10-14 | Closing price | 5.079999923706055 |
| 2026-10-15 | Closing price | 5.159999847412109 |
| 2026-10-16 | Closing price | 5.309999942779541 |
| 2026-10-19 | Closing price | 5.400000095367432 |
| 2026-10-20 | Closing price | 5.369999885559082 |
| 2026-10-21 | Closing price | 5.400000095367432 |
| 2026-10-22 | Closing price | 5.320000171661377 |
| 2026-10-23 | Closing price | 5.5 |
| 2026-10-26 | Closing price | 5.53000020980835 |
| 2026-10-27 | Closing price | 5.420000076293945 |
| 2026-10-28 | Closing price | 5.460000038146973 |
| 2026-10-29 | Closing price | 5.369999885559082 |
| 2026-10-30 | Closing price | 5.380000114440918 |
| 2026-11-02 | Closing price | 4.789999961853027 |
| 2026-11-03 | Closing price | 4.78000020980835 |
| 2026-11-04 | Closing price | 4.440000057220459 |
| 2026-11-05 | Closing price | 4.21999979019165 |
| 2026-11-06 | Closing price | 4.179999828338623 |
| 2026-11-09 | Closing price | 4.090000152587891 |
A 1.16% dividend yield with EV/EBITDA LTM at 5.45x and the portal model's +29% upside – the dividend is not the main argument, the share price is
The trailing 12-month dividend yield is 1.16%. That is a modest level: with the key rate well above this yield, the dividend does not compensate for the risk of holding the share. The company pays, but the payout is not the basis of the investment case.
EV/EBITDA LTM is 5.45x. Return on equity is 30.2%. Market capitalisation is 3.17bn USD. With negative net debt, EV is close to market cap, and the multiple mainly reflects operating profit.
On the portal's model, re-pricing EBITDA to current commodity prices at the target EV/EBITDA puts the upside of the share to its model fair value at +29%. This is our own estimate, not a consensus or a target price. It rests on current WTI of 86.1 USD and Henry Hub of 3.31 USD.
The dividend in this configuration is a pleasant addition, not a reason to buy. If the company directs part of its free cash to higher payouts, the yield could rise, but there are no signals of that yet.
Valuation on the latest reported figures
| Metric | Value |
|---|---|
| Market cap | 3.17 bn USD |
| EV/EBITDA (LTM) | 5.5 |
| P/B | 1.04 |
| Net debt / EBITDA (LTM) | -0.45 |
| Operating cash flow (LTM) | 0.62 bn |
| ROE | 30.2% |
| Dividend yield (12m) | 1.2% |
Net profit by quarter
| Period | Measure | bn USD |
|---|---|---|
| Q4 2024 | Net profit | −0.029109999999999987 |
| Q1 2025 | Net profit | 0.048369 |
| Q2 2025 | Net profit | 0.109587 |
| Q3 2025 | Net profit | 0.023194 |
| Q4 2025 | Net profit | −0.613241 |
| Q1 2026 | Net profit | −0.04894 |
| Q2 2026 | Net profit | 0.125772 |
| Q3 2026 | Net profit | 0.114088 |
Bottom line
The strengths of the report are real: negative net debt, a 56.7% EBITDA margin, net profit of 114.1m USD and positive free cash flow. But the main question is not in these figures – it is in the gap to the price-implied level: with WTI 31.7% higher, revenue fell 35.9%, and the facts do not explain why. Until the cause is named, EBITDA of 244.7m cannot be treated as sustainable. The portal model puts the upside to fair value at +29%, and that is the main argument for the share, but it rests on current oil prices. The verdict is rather attractive: the 5.45x multiple and negative debt outweigh, provided the gap proves one-off.