Cameco: revenue up 1.6%, but EBITDA fell short of what prices implied – and the stock trades 23% above its own history
Contents
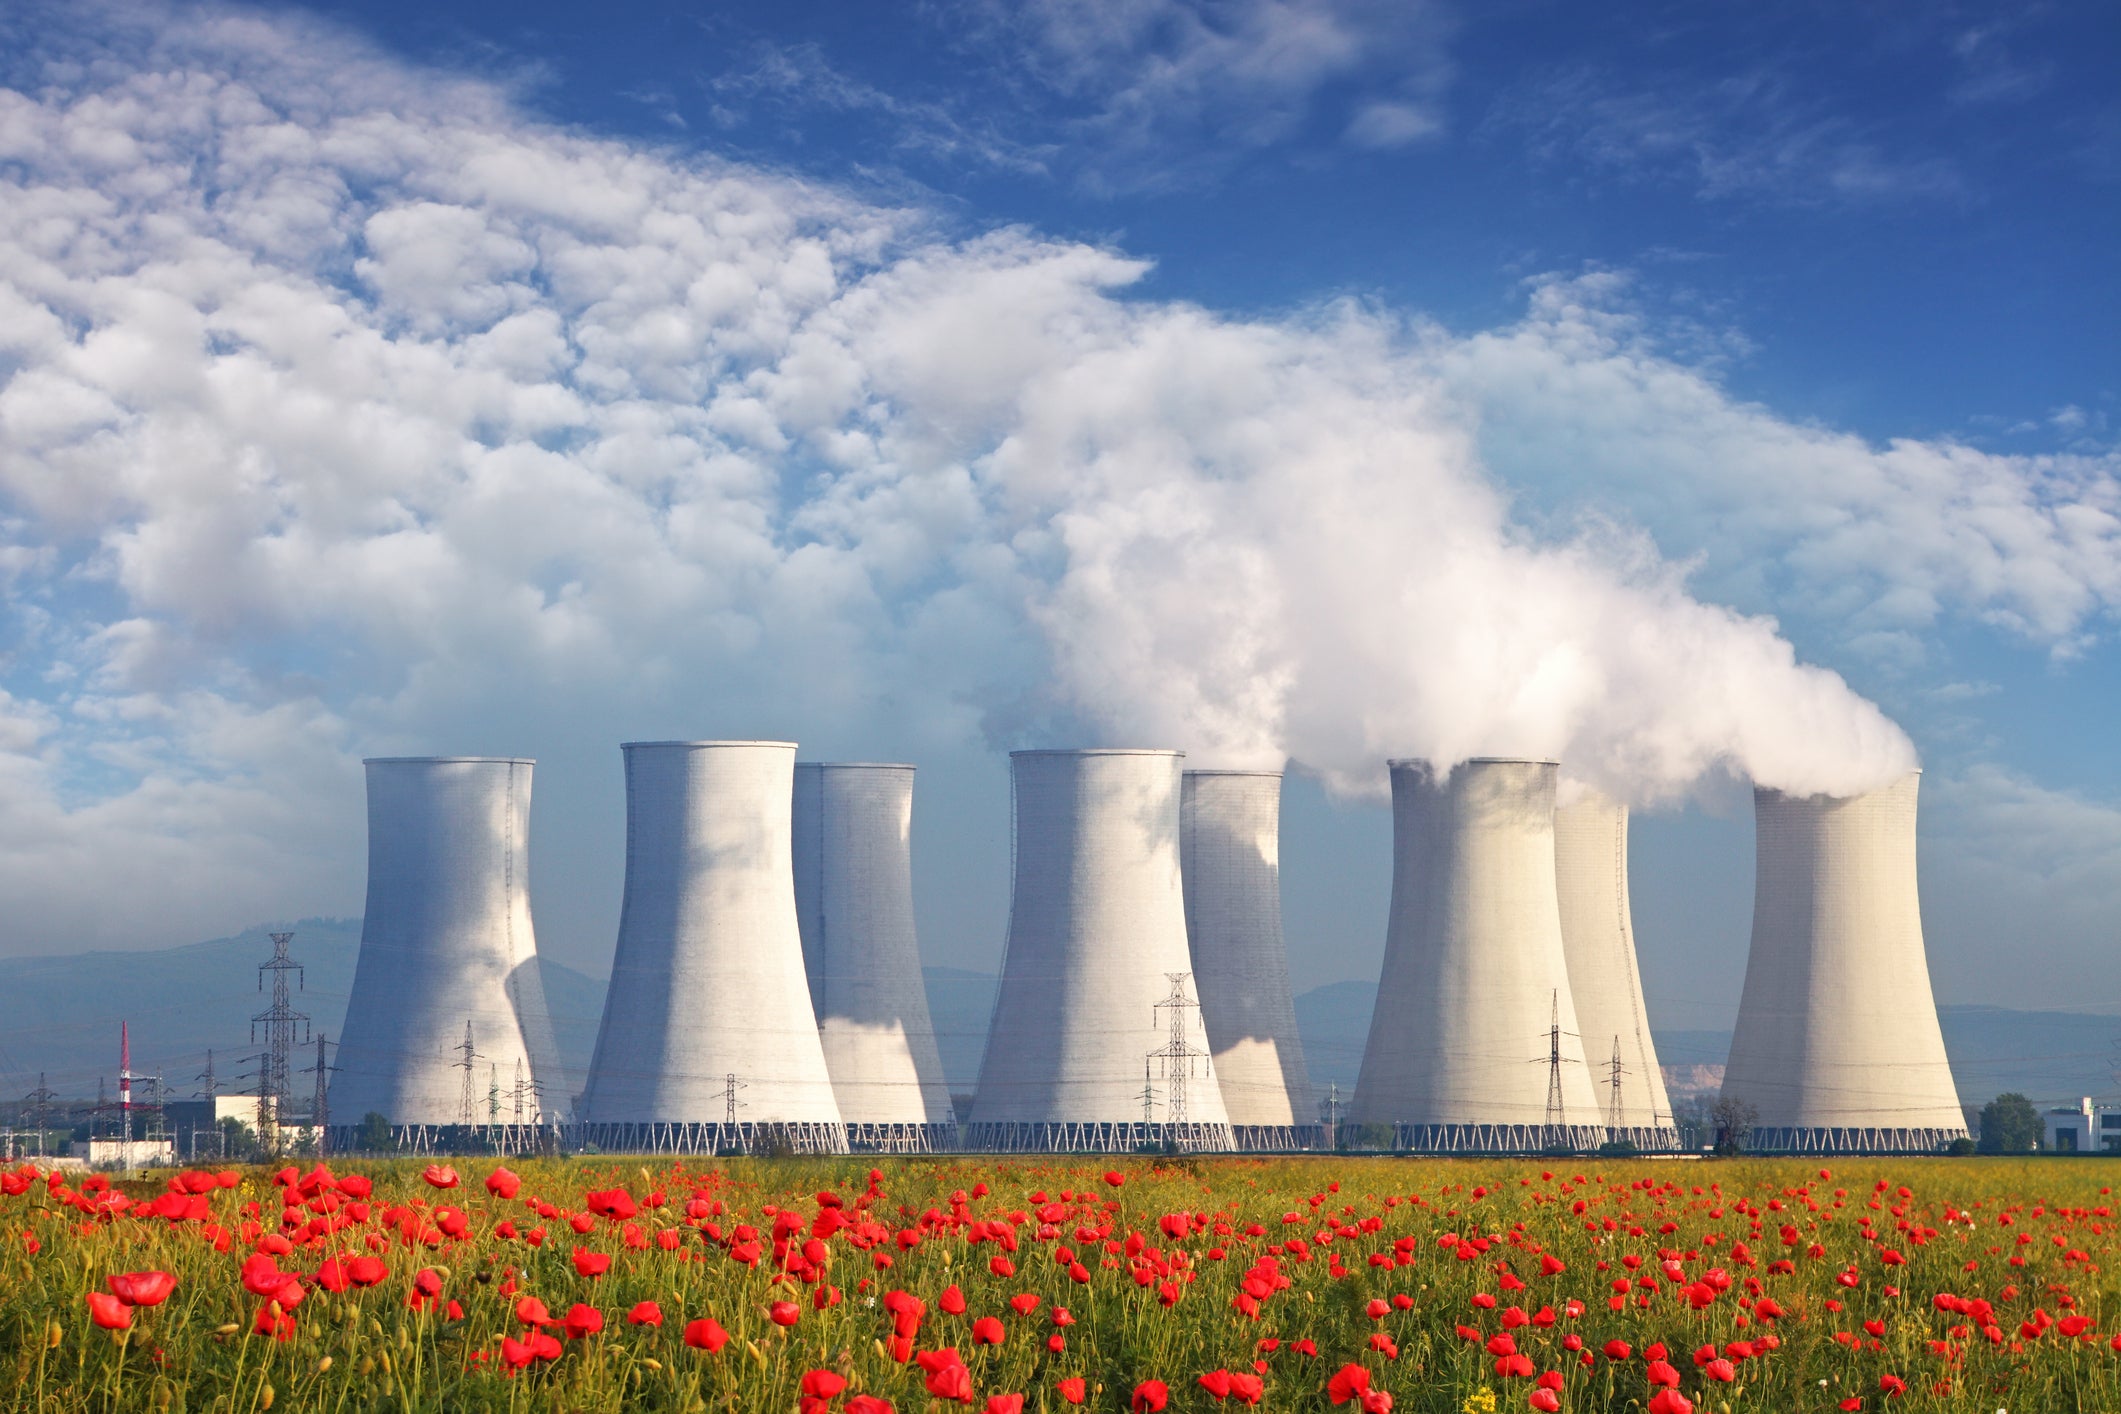
Cameco's Q3 2026 report showed revenue of $446.9m, up just 1.6% year on year, and EBITDA of $95.0m, 18.3% below a year earlier. On our estimate, prices and volumes in the prior four-quarter base implied EBITDA of about $173.3m, so the company earned 45.2% less than the price backdrop suggested. Meanwhile LTM EV/EBITDA is 55.8 against its own three-year average of 45.4, and the portal model puts the share 73% above its modelled fair value. Our verdict: the share is unattractive – the decisive point is that even at today's uranium prices EV/EBITDA stays at 38.8, and the premium to its own history leaves no cushion. Our view: the share is unattractive at the current price; upside on the portal model -73%.
Our view: is there upside
Our view in numbers
| Metric | Our read |
|---|---|
| Verdict | Unattractive |
| Upside on the portal model | -73% |
| How the model works | spot model: EBITDA re-priced to current commodity prices at the target EV/EBITDA, against market cap |
| EV/EBITDA now and 3-year average | 55.8 vs 45.4 – a 23% premium to its history |
| Dividend yield, 12m | 0.2% |
| Net debt / EBITDA | 0.17 – low leverage |
| Strongest case for | The balance sheet is solid: net debt of $99.0m at 0.17x LTM EBITDA and a 22.4-year reserve life give the company time to ride out a weak quarter. |
| Strongest case against | Valuation leaves no cushion: EV/EBITDA of 55.8 is 23% above its own three-year average of 45.4, and the portal model puts the share 73% above fair value. |
| What would change the view | The verdict would improve by one step if EBITDA at today's uranium prices were realised without the model gap – that is, if actual EBITDA approached $821.7m on an annualised basis. |
Key takeaways
— EBITDA of $95.0m is 45.2% below what prices in the prior four-quarter base implied
— EBITDA margin compressed to 21.2% from 26.4% a year earlier, a consequence of both prices and sales mix
— Operating cash flow nearly dried up at $2.4m against capex of $99.1m
— Net debt of $99.0m is just 0.17x LTM EBITDA – leverage is not the problem
— At today's uranium prices EBITDA is modelled at $821.7m and EV/EBITDA at 38.8
— EV/EBITDA of 55.8 is 23% above its own three-year average of 45.4 – there is no cushion
Key figures, USD bn
| Metric | Q3 2025 | Q3 2026 | Change |
|---|---|---|---|
| Revenue | 0.44 | 0.45 | +1.6% |
| EBITDA | 0.12 | 0.09 | -18.3% |
| Operating profit | 0.07 | 0.04 | -38.4% |
| Net profit | -0.00 | 0.03 | to profit |
| Operating cash flow | 0.11 | 0.00 | -97.9% |
| Capex | 0.07 | — | — |
| EBITDA margin | 26.4% | 21.2% | -5.2 pp |
| Net margin | -0.0% | 6.9% | +6.9 pp |
In Q3 2026 Cameco's revenue was $446.9m, up 1.6% year on year. Against Q2, when revenue fell 5.6%, this is an acceleration, but the absolute gain remains small.
For a uranium producer revenue is essentially realised price times sales volume. The report does not break out which of the two drove the increase, so we note only that the quarter was weaker than the previous one in absolute terms – $446.9m versus $592.7m in Q2.
Cameco's seasonality is pronounced: Q4 last year brought $859.4m while Q3 brought only $439.8m. The current result fits that pattern but gives no grounds to speak of a qualitative improvement.
EBITDA of $95.0m is 45.2% below what prices in the prior four-quarter base implied
On the portal's spot model, average prices of the prior four quarters re-priced to this period's levels implied EBITDA of about $173.3m on revenue of $670.5m. The company actually earned $95.0m – 45.2% less – while revenue came in 33.3% below the model.
The gap is not random: over the four prior periods reported EBITDA deviated from the model by between -4.0% and -58.8%. The price-averaged model systematically overstates Cameco's result, likely because contract structure and delivery timing do not track spot.
For an investor this means the current uranium price feeds into Cameco's earnings with a lag and not in full. Valuing the share on spot EBITDA without adjusting for that gap would be a mistake.
What the prices implied and what the company earned
| Base (—) | Implied at period prices | Reported | Reported vs implied | |
|---|---|---|---|---|
| EBITDA, portal spot model, USD mn | — | 173,3 | 95,0 | -45,2% |
Revenue and EBITDA by quarter
| Period | Measure | bn USD |
|---|---|---|
| Q4 2024 | Revenue | 0.8635030000000001 |
| Q1 2025 | Revenue | 0.5649529999999999 |
| Q2 2025 | Revenue | 0.627632 |
| Q3 2025 | Revenue | 0.439803 |
| Q4 2025 | Revenue | 0.859439 |
| Q1 2026 | Revenue | 0.615749 |
| Q2 2026 | Revenue | 0.592737 |
| Q3 2026 | Revenue | 0.446899 |
| Q4 2024 | EBITDA | 0.202098 |
| Q1 2025 | EBITDA | 0.17793 |
| Q2 2025 | EBITDA | 0.180645 |
| Q3 2025 | EBITDA | 0.116273 |
| Q4 2025 | EBITDA | 0.20842000000000002 |
| Q1 2026 | EBITDA | 0.168435 |
| Q2 2026 | EBITDA | 0.106563 |
| Q3 2026 | EBITDA | 0.087329 |
EBITDA margin
| Period | Measure | % |
|---|---|---|
| Q4 2024 | EBITDA margin | 23.4 |
| Q1 2025 | EBITDA margin | 31.5 |
| Q2 2025 | EBITDA margin | 28.8 |
| Q3 2025 | EBITDA margin | 26.4 |
| Q4 2025 | EBITDA margin | 24.3 |
| Q1 2026 | EBITDA margin | 27.4 |
| Q2 2026 | EBITDA margin | 18.0 |
| Q3 2026 | EBITDA margin | 19.5 |
EBITDA margin compressed to 21.2% from 26.4% a year earlier, a consequence of both prices and sales mix
The EBITDA margin in the reported quarter was 21.2% against 26.4% a year earlier. A 5.2 percentage-point compression on revenue that grew 1.6% means unit costs or the share of lower-margin sales increased.
Operating profit was $41.0m and net profit $30.8m, a 6.9% net margin; a year earlier the net margin was around zero. The improvement in net profit alongside falling EBITDA reflects one-off items that the provided data do not detail.
Margin resilience is the key question for the share. If the compression stems from temporary contract structure it is reversible; if from rising cash cost of production it is not. The report gives no answer, which is itself an argument against buying.
Operating cash flow nearly dried up at $2.4m against capex of $99.1m
Operating cash flow for the quarter was just $2.4m while capital expenditure reached $99.1m. The $96.7m gap means the company funded investment from sources other than current operations.
For a uranium producer capex is not discretionary – it is the condition for maintaining output. With a stated reserve life of 22.4 years, mine investment is necessary and cannot be deferred without losing future volumes.
Weak cash flow against high capex is the report's main risk. If it repeats next quarter the company may resort to borrowing or cut the programme, hurting future production.
Net debt of $99.0m is just 0.17x LTM EBITDA – leverage is not the problem
At end-September 2026 Cameco's net debt was $99.0m, equal to 0.17x LTM EBITDA. That is a low level: even if EBITDA halved, leverage would remain comfortable.
At today's uranium prices the net debt to EBITDA ratio is modelled at 0.12. The balance sheet constrains neither dividends nor capex – the problem is not debt but the ability to generate profit.
Low leverage is the one element of the report that raises no questions. But on its own it does not make the share attractive: debt capacity is valuable only when there is profit to build on it.
Valuation vs its own history
now vs the 3-year average
| Period | Measure | × |
|---|---|---|
| EV/EBITDA | Now | 55.8051074079879 |
| EV/EBITDA | 3-year average | 45.38833281995944 |
At today's uranium prices EBITDA is modelled at $821.7m and EV/EBITDA at 38.8
On the portal's spot model, at current uranium prices Cameco's annual EBITDA would be $821.7m against $566.9m over the last 12 months – a 45.0% increase. That is the earnings base valuation should start from, since LTM reflects past prices.
Even on that higher base EV/EBITDA is 38.8 and net debt to EBITDA 0.12. For a commodity producer such a multiple is high: it assumes either sustained high prices or volume growth that the report does not show.
Reserve life of 22.4 years at the current production rate is solid but does not offset the valuation. The market has already priced a favourable price scenario into the share, and further gains need a new catalyst.
Share price, three years
close, last point 2026-11-10
| Period | Measure | USD per share |
|---|---|---|
| 2025-11-10 | Closing price | 94.23999786376953 |
| 2025-11-11 | Closing price | 92.5199966430664 |
| 2025-11-12 | Closing price | 92.56999969482422 |
| 2025-11-13 | Closing price | 85.9800033569336 |
| 2025-11-14 | Closing price | 84.76000213623047 |
| 2025-11-17 | Closing price | 83.02999877929688 |
| 2025-11-18 | Closing price | 83.30000305175781 |
| 2025-11-19 | Closing price | 86.23999786376953 |
| 2025-11-20 | Closing price | 81.9800033569336 |
| 2025-11-21 | Closing price | 79.44000244140625 |
| 2025-11-24 | Closing price | 83.33999633789062 |
| 2025-11-25 | Closing price | 87.3499984741211 |
| 2025-11-26 | Closing price | 88.80999755859375 |
| 2025-11-28 | Closing price | 88.51000213623047 |
| 2025-12-01 | Closing price | 87.52999877929688 |
| 2025-12-02 | Closing price | 88.2300033569336 |
| 2025-12-03 | Closing price | 89.44999694824219 |
| 2025-12-04 | Closing price | 94.08999633789062 |
| 2025-12-05 | Closing price | 91.2699966430664 |
| 2025-12-08 | Closing price | 90.9000015258789 |
| 2025-12-09 | Closing price | 93.36000061035156 |
| 2025-12-10 | Closing price | 93.76000213623047 |
| 2025-12-11 | Closing price | 95.73999786376953 |
| 2025-12-12 | Closing price | 91.48999786376953 |
| 2025-12-15 | Closing price | 89.77999877929688 |
| 2025-12-16 | Closing price | 87.05000305175781 |
| 2025-12-17 | Closing price | 84.8499984741211 |
| 2025-12-18 | Closing price | 87.58000183105469 |
| 2025-12-19 | Closing price | 89.98999786376953 |
| 2025-12-22 | Closing price | 91.70999908447266 |
| 2025-12-23 | Closing price | 93.41000366210938 |
| 2025-12-24 | Closing price | 93.33999633789062 |
| 2025-12-26 | Closing price | 92.83999633789062 |
| 2025-12-29 | Closing price | 92.83999633789062 |
| 2025-12-30 | Closing price | 91.37000274658203 |
| 2025-12-31 | Closing price | 91.48999786376953 |
| 2026-01-02 | Closing price | 98.55999755859375 |
| 2026-01-05 | Closing price | 100.16999816894531 |
| 2026-01-06 | Closing price | 102.08999633789062 |
| 2026-01-07 | Closing price | 103.94000244140625 |
| 2026-01-08 | Closing price | 105.76000213623047 |
| 2026-01-09 | Closing price | 107.55999755859375 |
| 2026-01-12 | Closing price | 109.79000091552734 |
| 2026-01-13 | Closing price | 108.91999816894531 |
| 2026-01-14 | Closing price | 110.79000091552734 |
| 2026-01-15 | Closing price | 112.83999633789062 |
| 2026-01-16 | Closing price | 116.44000244140625 |
| 2026-01-20 | Closing price | 115.80000305175781 |
| 2026-01-21 | Closing price | 122.33000183105469 |
| 2026-01-22 | Closing price | 121.87000274658203 |
| 2026-01-23 | Closing price | 124.04000091552734 |
| 2026-01-26 | Closing price | 121.26000213623047 |
| 2026-01-27 | Closing price | 125.97000122070312 |
| 2026-01-28 | Closing price | 134.08999633789062 |
| 2026-01-29 | Closing price | 133.6699981689453 |
| 2026-01-30 | Closing price | 123.38999938964844 |
| 2026-02-02 | Closing price | 120.20999908447266 |
| 2026-02-03 | Closing price | 126.1500015258789 |
| 2026-02-04 | Closing price | 114.81999969482422 |
| 2026-02-05 | Closing price | 109.27999877929688 |
| 2026-02-06 | Closing price | 113.62999725341797 |
| 2026-02-09 | Closing price | 120.68000030517578 |
| 2026-02-10 | Closing price | 118.08999633789062 |
| 2026-02-11 | Closing price | 119.18000030517578 |
| 2026-02-12 | Closing price | 116.38999938964844 |
| 2026-02-13 | Closing price | 112.9000015258789 |
| 2026-02-17 | Closing price | 112.94000244140625 |
| 2026-02-18 | Closing price | 116.5 |
| 2026-02-19 | Closing price | 119.02999877929688 |
| 2026-02-20 | Closing price | 121.3499984741211 |
| 2026-02-23 | Closing price | 118.75 |
| 2026-02-24 | Closing price | 121.08000183105469 |
| 2026-02-25 | Closing price | 119.72000122070312 |
| 2026-02-26 | Closing price | 118.18000030517578 |
| 2026-02-27 | Closing price | 118.4000015258789 |
| 2026-03-02 | Closing price | 125.73999786376953 |
| 2026-03-03 | Closing price | 117.79000091552734 |
| 2026-03-04 | Closing price | 120.23999786376953 |
| 2026-03-05 | Closing price | 114.23999786376953 |
| 2026-03-06 | Closing price | 109.68000030517578 |
| 2026-03-09 | Closing price | 116.13999938964844 |
| 2026-03-10 | Closing price | 120.08000183105469 |
| 2026-03-11 | Closing price | 115.38999938964844 |
| 2026-03-12 | Closing price | 115.30000305175781 |
| 2026-03-13 | Closing price | 107.91999816894531 |
| 2026-03-16 | Closing price | 110.30999755859375 |
| 2026-03-17 | Closing price | 111.5199966430664 |
| 2026-03-18 | Closing price | 109.4000015258789 |
| 2026-03-19 | Closing price | 106.5999984741211 |
| 2026-03-20 | Closing price | 101.55000305175781 |
| 2026-03-23 | Closing price | 105.56999969482422 |
| 2026-03-24 | Closing price | 108.04000091552734 |
| 2026-03-25 | Closing price | 109.0199966430664 |
| 2026-03-26 | Closing price | 104.66999816894531 |
| 2026-03-27 | Closing price | 103.91999816894531 |
| 2026-03-30 | Closing price | 102.83999633789062 |
| 2026-03-31 | Closing price | 108.61000061035156 |
| 2026-04-01 | Closing price | 111.12999725341797 |
| 2026-04-02 | Closing price | 112.56999969482422 |
| 2026-04-06 | Closing price | 110.4800033569336 |
| 2026-04-07 | Closing price | 110.2300033569336 |
| 2026-04-08 | Closing price | 115.9000015258789 |
| 2026-04-09 | Closing price | 115.54000091552734 |
| 2026-04-10 | Closing price | 116.04000091552734 |
| 2026-04-13 | Closing price | 116.69999694824219 |
| 2026-04-14 | Closing price | 116.05999755859375 |
| 2026-04-15 | Closing price | 119.11000061035156 |
| 2026-04-16 | Closing price | 120.2699966430664 |
| 2026-04-17 | Closing price | 120.66000366210938 |
| 2026-04-20 | Closing price | 123.62000274658203 |
| 2026-04-21 | Closing price | 116.61000061035156 |
| 2026-04-22 | Closing price | 126.47000122070312 |
| 2026-04-23 | Closing price | 123.8499984741211 |
| 2026-04-24 | Closing price | 122.1500015258789 |
| 2026-04-27 | Closing price | 123.11000061035156 |
| 2026-04-28 | Closing price | 116.30999755859375 |
| 2026-04-29 | Closing price | 114.29000091552734 |
| 2026-04-30 | Closing price | 123.04000091552734 |
| 2026-05-01 | Closing price | 120.5999984741211 |
| 2026-05-04 | Closing price | 118.26000213623047 |
| 2026-05-05 | Closing price | 114.45999908447266 |
| 2026-05-06 | Closing price | 123.76000213623047 |
| 2026-05-07 | Closing price | 118.70999908447266 |
| 2026-05-08 | Closing price | 116.75 |
| 2026-05-11 | Closing price | 120.13999938964844 |
| 2026-05-12 | Closing price | 116.93000030517578 |
| 2026-05-13 | Closing price | 115.38999938964844 |
| 2026-05-14 | Closing price | 112.51000213623047 |
| 2026-05-15 | Closing price | 107.51000213623047 |
| 2026-05-18 | Closing price | 105.13999938964844 |
| 2026-05-19 | Closing price | 103.5199966430664 |
| 2026-05-20 | Closing price | 104.0199966430664 |
| 2026-05-21 | Closing price | 105.33000183105469 |
| 2026-05-22 | Closing price | 104.75 |
| 2026-05-26 | Closing price | 108.16999816894531 |
| 2026-05-27 | Closing price | 107.44000244140625 |
| 2026-05-28 | Closing price | 110.62999725341797 |
| 2026-05-29 | Closing price | 112.69999694824219 |
| 2026-06-01 | Closing price | 112.58999633789062 |
| 2026-06-02 | Closing price | 120.51000213623047 |
| 2026-06-03 | Closing price | 114.55999755859375 |
| 2026-06-04 | Closing price | 114.0199966430664 |
| 2026-06-05 | Closing price | 103.44000244140625 |
| 2026-06-08 | Closing price | 105.44000244140625 |
| 2026-06-09 | Closing price | 102.2699966430664 |
| 2026-06-10 | Closing price | 95.02999877929688 |
| 2026-06-11 | Closing price | 98.97000122070312 |
| 2026-06-12 | Closing price | 100.95999908447266 |
| 2026-06-15 | Closing price | 107.0199966430664 |
| 2026-06-16 | Closing price | 107.87999725341797 |
| 2026-06-17 | Closing price | 105.66999816894531 |
| 2026-06-18 | Closing price | 106.48999786376953 |
| 2026-06-22 | Closing price | 107.06999969482422 |
| 2026-06-23 | Closing price | 108.88999938964844 |
| 2026-06-24 | Closing price | 106.63999938964844 |
| 2026-06-25 | Closing price | 103.58000183105469 |
| 2026-06-26 | Closing price | 104.48999786376953 |
| 2026-06-29 | Closing price | 103.47000122070312 |
| 2026-06-30 | Closing price | 101.86000061035156 |
| 2026-07-01 | Closing price | 97.38999938964844 |
| 2026-07-02 | Closing price | 96.54000091552734 |
| 2026-07-06 | Closing price | 97.5 |
| 2026-07-07 | Closing price | 94.66999816894531 |
| 2026-07-08 | Closing price | 94.7300033569336 |
| 2026-07-09 | Closing price | 95.73999786376953 |
| 2026-07-10 | Closing price | 95.98999786376953 |
| 2026-07-13 | Closing price | 90.19999694824219 |
| 2026-07-14 | Closing price | 91.56999969482422 |
| 2026-07-15 | Closing price | 90.9800033569336 |
| 2026-07-16 | Closing price | 87.36000061035156 |
| 2026-07-17 | Closing price | 85.62000274658203 |
| 2026-07-20 | Closing price | 84.8499984741211 |
| 2026-07-21 | Closing price | 88.68000030517578 |
| 2026-07-22 | Closing price | 90.37000274658203 |
| 2026-07-23 | Closing price | 89.33000183105469 |
| 2026-07-24 | Closing price | 87.86000061035156 |
| 2026-07-27 | Closing price | 89.3499984741211 |
| 2026-07-28 | Closing price | 86.95999908447266 |
| 2026-07-29 | Closing price | 84.56999969482422 |
| 2026-07-30 | Closing price | 88.2300033569336 |
| 2026-07-31 | Closing price | 86.37999725341797 |
| 2026-08-03 | Closing price | 89.72000122070312 |
| 2026-08-04 | Closing price | 93.08999633789062 |
| 2026-08-05 | Closing price | 94.2699966430664 |
| 2026-08-06 | Closing price | 93.62000274658203 |
| 2026-08-07 | Closing price | 97.38999938964844 |
| 2026-08-10 | Closing price | 97.30999755859375 |
| 2026-08-11 | Closing price | 98.7300033569336 |
| 2026-08-12 | Closing price | 99.02999877929688 |
| 2026-08-13 | Closing price | 97.75 |
| 2026-08-14 | Closing price | 97.73999786376953 |
| 2026-08-17 | Closing price | 98.58000183105469 |
| 2026-08-18 | Closing price | 96.02999877929688 |
| 2026-08-19 | Closing price | 97.9800033569336 |
| 2026-08-20 | Closing price | 95.58999633789062 |
| 2026-08-21 | Closing price | 102.51000213623047 |
| 2026-08-24 | Closing price | 102.2699966430664 |
| 2026-08-25 | Closing price | 106.95999908447266 |
| 2026-08-26 | Closing price | 107.36000061035156 |
| 2026-08-27 | Closing price | 106.33000183105469 |
| 2026-08-28 | Closing price | 100.01000213623047 |
| 2026-08-31 | Closing price | 98.76000213623047 |
| 2026-09-01 | Closing price | 96.26000213623047 |
| 2026-09-02 | Closing price | 96.37999725341797 |
| 2026-09-03 | Closing price | 100.62000274658203 |
| 2026-09-04 | Closing price | 100.73999786376953 |
| 2026-09-08 | Closing price | 101.97000122070312 |
| 2026-09-09 | Closing price | 100.41000366210938 |
| 2026-09-10 | Closing price | 97.41999816894531 |
| 2026-09-11 | Closing price | 96.68000030517578 |
| 2026-09-14 | Closing price | 93.26000213623047 |
| 2026-09-15 | Closing price | 91.20999908447266 |
| 2026-09-16 | Closing price | 90.9000015258789 |
| 2026-09-17 | Closing price | 92.80000305175781 |
| 2026-09-18 | Closing price | 91.62000274658203 |
| 2026-09-21 | Closing price | 93.2300033569336 |
| 2026-09-22 | Closing price | 94.58999633789062 |
| 2026-09-23 | Closing price | 90.80000305175781 |
| 2026-09-24 | Closing price | 88.12000274658203 |
| 2026-09-25 | Closing price | 88.06999969482422 |
| 2026-09-28 | Closing price | 87.04000091552734 |
| 2026-09-29 | Closing price | 86.87999725341797 |
| 2026-09-30 | Closing price | 86.66999816894531 |
| 2026-10-01 | Closing price | 85.69000244140625 |
| 2026-10-02 | Closing price | 85.18000030517578 |
| 2026-10-05 | Closing price | 87.47000122070312 |
| 2026-10-06 | Closing price | 93.0199966430664 |
| 2026-10-07 | Closing price | 89.06999969482422 |
| 2026-10-08 | Closing price | 87.12000274658203 |
| 2026-10-09 | Closing price | 88.05999755859375 |
| 2026-10-12 | Closing price | 86.12000274658203 |
| 2026-10-13 | Closing price | 86.1500015258789 |
| 2026-10-14 | Closing price | 81.47000122070312 |
| 2026-10-15 | Closing price | 83.2300033569336 |
| 2026-10-16 | Closing price | 81.5199966430664 |
| 2026-10-19 | Closing price | 80.69999694824219 |
| 2026-10-20 | Closing price | 80.51000213623047 |
| 2026-10-21 | Closing price | 82.0199966430664 |
| 2026-10-22 | Closing price | 78.93000030517578 |
| 2026-10-23 | Closing price | 78.5999984741211 |
| 2026-10-26 | Closing price | 79.06999969482422 |
| 2026-10-27 | Closing price | 82.41000366210938 |
| 2026-10-28 | Closing price | 83.83999633789062 |
| 2026-10-29 | Closing price | 83.48999786376953 |
| 2026-10-30 | Closing price | 76.91000366210938 |
| 2026-11-02 | Closing price | 73.37999725341797 |
| 2026-11-03 | Closing price | 72.55999755859375 |
| 2026-11-04 | Closing price | 71.68000030517578 |
| 2026-11-05 | Closing price | 68.33000183105469 |
| 2026-11-06 | Closing price | 71.30000305175781 |
| 2026-11-09 | Closing price | 75.37000274658203 |
| 2026-11-10 | Closing price | 72.8949966430664 |
EV/EBITDA of 55.8 is 23% above its own three-year average of 45.4 – there is no cushion
LTM EV/EBITDA is 55.8 against its own three-year average of 45.4 – a 23% premium. The share trades above its usual level on a multiple that is already high for a commodity company.
The LTM P/E is 110.7, reflecting a low profit base. The trailing dividend yield is 0.24%, so the dividend is no argument for the share.
The portal model puts fair value 73% below the current market price. That is our own estimate, not a consensus, but it is consistent with the multiples: the market is paying for a scenario the report does not yet confirm.
Valuation on the latest reported figures
| Metric | Value |
|---|---|
| Market cap | 31.8 bn USD |
| P/E (LTM) | 110.7 |
| EV/EBITDA (LTM) | 55.8 |
| P/B | 6.83 |
| Net debt / EBITDA (LTM) | 0.17 |
| Operating cash flow (LTM) | 0.57 bn |
| ROE | 2.4% |
| Dividend yield (12m) | 0.2% |
| EV/EBITDA, 3-year average | 45.4 |
Net profit by quarter
| Period | Measure | bn USD |
|---|---|---|
| Q4 2024 | Net profit | 0.098909 |
| Q1 2025 | Net profit | 0.049926000000000005 |
| Q2 2025 | Net profit | 0.22964199999999999 |
| Q3 2025 | Net profit | −0.000101 |
| Q4 2025 | Net profit | 0.14246 |
| Q1 2026 | Net profit | 0.09523699999999999 |
| Q2 2026 | Net profit | 0.018369 |
| Q3 2026 | Net profit | 0.030837 |
Bottom line
The report's strength remains the balance sheet: net debt of $99.0m at 0.17x EBITDA and a 22.4-year reserve life. But profitability is weak – EBITDA is 45.2% below what prices implied, the margin compressed to 21.2%, and operating cash flow nearly dried up. Valuation leaves no cushion: EV/EBITDA of 55.8 is 23% above its own history, and the portal model puts the share 73% above fair value. Our verdict: the share is unattractive – the decisive point is that even at today's uranium prices EV/EBITDA stays at 38.8, and the premium to its own history leaves no cushion. Our view: the share is unattractive at the current price; upside on the portal model -73%.