DHT Holdings: the tanker rate rose 13-fold, yet the company earned less than the price allowed
Contents
On 13 November DHT Holdings reported results for the third quarter of 2026. The average VLCC TD3C rate on the Arabian Gulf – China route was 641,110 dollars per day in the period against 48,492 dollars a year earlier, and on that backdrop revenue rose 210.1% to 332.4 million dollars, EBITDA by 431.1% to 306.5 million and net profit by 504.6% to 270.9 million. At the year-ago volumes and costs and today's price, our calculation puts revenue at 791.1 million dollars and EBITDA at 741.6 million, so the company earned 458.6 million less revenue and 435.1 million less EBITDA than the rate allowed. Our conclusion: rather attractive – the portal model puts the upside to fair value at +26%. Our view: the share is rather attractive at the current price; upside on the portal model +26%.
Our view: is there upside
Our view in numbers
| Metric | Our read |
|---|---|
| Verdict | Rather attractive |
| Upside on the portal model | +26% |
| How the model works | spot model: EBITDA re-priced to current commodity prices at the target EV/EBITDA, against market cap |
| EV/EBITDA now and 3-year average | 5.4 vs 6.2 – a 13% discount to its history |
| Dividend yield, 12m | 10.2% |
| Net debt / EBITDA | 0.48 – low leverage |
| Strongest case for | At today's freight rate EV/EBITDA is 2.9 and the dividend yield is 10.2% with leverage of 0.48 LTM EBITDA. |
| Strongest case against | The company earned 435.1 million dollars less EBITDA than the rate allowed, and the gap may recur. |
| What would change the view | A return of the VLCC TD3C rate to 300–400 thousand dollars per day would move the verdict one step down, holding spot above 1 million one step up. |
Key takeaways
— The freight rate rose 13-fold while revenue only tripled, and the 458.6 million dollar gap is not explained by price
— EBITDA of 306.5 million dollars against a price that allowed 741.6 million – the company underperformed its own benchmark in the quarter
— The 92.2% EBITDA margin against 53.8% a year earlier is a price effect, not a cost achievement
— Net profit of 270.9 million dollars is almost equal to EBITDA because leverage is low: net debt of 344.0 million at 0.48 LTM EBITDA
— Operating cash flow of 171.4 million dollars lags profit, and capital expenditure is negative at 95.7 million – vessel sales returned more than was invested
— A 10.2% dividend yield resting on profit rather than one-off sales is the main argument for the share
— EV/EBITDA of 5.4 against its own three-year average of 6.2 is a 13% discount, but at today's freight rate the multiple is 2.9
Key figures, USD bn
| Metric | Q3 2025 | Q3 2026 | Change |
|---|---|---|---|
| Revenue | 0.11 | 0.33 | +210.1% |
| EBITDA | 0.06 | 0.31 | +431.1% |
| Operating profit | 0.03 | 0.24 | +658.3% |
| Net profit | 0.04 | 0.27 | +504.6% |
| Operating cash flow | 0.06 | 0.17 | +181.5% |
| Capex | 0.04 | -0.10 | -348.0% |
| EBITDA margin | 53.8% | 92.2% | +38.4 pp |
| Net margin | 41.8% | 81.5% | +39.7 pp |
The freight rate rose 13-fold while revenue only tripled, and the 458.6 million dollar gap is not explained by price
The average VLCC TD3C rate on the Arabian Gulf – China route was 641,110 dollars per day in the third quarter of 2026 against 48,492 dollars a year earlier, up 1222.1%. Against the previous quarter the rate added 46.1%, and now, on 13 November, spot stands at 1,366,000 dollars per day – a further 113.1% above the reported-period average.
Revenue for the quarter was 332.4 million dollars, up 210.1% year on year and an acceleration from 122.7% in the second quarter. At the year-ago volumes and non-commodity costs and today's rate, our calculation puts revenue at 791.1 million dollars: the price effect is 683.9 million, or 637.9%. In fact the company received 458.6 million less – 58.0% of the calculated figure.
A gap of that size is not explained by price: the rate rose more than revenue. It therefore sits in volumes, in the realised price against the benchmark, or in the revenue mix, where part comes from non-commodity items. We do not find those causes in the report, so we record the fact itself: the company earned materially less than the rate allowed.
Commodity prices: period average and now
| Benchmark | Year ago | Q3 2026 | YoY | Spot 2026-11-13 |
|---|---|---|---|---|
| VLCC TD3C AG-China TCE, USD/day, USD | 48 492 | 641 110 | +1222,1% | 1 366 000 |
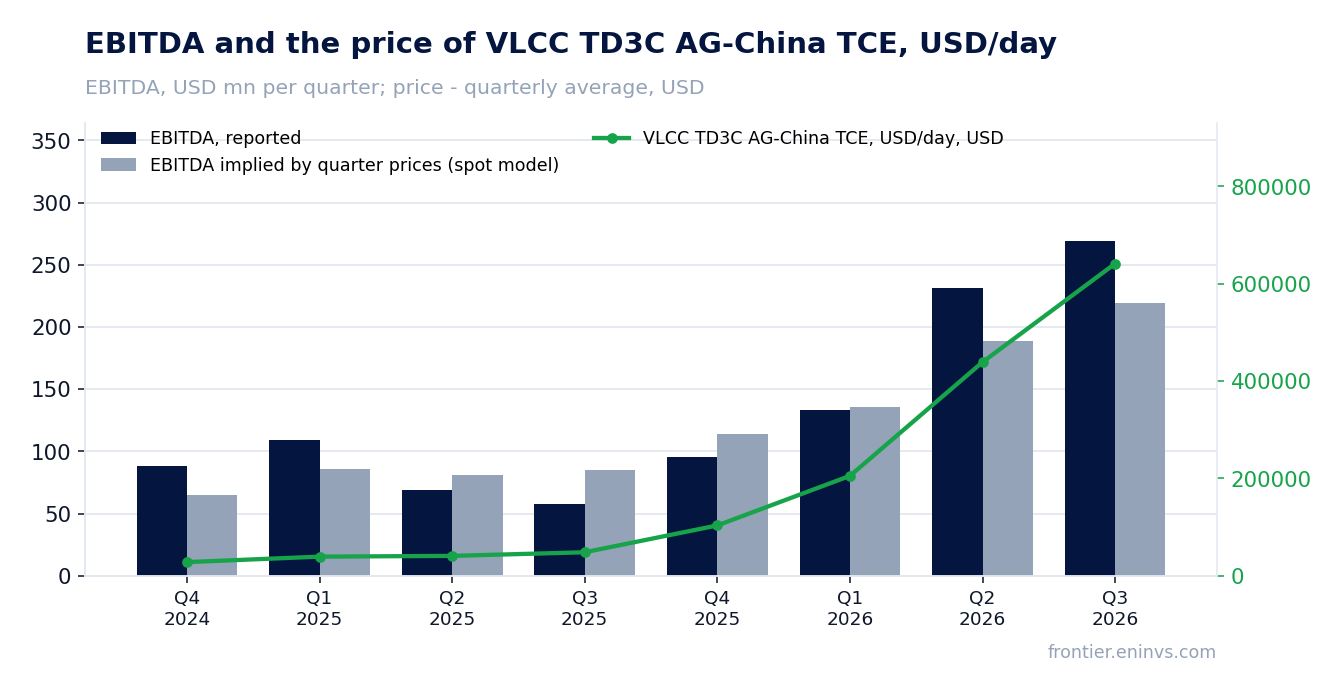
EBITDA of 306.5 million dollars against a price that allowed 741.6 million – the company underperformed its own benchmark
EBITDA for the third quarter was 306.5 million dollars, up 431.1% year on year. At the year-ago volumes and costs and today's rate, our calculation puts it at 741.6 million: a gap of 435.1 million, or 58.7%. Against the previous quarter the picture is different: calculated EBITDA is 299.5 million, actual 306.5 million – 7.0 million, or 2.3%, above the calculation.
So relative to the second quarter the company performed exactly as the rate allowed, while relative to a year earlier it performed materially worse. The reason for the difference between the two comparisons is the base: a year ago the rate was 13 times lower, and any deviation in volumes or realised price produces a huge gap in absolute dollars.
The portal's spot model, re-priced from the average of the previous four quarters, expected EBITDA of 219.5 million and revenue of 272 million dollars; the actual figures are 39.6% and 22.2% above the model. That is the model's run-rate view, and it disagrees with the year-ago calculation because its base holds quarters with lower rates.
What the prices implied and what the company earned
| Base (Q3 2025) | Implied at period prices | Reported | Reported vs implied | |
|---|---|---|---|---|
| Revenue, USD mn | 107,2 | 791,1 | 332,4 | -58,0% |
| EBITDA, USD mn | 57,7 | 741,6 | 306,5 | -58,7% |
| EBITDA, portal spot model, USD mn | — | 219,5 | 306,5 | +39,6% |
Revenue and EBITDA by quarter
| Period | Measure | bn USD |
|---|---|---|
| Q4 2024 | Revenue | 0.1308 |
| Q1 2025 | Revenue | 0.1182 |
| Q2 2025 | Revenue | 0.1279 |
| Q3 2025 | Revenue | 0.1072 |
| Q4 2025 | Revenue | 0.1439 |
| Q1 2026 | Revenue | 0.18630000000000002 |
| Q2 2026 | Revenue | 0.2848 |
| Q3 2026 | Revenue | 0.33241899999999996 |
| Q4 2024 | EBITDA | 0.0885 |
| Q1 2025 | EBITDA | 0.10931400000000004 |
| Q2 2025 | EBITDA | 0.068993 |
| Q3 2025 | EBITDA | 0.057703000000000004 |
| Q4 2025 | EBITDA | 0.095332 |
| Q1 2026 | EBITDA | 0.13331 |
| Q2 2026 | EBITDA | 0.230983 |
| Q3 2026 | EBITDA | 0.269468 |
EBITDA margin
| Period | Measure | % |
|---|---|---|
| Q4 2024 | EBITDA margin | 67.7 |
| Q1 2025 | EBITDA margin | 92.5 |
| Q2 2025 | EBITDA margin | 53.9 |
| Q3 2025 | EBITDA margin | 53.8 |
| Q4 2025 | EBITDA margin | 66.2 |
| Q1 2026 | EBITDA margin | 71.6 |
| Q2 2026 | EBITDA margin | 81.1 |
| Q3 2026 | EBITDA margin | 81.1 |
The 92.2% EBITDA margin against 53.8% a year earlier is a price effect, not a cost achievement
The EBITDA margin in the reported quarter was 92.2% against 53.8% a year earlier, the net margin 81.5% against 41.8%. Such a margin rise with fixed fleet operating costs is a direct consequence of the rate: revenue per vessel rose several-fold, while crew, fuel and maintenance costs do not rise that way.
Operating profit was 240.6 million dollars, 65.8 million below EBITDA, so depreciation and other non-cash items are about a fifth of EBITDA. That is a normal structure for a shipowner and does not change the conclusion: the margin is high because the rate is high, not because the company became more efficient.
Net profit of 270.9 million dollars is almost equal to EBITDA because leverage is low: net debt of 344.0 million at 0.48 LTM EBITDA
Net profit for the quarter was 270.9 million dollars, up 504.6% year on year. It is almost equal to EBITDA because interest costs on net debt of 344.0 million dollars are small: net debt to LTM EBITDA is 0.48. That is a level, not a trend: no earlier value is in the facts.
Over the last twelve months net profit was 699.8 million dollars against EBITDA of 722.8 million – a difference of only 23.0 million, confirming the low cost of servicing debt. With such leverage profit hardly depends on interest rates, an important advantage over shipowners with higher gearing.
Operating cash flow of 171.4 million dollars lags profit, and capital expenditure is negative at 95.7 million – vessel sales returned more than was invested
Operating cash flow for the quarter was 171.4 million dollars against net profit of 270.9 million. The 99.5 million gap is explained by working-capital changes and non-cash items; for a shipowner this is normal when revenue arrives with a voyage lag.
Capital expenditure is negative at minus 95.7 million dollars: the company sold vessels and returned more cash than it invested. Together with operating cash flow that gives 267.1 million dollars of free funds before dividends, which allows a high payout without raising debt.
Over the last twelve months operating cash flow was 562.6 million dollars. Negative capex in the reported quarter is a one-off tied to fleet sales and is unlikely to repeat at the same scale next quarter.
Valuation vs its own history
now vs the 3-year average
| Period | Measure | × |
|---|---|---|
| EV/EBITDA | Now | 5.384799546998806 |
| EV/EBITDA | 3-year average | 6.189680794684829 |
A 10.2% dividend yield resting on profit rather than one-off sales is the main argument for the share
The trailing twelve-month dividend yield is 10.2% on a market capitalisation of 3,582.0 million dollars. That is a high yield for a shipowner, and it rests on profit: over twelve months the company earned 699.8 million dollars net, comfortably enough for the payouts.
Our estimate for the 2026 dividend – based on profit and the current payout policy – assumes a yield around the double-digit level, but it hinges on the fourth-quarter freight rate and on whether the practice of distributing almost all profit continues. The quarter's negative capex supports the payout, but it is one-off.
What could reduce the payout: a rate falling below 300–400 thousand dollars per day, a rise in capital expenditure to renew the fleet, or a decision to direct cash to debt repayment. With net debt of 344.0 million dollars and 0.48 LTM EBITDA there is no need for that, so the base case is maintained payouts.
Share price, three years
close, last point 2026-11-12
| Period | Measure | USD per share |
|---|---|---|
| 2025-11-13 | Closing price | 13.59000015258789 |
| 2025-11-14 | Closing price | 13.670000076293945 |
| 2025-11-17 | Closing price | 13.579999923706055 |
| 2025-11-18 | Closing price | 13.630000114440918 |
| 2025-11-19 | Closing price | 13.3100004196167 |
| 2025-11-20 | Closing price | 13.329999923706055 |
| 2025-11-21 | Closing price | 13.729999542236328 |
| 2025-11-24 | Closing price | 13.319999694824219 |
| 2025-11-25 | Closing price | 13.029999732971191 |
| 2025-11-26 | Closing price | 13.020000457763672 |
| 2025-11-28 | Closing price | 13.029999732971191 |
| 2025-12-01 | Closing price | 12.899999618530273 |
| 2025-12-02 | Closing price | 12.84000015258789 |
| 2025-12-03 | Closing price | 12.920000076293945 |
| 2025-12-04 | Closing price | 12.75 |
| 2025-12-05 | Closing price | 12.760000228881836 |
| 2025-12-08 | Closing price | 12.789999961853027 |
| 2025-12-09 | Closing price | 12.520000457763672 |
| 2025-12-10 | Closing price | 12.479999542236328 |
| 2025-12-11 | Closing price | 12.600000381469727 |
| 2025-12-12 | Closing price | 12.4399995803833 |
| 2025-12-15 | Closing price | 12.5 |
| 2025-12-16 | Closing price | 12.510000228881836 |
| 2025-12-17 | Closing price | 12.65999984741211 |
| 2025-12-18 | Closing price | 12.449999809265137 |
| 2025-12-19 | Closing price | 12.229999542236328 |
| 2025-12-22 | Closing price | 12.199999809265137 |
| 2025-12-23 | Closing price | 12.100000381469727 |
| 2025-12-24 | Closing price | 12.109999656677246 |
| 2025-12-26 | Closing price | 12.220000267028809 |
| 2025-12-29 | Closing price | 12.300000190734863 |
| 2025-12-30 | Closing price | 12.140000343322754 |
| 2025-12-31 | Closing price | 12.210000038146973 |
| 2026-01-02 | Closing price | 11.739999771118164 |
| 2026-01-05 | Closing price | 11.640000343322754 |
| 2026-01-06 | Closing price | 12.020000457763672 |
| 2026-01-07 | Closing price | 13.109999656677246 |
| 2026-01-08 | Closing price | 13.430000305175781 |
| 2026-01-09 | Closing price | 13.420000076293945 |
| 2026-01-12 | Closing price | 13.210000038146973 |
| 2026-01-13 | Closing price | 13.489999771118164 |
| 2026-01-14 | Closing price | 13.720000267028809 |
| 2026-01-15 | Closing price | 13.279999732971191 |
| 2026-01-16 | Closing price | 13.260000228881836 |
| 2026-01-20 | Closing price | 13.319999694824219 |
| 2026-01-21 | Closing price | 13.399999618530273 |
| 2026-01-22 | Closing price | 13.399999618530273 |
| 2026-01-23 | Closing price | 13.819999694824219 |
| 2026-01-26 | Closing price | 13.649999618530273 |
| 2026-01-27 | Closing price | 13.609999656677246 |
| 2026-01-28 | Closing price | 13.819999694824219 |
| 2026-01-29 | Closing price | 14.100000381469727 |
| 2026-01-30 | Closing price | 14.329999923706055 |
| 2026-02-02 | Closing price | 14.350000381469727 |
| 2026-02-03 | Closing price | 14.3100004196167 |
| 2026-02-04 | Closing price | 13.9399995803833 |
| 2026-02-05 | Closing price | 14.229999542236328 |
| 2026-02-06 | Closing price | 14.869999885559082 |
| 2026-02-09 | Closing price | 14.890000343322754 |
| 2026-02-10 | Closing price | 15.0600004196167 |
| 2026-02-11 | Closing price | 15.479999542236328 |
| 2026-02-12 | Closing price | 15.420000076293945 |
| 2026-02-13 | Closing price | 15.90999984741211 |
| 2026-02-17 | Closing price | 16.270000457763672 |
| 2026-02-18 | Closing price | 16.68000030517578 |
| 2026-02-19 | Closing price | 16.889999389648438 |
| 2026-02-20 | Closing price | 17.450000762939453 |
| 2026-02-23 | Closing price | 17.530000686645508 |
| 2026-02-24 | Closing price | 18.700000762939453 |
| 2026-02-25 | Closing price | 18.68000030517578 |
| 2026-02-26 | Closing price | 19.170000076293945 |
| 2026-02-27 | Closing price | 19.489999771118164 |
| 2026-03-02 | Closing price | 19.649999618530273 |
| 2026-03-03 | Closing price | 19.260000228881836 |
| 2026-03-04 | Closing price | 18.6200008392334 |
| 2026-03-05 | Closing price | 18.540000915527344 |
| 2026-03-06 | Closing price | 18.06999969482422 |
| 2026-03-09 | Closing price | 18.969999313354492 |
| 2026-03-10 | Closing price | 18.6299991607666 |
| 2026-03-11 | Closing price | 17.8700008392334 |
| 2026-03-12 | Closing price | 16.84000015258789 |
| 2026-03-13 | Closing price | 16.850000381469727 |
| 2026-03-16 | Closing price | 17.489999771118164 |
| 2026-03-17 | Closing price | 16.889999389648438 |
| 2026-03-18 | Closing price | 17.5 |
| 2026-03-19 | Closing price | 17.860000610351562 |
| 2026-03-20 | Closing price | 17.270000457763672 |
| 2026-03-23 | Closing price | 17.770000457763672 |
| 2026-03-24 | Closing price | 18.520000457763672 |
| 2026-03-25 | Closing price | 17.780000686645508 |
| 2026-03-26 | Closing price | 17.81999969482422 |
| 2026-03-27 | Closing price | 18.100000381469727 |
| 2026-03-30 | Closing price | 17.93000030517578 |
| 2026-03-31 | Closing price | 18.270000457763672 |
| 2026-04-01 | Closing price | 18.110000610351562 |
| 2026-04-02 | Closing price | 18.65999984741211 |
| 2026-04-06 | Closing price | 18.510000228881836 |
| 2026-04-07 | Closing price | 17.59000015258789 |
| 2026-04-08 | Closing price | 18.350000381469727 |
| 2026-04-09 | Closing price | 17.799999237060547 |
| 2026-04-10 | Closing price | 17.459999084472656 |
| 2026-04-13 | Closing price | 17.56999969482422 |
| 2026-04-14 | Closing price | 17.18000030517578 |
| 2026-04-15 | Closing price | 17.65999984741211 |
| 2026-04-16 | Closing price | 17.719999313354492 |
| 2026-04-17 | Closing price | 18.31999969482422 |
| 2026-04-20 | Closing price | 18.65999984741211 |
| 2026-04-21 | Closing price | 17.989999771118164 |
| 2026-04-22 | Closing price | 17.739999771118164 |
| 2026-04-23 | Closing price | 17.790000915527344 |
| 2026-04-24 | Closing price | 18.059999465942383 |
| 2026-04-27 | Closing price | 18.34000015258789 |
| 2026-04-28 | Closing price | 18.290000915527344 |
| 2026-04-29 | Closing price | 18.270000457763672 |
| 2026-04-30 | Closing price | 18.479999542236328 |
| 2026-05-01 | Closing price | 18.8700008392334 |
| 2026-05-04 | Closing price | 18.59000015258789 |
| 2026-05-05 | Closing price | 19.100000381469727 |
| 2026-05-06 | Closing price | 18.940000534057617 |
| 2026-05-07 | Closing price | 19.020000457763672 |
| 2026-05-08 | Closing price | 19.0 |
| 2026-05-11 | Closing price | 18.729999542236328 |
| 2026-05-12 | Closing price | 18.719999313354492 |
| 2026-05-13 | Closing price | 17.809999465942383 |
| 2026-05-14 | Closing price | 17.850000381469727 |
| 2026-05-15 | Closing price | 17.639999389648438 |
| 2026-05-18 | Closing price | 17.90999984741211 |
| 2026-05-19 | Closing price | 17.600000381469727 |
| 2026-05-20 | Closing price | 18.31999969482422 |
| 2026-05-21 | Closing price | 17.760000228881836 |
| 2026-05-22 | Closing price | 17.3799991607666 |
| 2026-05-26 | Closing price | 17.399999618530273 |
| 2026-05-27 | Closing price | 16.90999984741211 |
| 2026-05-28 | Closing price | 16.350000381469727 |
| 2026-05-29 | Closing price | 16.31999969482422 |
| 2026-06-01 | Closing price | 16.649999618530273 |
| 2026-06-02 | Closing price | 16.459999084472656 |
| 2026-06-03 | Closing price | 16.389999389648438 |
| 2026-06-04 | Closing price | 16.239999771118164 |
| 2026-06-05 | Closing price | 16.649999618530273 |
| 2026-06-08 | Closing price | 16.440000534057617 |
| 2026-06-09 | Closing price | 16.719999313354492 |
| 2026-06-10 | Closing price | 16.600000381469727 |
| 2026-06-11 | Closing price | 16.649999618530273 |
| 2026-06-12 | Closing price | 17.56999969482422 |
| 2026-06-15 | Closing price | 18.479999542236328 |
| 2026-06-16 | Closing price | 18.40999984741211 |
| 2026-06-17 | Closing price | 18.110000610351562 |
| 2026-06-18 | Closing price | 18.889999389648438 |
| 2026-06-22 | Closing price | 19.770000457763672 |
| 2026-06-23 | Closing price | 19.959999084472656 |
| 2026-06-24 | Closing price | 19.389999389648438 |
| 2026-06-25 | Closing price | 18.079999923706055 |
| 2026-06-26 | Closing price | 17.649999618530273 |
| 2026-06-29 | Closing price | 17.079999923706055 |
| 2026-06-30 | Closing price | 16.530000686645508 |
| 2026-07-01 | Closing price | 16.530000686645508 |
| 2026-07-02 | Closing price | 17.18000030517578 |
| 2026-07-06 | Closing price | 17.149999618530273 |
| 2026-07-07 | Closing price | 17.290000915527344 |
| 2026-07-08 | Closing price | 17.719999313354492 |
| 2026-07-09 | Closing price | 16.93000030517578 |
| 2026-07-10 | Closing price | 17.760000228881836 |
| 2026-07-13 | Closing price | 17.309999465942383 |
| 2026-07-14 | Closing price | 18.18000030517578 |
| 2026-07-15 | Closing price | 18.010000228881836 |
| 2026-07-16 | Closing price | 17.84000015258789 |
| 2026-07-17 | Closing price | 17.40999984741211 |
| 2026-07-20 | Closing price | 17.889999389648438 |
| 2026-07-21 | Closing price | 18.469999313354492 |
| 2026-07-22 | Closing price | 18.1299991607666 |
| 2026-07-23 | Closing price | 18.40999984741211 |
| 2026-07-24 | Closing price | 18.450000762939453 |
| 2026-07-27 | Closing price | 18.290000915527344 |
| 2026-07-28 | Closing price | 18.59000015258789 |
| 2026-07-29 | Closing price | 18.549999237060547 |
| 2026-07-30 | Closing price | 18.549999237060547 |
| 2026-07-31 | Closing price | 18.56999969482422 |
| 2026-08-03 | Closing price | 18.530000686645508 |
| 2026-08-04 | Closing price | 18.139999389648438 |
| 2026-08-05 | Closing price | 17.8700008392334 |
| 2026-08-06 | Closing price | 18.350000381469727 |
| 2026-08-07 | Closing price | 18.760000228881836 |
| 2026-08-10 | Closing price | 18.329999923706055 |
| 2026-08-11 | Closing price | 18.200000762939453 |
| 2026-08-12 | Closing price | 18.719999313354492 |
| 2026-08-13 | Closing price | 19.200000762939453 |
| 2026-08-14 | Closing price | 19.520000457763672 |
| 2026-08-17 | Closing price | 18.899999618530273 |
| 2026-08-18 | Closing price | 19.309999465942383 |
| 2026-08-19 | Closing price | 19.989999771118164 |
| 2026-08-20 | Closing price | 19.799999237060547 |
| 2026-08-21 | Closing price | 19.81999969482422 |
| 2026-08-24 | Closing price | 19.719999313354492 |
| 2026-08-25 | Closing price | 19.170000076293945 |
| 2026-08-26 | Closing price | 18.31999969482422 |
| 2026-08-27 | Closing price | 19.350000381469727 |
| 2026-08-28 | Closing price | 19.65999984741211 |
| 2026-08-31 | Closing price | 19.600000381469727 |
| 2026-09-01 | Closing price | 19.690000534057617 |
| 2026-09-02 | Closing price | 20.06999969482422 |
| 2026-09-03 | Closing price | 20.190000534057617 |
| 2026-09-04 | Closing price | 20.8700008392334 |
| 2026-09-08 | Closing price | 20.81999969482422 |
| 2026-09-09 | Closing price | 21.200000762939453 |
| 2026-09-10 | Closing price | 21.43000030517578 |
| 2026-09-11 | Closing price | 22.0 |
| 2026-09-14 | Closing price | 22.149999618530273 |
| 2026-09-15 | Closing price | 22.139999389648438 |
| 2026-09-16 | Closing price | 23.040000915527344 |
| 2026-09-17 | Closing price | 22.81999969482422 |
| 2026-09-18 | Closing price | 23.270000457763672 |
| 2026-09-21 | Closing price | 22.450000762939453 |
| 2026-09-22 | Closing price | 21.389999389648438 |
| 2026-09-23 | Closing price | 21.280000686645508 |
| 2026-09-24 | Closing price | 21.68000030517578 |
| 2026-09-25 | Closing price | 21.780000686645508 |
| 2026-09-28 | Closing price | 21.899999618530273 |
| 2026-09-29 | Closing price | 22.420000076293945 |
| 2026-09-30 | Closing price | 22.56999969482422 |
| 2026-10-01 | Closing price | 23.559999465942383 |
| 2026-10-02 | Closing price | 23.68000030517578 |
| 2026-10-05 | Closing price | 23.81999969482422 |
| 2026-10-06 | Closing price | 23.520000457763672 |
| 2026-10-07 | Closing price | 23.709999084472656 |
| 2026-10-08 | Closing price | 24.93000030517578 |
| 2026-10-09 | Closing price | 24.639999389648438 |
| 2026-10-12 | Closing price | 26.219999313354492 |
| 2026-10-13 | Closing price | 26.59000015258789 |
| 2026-10-14 | Closing price | 24.950000762939453 |
| 2026-10-15 | Closing price | 23.43000030517578 |
| 2026-10-16 | Closing price | 23.600000381469727 |
| 2026-10-19 | Closing price | 23.030000686645508 |
| 2026-10-20 | Closing price | 23.350000381469727 |
| 2026-10-21 | Closing price | 24.15999984741211 |
| 2026-10-22 | Closing price | 24.1200008392334 |
| 2026-10-23 | Closing price | 24.600000381469727 |
| 2026-10-26 | Closing price | 24.600000381469727 |
| 2026-10-27 | Closing price | 24.1299991607666 |
| 2026-10-28 | Closing price | 24.459999084472656 |
| 2026-10-29 | Closing price | 25.079999923706055 |
| 2026-10-30 | Closing price | 25.020000457763672 |
| 2026-11-02 | Closing price | 23.860000610351562 |
| 2026-11-03 | Closing price | 23.920000076293945 |
| 2026-11-04 | Closing price | 22.049999237060547 |
| 2026-11-05 | Closing price | 20.479999542236328 |
| 2026-11-06 | Closing price | 20.68000030517578 |
| 2026-11-09 | Closing price | 20.559999465942383 |
| 2026-11-10 | Closing price | 20.809999465942383 |
| 2026-11-11 | Closing price | 21.56999969482422 |
| 2026-11-12 | Closing price | 22.280000686645508 |
EV/EBITDA of 5.4 against its own three-year average of 6.2 is a 13% discount, but at today's freight rate the multiple is 2.9
EV/EBITDA over the last twelve months is 5.4 against its own three-year average of 6.2, a 13% discount. The trailing P/E is 5.1. On the historical multiple the share is cheaper than usual, but LTM earnings were earned at rates below today's.
On the portal's spot model, at today's rate annual EBITDA is 1,357 million dollars against 766.1 million over the last twelve months, up 77.1%. EV/EBITDA at the current price is 2.9, net debt to EBITDA 0.25. That is the base from which a shipowner's valuation should start.
The portal model puts the upside to fair value at +26%. That is our own estimate, not a market consensus. With a multiple of 2.9 on current EBITDA and a 10.2% dividend yield, the cushion looks sufficient to outweigh the risk of a rate decline.
Valuation on the latest reported figures
| Metric | Value |
|---|---|
| Market cap | 3.58 bn USD |
| P/E (LTM) | 5.1 |
| EV/EBITDA (LTM) | 5.4 |
| P/B | 3.16 |
| Net debt / EBITDA (LTM) | 0.48 |
| Operating cash flow (LTM) | 0.56 bn |
| ROE | 26.4% |
| Dividend yield (12m) | 10.2% |
| EV/EBITDA, 3-year average | 6.2 |
Net profit by quarter
| Period | Measure | bn USD |
|---|---|---|
| Q4 2024 | Net profit | 0.054700000000000006 |
| Q1 2025 | Net profit | 0.0441 |
| Q2 2025 | Net profit | 0.056 |
| Q3 2025 | Net profit | 0.0448 |
| Q4 2025 | Net profit | 0.06609999999999999 |
| Q1 2026 | Net profit | 0.1645 |
| Q2 2026 | Net profit | 0.1983 |
| Q3 2026 | Net profit | 0.270866 |
Bottom line
The quarter is strong in absolute terms: revenue of 332.4 million dollars, EBITDA of 306.5 million, net profit of 270.9 million, all with low leverage of 0.48 LTM EBITDA. But relative to the rate the company earned 435.1 million less EBITDA than the price allowed, and that gap is the main question for the report. Negative capex of 95.7 million is one-off and supports the dividend but will not repeat. The share trades at EV/EBITDA of 5.4 against its own average of 6.2, and at 2.9 on today's rate, while the 10.2% dividend yield remains the main argument. Our conclusion: rather attractive – the portal model puts the upside at +26%. Our view: the share is rather attractive at the current price; upside on the portal model +26%.