Okeanis Eco Tankers: tanker rates rose 13-fold, yet the company earned half of what the price allowed
Contents
On 13 November Okeanis Eco Tankers released results for the third quarter of 2026. The average VLCC TD3C (AG–China) rate in the period was $641,110/day against $48,492/day a year earlier, and Suezmax TD20 (WAF–UKC) $140,436/day against $40,542. Revenue rose 453.5% to $501.5m, EBITDA 618.6% to $324.6m and net profit 1,145.6% to $299.6m. On our calculation, at year-ago volumes and costs and current prices, revenue should have been $933m and EBITDA $887.5m; the company delivered $431.5m and $563.0m less. Our conclusion: rather attractive – the portal model puts the upside to fair value at +108%, though part of that cushion rests on spot rates above the reported average. Our view: the share is rather attractive at the current price; upside on the portal model +108%.
Our view: is there upside
Our view in numbers
| Metric | Our read |
|---|---|
| Verdict | Rather attractive |
| Upside on the portal model | +108% |
| How the model works | spot model: EBITDA re-priced to current commodity prices at the target EV/EBITDA, against market cap |
| EV/EBITDA now and 3-year average | 5.7 vs 6.6 – a 14% discount to its history |
| Dividend yield, 12m | 10.0% |
| Net debt / EBITDA | 0.98 – low leverage |
| Strongest case for | On the portal spot model at today's rates annual EBITDA is $1,881.3m against $765.4m LTM, and the upside to fair value is +108%. |
| Strongest case against | Third-quarter revenue lagged the price-implied benchmark by $431.5m and EBITDA by $563.0m, and without an explanation for that gap profit may come in below what rates promise. |
| What would change the view | If the VLCC spot rate holds above $1,000,000/day in the next quarter the verdict moves one step up; a return to the reported-period average of $641,110/day moves it one step down. |
Key takeaways
— VLCC rates rose 13-fold, and that is the main source of the quarter's profit
— On our calculation the company earned half of what the freight price allowed
— The EBITDA margin rose to 64.7% – almost all of the revenue increase reached EBITDA
— Leverage of 0.98x LTM EBITDA is a level, not a trend
— A 10.0% dividend yield on a payout that depends on spot rates
— The 5.7x EV/EBITDA LTM multiple is a 14% discount to its own three-year average
— At today's rates the portal spot model's EBITDA is 2.5 times the LTM figure
Key figures, USD bn
| Metric | Q3 2025 | Q3 2026 | Change |
|---|---|---|---|
| Revenue | 0.09 | 0.50 | +453.5% |
| EBITDA | 0.05 | 0.32 | +618.6% |
| Operating profit | 0.03 | 0.31 | +781.5% |
| Net profit | 0.02 | 0.30 | +1145.6% |
| Operating cash flow | 0.03 | 0.24 | +712.3% |
| Capex | — | 0.08 | — |
| EBITDA margin | 49.9% | 64.7% | +14.8 pp |
| Net margin | 26.5% | 59.7% | +33.2 pp |
VLCC rates rose 13-fold, and that is the main source of the quarter's profit
The average VLCC TD3C (AG–China) rate in the third quarter of 2026 was $641,110/day against $48,492/day a year earlier, a rise of 1,222.1%. Against the previous quarter the rate added 46.1%, from $438,830/day. Suezmax TD20 (WAF–UKC) rose to $140,436/day from $40,542 a year earlier (+246.4%) and from $103,811 a quarter earlier (+35.3%).
As of 13 November the VLCC spot rate is $1,366,000/day, 113.1% above the reported-period average, and Suezmax $238,750/day, 70.0% above. The freight market has not merely grown year on year; it has kept rising since the quarter closed.
In the portal model VLCC accounts for 71% of revenue and Suezmax for 24%. It is this rise in rates, not cargo volumes, that set the scale of the quarterly results.
Commodity prices: period average and now
| Benchmark | Year ago | Q3 2026 | YoY | Spot 2026-11-13 |
|---|---|---|---|---|
| VLCC TD3C AG-China TCE, USD/day, USD | 48 492 | 641 110 | +1222,1% | 1 366 000 |
| Suezmax TD20 WAF-UKC TCE, USD/day, USD | 40 542 | 140 436 | +246,4% | 238 750 |
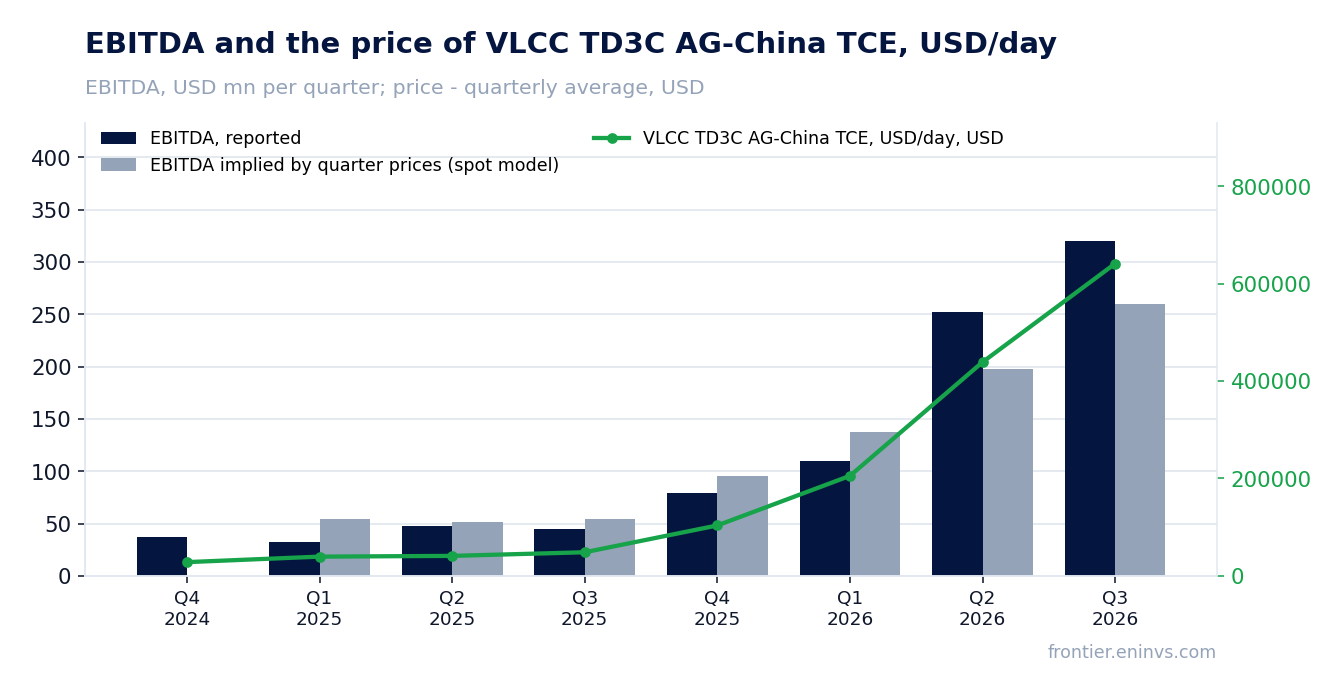
On our calculation the company earned half of what the freight price allowed
On our calculation, at the volumes and non-commodity costs of the third quarter of 2025 and current rates, revenue would have been $933m and EBITDA $887.5m. The company reported $501.5m of revenue and $324.6m of EBITDA: $431.5m (-46.2%) and $563.0m (-63.4%) less.
Against the previous quarter the gap is smaller and changes sign: at the volumes and costs of the second quarter of 2026 revenue would have been $450.3m, and the reported figure is $51.2m (+11.4%) higher; EBITDA would have been $383.2m, and the reported figure is $58.7m (-15.3%) lower. Revenue beat the price-implied benchmark, EBITDA did not.
The gap arises because the model maps rates onto revenue linearly, while actual revenue depends on volumes and on the rate at which voyages were fixed relative to the benchmark average. The facts and the source give no volume or realised-rate breakdown, so the exact cause cannot be named; what is visible is that revenue lagged the price by more than EBITDA did.
The portal's spot model, re-priced from the average of the previous four quarters, expected EBITDA of $259.4m and revenue of $315.9m; the reported $324.6m and $501.5m are 25.1% and 58.8% above. That estimate runs against the year-ago calculation, and for the conclusion we rely on the latter: it holds volumes and costs fixed and moves only the price.
What the prices implied and what the company earned
| Base (Q3 2025) | Implied at period prices | Reported | Reported vs implied | |
|---|---|---|---|---|
| Revenue, USD mn | 90,6 | 933,0 | 501,5 | -46,2% |
| EBITDA, USD mn | 45,2 | 887,5 | 324,6 | -63,4% |
| EBITDA, portal spot model, USD mn | — | 259,4 | 324,6 | +25,1% |
Revenue and EBITDA by quarter
| Period | Measure | bn USD |
|---|---|---|
| Q4 2024 | Revenue | 0.08518952 |
| Q1 2025 | Revenue | 0.080147652 |
| Q2 2025 | Revenue | 0.093947134 |
| Q3 2025 | Revenue | 0.090602272 |
| Q4 2025 | Revenue | 0.126851761 |
| Q1 2026 | Revenue | 0.170165016 |
| Q2 2026 | Revenue | 0.31885257699999997 |
| Q3 2026 | Revenue | 0.5015040000000001 |
| Q4 2024 | EBITDA | 0.037103000000000004 |
| Q1 2025 | EBITDA | 0.032502 |
| Q2 2025 | EBITDA | 0.047277151 |
| Q3 2025 | EBITDA | 0.045166087 |
| Q4 2025 | EBITDA | 0.07902500000000001 |
| Q1 2026 | EBITDA | 0.11007 |
| Q2 2026 | EBITDA | 0.251788925 |
| Q3 2026 | EBITDA | 0.320437 |
EBITDA margin
| Period | Measure | % |
|---|---|---|
| Q4 2024 | EBITDA margin | 43.6 |
| Q1 2025 | EBITDA margin | 40.6 |
| Q2 2025 | EBITDA margin | 50.3 |
| Q3 2025 | EBITDA margin | 49.9 |
| Q4 2025 | EBITDA margin | 62.3 |
| Q1 2026 | EBITDA margin | 64.7 |
| Q2 2026 | EBITDA margin | 79.0 |
| Q3 2026 | EBITDA margin | 63.9 |
The EBITDA margin rose to 64.7% – almost all of the revenue increase reached EBITDA
The EBITDA margin in the reported period was 64.7% against 49.9% a year earlier. The net margin was 59.7% against 26.5%. With revenue of $501.5m and EBITDA of $324.6m, operating costs and other items took about $177m, against about $45m a year earlier on revenue of $90.6m and EBITDA of $45.2m.
The margin expansion follows from a carrier's cost structure: fuel and port dues rise with voyages, not with the freight rate, so at a rate 13 times higher almost all of the revenue increase falls through to EBITDA. Operating profit of $306.1m against EBITDA of $324.6m means depreciation absorbed about $18.5m.
Net profit of $299.6m is almost equal to operating profit: interest and taxes were small relative to the result in the quarter. The facts name no one-off items, so the quarter's profit is first of all freight revenue less voyage costs.
Leverage of 0.98x LTM EBITDA is a level, not a trend
Net debt at 30 September 2026 was $596.1m, which against LTM EBITDA of $608.7m gives 0.98x. That is low leverage for a capital-intensive carrier: debt is below annual EBITDA.
Operating cash flow in the quarter was $240.0m and capital expenditure $82.2m, so free cash flow before dividends and debt service was about $158m. Over the last twelve months operating cash flow was $462.9m.
The facts give no earlier leverage level, so we do not state a direction: 0.98x is the position at the reporting date. At today's rates the portal spot model puts net debt at 0.32x EBITDA, but that is an estimate at current prices, not a reported figure.
A 10.0% dividend yield on a payout that depends on spot rates
The trailing twelve-month dividend yield is 10.0% on a market capitalisation of $3,106.5m. Payouts of that size became possible precisely because of quarterly profit of $299.6m: on LTM net profit of $589.4m and a market capitalisation of $3,106.5m the price-to-earnings ratio is 5.3.
Our estimate for the current year's dividend is about 10% on the price, and it rests on two things: the payout ratio and the profit, which in turn depends on freight rates. If rates stay at the spot level of $1,366,000/day for VLCC, profit and the payout will be higher than the quarterly figure; if they return to the reported-period average, the dividend contracts with profit.
The payout can also be reduced by capital expenditure: in the first quarter of 2026 it was $196.1m, in the second $79.7m and in the third $82.2m. With a fleet-renewal programme of that size, part of cash flow goes into vessels rather than into the dividend.
A 10.0% yield is well above the risk-free rate, but that is the price of freight volatility: the dividend here is not fixed, it follows quarterly profit.
Valuation vs its own history
now vs the 3-year average
| Period | Measure | × |
|---|---|---|
| EV/EBITDA | Now | 5.685266093833187 |
| EV/EBITDA | 3-year average | 6.6424471229698705 |
The 5.7x EV/EBITDA LTM multiple is a 14% discount to its own three-year average
EV/EBITDA over the last twelve months is 5.7x against its own three-year average of 6.6x, a 14% discount. On this multiple the share is cheaper than it has been on average over three years. P/E LTM is 5.3x and return on equity 43.2%.
The caveat is that LTM earnings were made at the rates of past quarters, which were several times lower than today's. On the portal spot model at current prices annual EBITDA is $1,881.3m against model LTM EBITDA of $765.4m (+145.8%), and EV/EBITDA on that base is 2.0x. That base, not LTM, should be the starting point for valuing a carrier.
Re-pricing EBITDA to current prices at the target multiple, the portal model puts the upside to fair value at +108%. That is our own estimate, not a market consensus and not a target price.
Share price, three years
close, last point 2026-11-12
| Period | Measure | USD per share |
|---|---|---|
| 2025-11-13 | Closing price | 39.0 |
| 2025-11-14 | Closing price | 38.43000030517578 |
| 2025-11-17 | Closing price | 38.939998626708984 |
| 2025-11-18 | Closing price | 39.619998931884766 |
| 2025-11-19 | Closing price | 37.0099983215332 |
| 2025-11-20 | Closing price | 36.779998779296875 |
| 2025-11-21 | Closing price | 37.52000045776367 |
| 2025-11-24 | Closing price | 36.970001220703125 |
| 2025-11-25 | Closing price | 36.86000061035156 |
| 2025-11-26 | Closing price | 37.04999923706055 |
| 2025-11-28 | Closing price | 36.84000015258789 |
| 2025-12-01 | Closing price | 36.529998779296875 |
| 2025-12-02 | Closing price | 36.16999816894531 |
| 2025-12-03 | Closing price | 36.2599983215332 |
| 2025-12-04 | Closing price | 36.18000030517578 |
| 2025-12-05 | Closing price | 37.06999969482422 |
| 2025-12-08 | Closing price | 36.75 |
| 2025-12-09 | Closing price | 36.13999938964844 |
| 2025-12-10 | Closing price | 35.77000045776367 |
| 2025-12-11 | Closing price | 36.25 |
| 2025-12-12 | Closing price | 35.77000045776367 |
| 2025-12-15 | Closing price | 35.689998626708984 |
| 2025-12-16 | Closing price | 35.16999816894531 |
| 2025-12-17 | Closing price | 35.56999969482422 |
| 2025-12-18 | Closing price | 34.150001525878906 |
| 2025-12-19 | Closing price | 33.91999816894531 |
| 2025-12-22 | Closing price | 33.65999984741211 |
| 2025-12-23 | Closing price | 32.599998474121094 |
| 2025-12-24 | Closing price | 32.68000030517578 |
| 2025-12-26 | Closing price | 33.47999954223633 |
| 2025-12-29 | Closing price | 33.58000183105469 |
| 2025-12-30 | Closing price | 33.36000061035156 |
| 2025-12-31 | Closing price | 33.84000015258789 |
| 2026-01-02 | Closing price | 31.959999084472656 |
| 2026-01-05 | Closing price | 32.97999954223633 |
| 2026-01-06 | Closing price | 33.5 |
| 2026-01-07 | Closing price | 36.400001525878906 |
| 2026-01-08 | Closing price | 38.31999969482422 |
| 2026-01-09 | Closing price | 38.04999923706055 |
| 2026-01-12 | Closing price | 38.79999923706055 |
| 2026-01-13 | Closing price | 40.5 |
| 2026-01-14 | Closing price | 40.36000061035156 |
| 2026-01-15 | Closing price | 39.25 |
| 2026-01-16 | Closing price | 39.560001373291016 |
| 2026-01-20 | Closing price | 38.900001525878906 |
| 2026-01-21 | Closing price | 38.380001068115234 |
| 2026-01-22 | Closing price | 37.290000915527344 |
| 2026-01-23 | Closing price | 37.9900016784668 |
| 2026-01-26 | Closing price | 38.689998626708984 |
| 2026-01-27 | Closing price | 39.45000076293945 |
| 2026-01-28 | Closing price | 40.31999969482422 |
| 2026-01-29 | Closing price | 40.209999084472656 |
| 2026-01-30 | Closing price | 40.4900016784668 |
| 2026-02-02 | Closing price | 40.560001373291016 |
| 2026-02-03 | Closing price | 40.91999816894531 |
| 2026-02-04 | Closing price | 39.13999938964844 |
| 2026-02-05 | Closing price | 38.93000030517578 |
| 2026-02-06 | Closing price | 40.31999969482422 |
| 2026-02-09 | Closing price | 40.380001068115234 |
| 2026-02-10 | Closing price | 41.040000915527344 |
| 2026-02-11 | Closing price | 42.689998626708984 |
| 2026-02-12 | Closing price | 41.66999816894531 |
| 2026-02-13 | Closing price | 42.97999954223633 |
| 2026-02-17 | Closing price | 42.709999084472656 |
| 2026-02-18 | Closing price | 44.310001373291016 |
| 2026-02-19 | Closing price | 46.779998779296875 |
| 2026-02-20 | Closing price | 49.20000076293945 |
| 2026-02-23 | Closing price | 49.9900016784668 |
| 2026-02-24 | Closing price | 52.81999969482422 |
| 2026-02-25 | Closing price | 52.630001068115234 |
| 2026-02-26 | Closing price | 53.20000076293945 |
| 2026-02-27 | Closing price | 54.04999923706055 |
| 2026-03-02 | Closing price | 54.81999969482422 |
| 2026-03-03 | Closing price | 51.279998779296875 |
| 2026-03-04 | Closing price | 50.81999969482422 |
| 2026-03-05 | Closing price | 48.810001373291016 |
| 2026-03-06 | Closing price | 47.689998626708984 |
| 2026-03-09 | Closing price | 48.56999969482422 |
| 2026-03-10 | Closing price | 49.22999954223633 |
| 2026-03-11 | Closing price | 47.45000076293945 |
| 2026-03-12 | Closing price | 44.68000030517578 |
| 2026-03-13 | Closing price | 43.86000061035156 |
| 2026-03-16 | Closing price | 45.720001220703125 |
| 2026-03-17 | Closing price | 46.70000076293945 |
| 2026-03-18 | Closing price | 47.470001220703125 |
| 2026-03-19 | Closing price | 47.150001525878906 |
| 2026-03-20 | Closing price | 46.119998931884766 |
| 2026-03-23 | Closing price | 48.040000915527344 |
| 2026-03-24 | Closing price | 50.619998931884766 |
| 2026-03-25 | Closing price | 48.439998626708984 |
| 2026-03-26 | Closing price | 49.0099983215332 |
| 2026-03-27 | Closing price | 49.900001525878906 |
| 2026-03-30 | Closing price | 49.650001525878906 |
| 2026-03-31 | Closing price | 50.59000015258789 |
| 2026-04-01 | Closing price | 50.38999938964844 |
| 2026-04-02 | Closing price | 51.75 |
| 2026-04-06 | Closing price | 51.36000061035156 |
| 2026-04-07 | Closing price | 50.029998779296875 |
| 2026-04-08 | Closing price | 50.95000076293945 |
| 2026-04-09 | Closing price | 50.279998779296875 |
| 2026-04-10 | Closing price | 49.02000045776367 |
| 2026-04-13 | Closing price | 49.70000076293945 |
| 2026-04-14 | Closing price | 48.5 |
| 2026-04-15 | Closing price | 50.869998931884766 |
| 2026-04-16 | Closing price | 49.650001525878906 |
| 2026-04-17 | Closing price | 51.599998474121094 |
| 2026-04-20 | Closing price | 52.7400016784668 |
| 2026-04-21 | Closing price | 51.08000183105469 |
| 2026-04-22 | Closing price | 50.560001373291016 |
| 2026-04-23 | Closing price | 50.56999969482422 |
| 2026-04-24 | Closing price | 53.11000061035156 |
| 2026-04-27 | Closing price | 54.2400016784668 |
| 2026-04-28 | Closing price | 54.66999816894531 |
| 2026-04-29 | Closing price | 54.2599983215332 |
| 2026-04-30 | Closing price | 55.2400016784668 |
| 2026-05-01 | Closing price | 55.11000061035156 |
| 2026-05-04 | Closing price | 55.38999938964844 |
| 2026-05-05 | Closing price | 56.93000030517578 |
| 2026-05-06 | Closing price | 54.79999923706055 |
| 2026-05-07 | Closing price | 56.7400016784668 |
| 2026-05-08 | Closing price | 56.20000076293945 |
| 2026-05-11 | Closing price | 55.93000030517578 |
| 2026-05-12 | Closing price | 56.650001525878906 |
| 2026-05-13 | Closing price | 54.439998626708984 |
| 2026-05-14 | Closing price | 54.59000015258789 |
| 2026-05-15 | Closing price | 55.119998931884766 |
| 2026-05-18 | Closing price | 55.810001373291016 |
| 2026-05-19 | Closing price | 54.369998931884766 |
| 2026-05-20 | Closing price | 56.77000045776367 |
| 2026-05-21 | Closing price | 55.97999954223633 |
| 2026-05-22 | Closing price | 54.06999969482422 |
| 2026-05-26 | Closing price | 53.54999923706055 |
| 2026-05-27 | Closing price | 51.189998626708984 |
| 2026-05-28 | Closing price | 48.119998931884766 |
| 2026-05-29 | Closing price | 47.209999084472656 |
| 2026-06-01 | Closing price | 48.599998474121094 |
| 2026-06-02 | Closing price | 48.18000030517578 |
| 2026-06-03 | Closing price | 47.650001525878906 |
| 2026-06-04 | Closing price | 47.5 |
| 2026-06-05 | Closing price | 47.7400016784668 |
| 2026-06-08 | Closing price | 47.849998474121094 |
| 2026-06-09 | Closing price | 49.040000915527344 |
| 2026-06-10 | Closing price | 49.20000076293945 |
| 2026-06-11 | Closing price | 49.7599983215332 |
| 2026-06-12 | Closing price | 52.7400016784668 |
| 2026-06-15 | Closing price | 53.189998626708984 |
| 2026-06-16 | Closing price | 52.0 |
| 2026-06-17 | Closing price | 51.029998779296875 |
| 2026-06-18 | Closing price | 52.47999954223633 |
| 2026-06-22 | Closing price | 54.9900016784668 |
| 2026-06-23 | Closing price | 56.63999938964844 |
| 2026-06-24 | Closing price | 54.439998626708984 |
| 2026-06-25 | Closing price | 51.880001068115234 |
| 2026-06-26 | Closing price | 49.880001068115234 |
| 2026-06-29 | Closing price | 49.599998474121094 |
| 2026-06-30 | Closing price | 50.119998931884766 |
| 2026-07-01 | Closing price | 49.939998626708984 |
| 2026-07-02 | Closing price | 53.11000061035156 |
| 2026-07-06 | Closing price | 53.349998474121094 |
| 2026-07-07 | Closing price | 53.720001220703125 |
| 2026-07-08 | Closing price | 55.040000915527344 |
| 2026-07-09 | Closing price | 52.22999954223633 |
| 2026-07-10 | Closing price | 54.939998626708984 |
| 2026-07-13 | Closing price | 54.20000076293945 |
| 2026-07-14 | Closing price | 56.72999954223633 |
| 2026-07-15 | Closing price | 56.650001525878906 |
| 2026-07-16 | Closing price | 56.77000045776367 |
| 2026-07-17 | Closing price | 53.880001068115234 |
| 2026-07-20 | Closing price | 54.2400016784668 |
| 2026-07-21 | Closing price | 57.11000061035156 |
| 2026-07-22 | Closing price | 56.470001220703125 |
| 2026-07-23 | Closing price | 57.459999084472656 |
| 2026-07-24 | Closing price | 57.880001068115234 |
| 2026-07-27 | Closing price | 57.560001373291016 |
| 2026-07-28 | Closing price | 58.349998474121094 |
| 2026-07-29 | Closing price | 58.31999969482422 |
| 2026-07-30 | Closing price | 59.86000061035156 |
| 2026-07-31 | Closing price | 60.33000183105469 |
| 2026-08-03 | Closing price | 61.380001068115234 |
| 2026-08-04 | Closing price | 59.22999954223633 |
| 2026-08-05 | Closing price | 60.619998931884766 |
| 2026-08-06 | Closing price | 63.779998779296875 |
| 2026-08-07 | Closing price | 61.86000061035156 |
| 2026-08-10 | Closing price | 60.5099983215332 |
| 2026-08-11 | Closing price | 60.7400016784668 |
| 2026-08-12 | Closing price | 62.880001068115234 |
| 2026-08-13 | Closing price | 63.91999816894531 |
| 2026-08-14 | Closing price | 60.290000915527344 |
| 2026-08-17 | Closing price | 62.70000076293945 |
| 2026-08-18 | Closing price | 62.029998779296875 |
| 2026-08-19 | Closing price | 64.23999786376953 |
| 2026-08-20 | Closing price | 64.0999984741211 |
| 2026-08-21 | Closing price | 64.70999908447266 |
| 2026-08-24 | Closing price | 65.13999938964844 |
| 2026-08-25 | Closing price | 65.04000091552734 |
| 2026-08-26 | Closing price | 62.279998779296875 |
| 2026-08-27 | Closing price | 66.33999633789062 |
| 2026-08-28 | Closing price | 66.86000061035156 |
| 2026-08-31 | Closing price | 66.73999786376953 |
| 2026-09-01 | Closing price | 67.95999908447266 |
| 2026-09-02 | Closing price | 69.0199966430664 |
| 2026-09-03 | Closing price | 69.55999755859375 |
| 2026-09-04 | Closing price | 71.43000030517578 |
| 2026-09-08 | Closing price | 69.94999694824219 |
| 2026-09-09 | Closing price | 71.66999816894531 |
| 2026-09-10 | Closing price | 72.91999816894531 |
| 2026-09-11 | Closing price | 76.1500015258789 |
| 2026-09-14 | Closing price | 79.72000122070312 |
| 2026-09-15 | Closing price | 82.7300033569336 |
| 2026-09-16 | Closing price | 84.73999786376953 |
| 2026-09-17 | Closing price | 86.30000305175781 |
| 2026-09-18 | Closing price | 84.94999694824219 |
| 2026-09-21 | Closing price | 82.62999725341797 |
| 2026-09-22 | Closing price | 77.54000091552734 |
| 2026-09-23 | Closing price | 78.02999877929688 |
| 2026-09-24 | Closing price | 78.22000122070312 |
| 2026-09-25 | Closing price | 77.9000015258789 |
| 2026-09-28 | Closing price | 79.16999816894531 |
| 2026-09-29 | Closing price | 80.25 |
| 2026-09-30 | Closing price | 80.87999725341797 |
| 2026-10-01 | Closing price | 85.73999786376953 |
| 2026-10-02 | Closing price | 87.27999877929688 |
| 2026-10-05 | Closing price | 88.5999984741211 |
| 2026-10-06 | Closing price | 86.8499984741211 |
| 2026-10-07 | Closing price | 88.04000091552734 |
| 2026-10-08 | Closing price | 94.44000244140625 |
| 2026-10-09 | Closing price | 93.11000061035156 |
| 2026-10-12 | Closing price | 98.62999725341797 |
| 2026-10-13 | Closing price | 99.26000213623047 |
| 2026-10-14 | Closing price | 95.66000366210938 |
| 2026-10-15 | Closing price | 89.18000030517578 |
| 2026-10-16 | Closing price | 89.69999694824219 |
| 2026-10-19 | Closing price | 88.9800033569336 |
| 2026-10-20 | Closing price | 88.19000244140625 |
| 2026-10-21 | Closing price | 91.2300033569336 |
| 2026-10-22 | Closing price | 90.05000305175781 |
| 2026-10-23 | Closing price | 94.7300033569336 |
| 2026-10-26 | Closing price | 96.8499984741211 |
| 2026-10-27 | Closing price | 92.91000366210938 |
| 2026-10-28 | Closing price | 99.04000091552734 |
| 2026-10-29 | Closing price | 101.62999725341797 |
| 2026-10-30 | Closing price | 101.33000183105469 |
| 2026-11-02 | Closing price | 91.25 |
| 2026-11-03 | Closing price | 93.26000213623047 |
| 2026-11-04 | Closing price | 84.9000015258789 |
| 2026-11-05 | Closing price | 81.18000030517578 |
| 2026-11-06 | Closing price | 83.26000213623047 |
| 2026-11-09 | Closing price | 82.20999908447266 |
| 2026-11-10 | Closing price | 81.66999816894531 |
| 2026-11-11 | Closing price | 85.75 |
| 2026-11-12 | Closing price | 87.66999816894531 |
At today's rates the portal spot model's EBITDA is 2.5 times the LTM figure
The VLCC spot rate on 13 November is $1,366,000/day, 113.1% above the reported-period average, and Suezmax $238,750/day, 70.0% above. If those levels hold, the next quarter will show EBITDA above the third quarter, not below it.
On the portal spot model at current prices annual EBITDA is $1,881.3m, net debt to EBITDA 0.32x and EV/EBITDA 2.0x. That is 2.5 times the LTM figure of $765.4m, and the gap is explained solely by rates: the model holds volumes and costs at the LTM level.
Two things are worth watching in the next report: whether rates hold at the spot level, and how actual revenue compares with the price-implied benchmark. In the third quarter it lagged by 46.2%, and if the gap repeats, profit will be below what spot promises.
Valuation on the latest reported figures
| Metric | Value |
|---|---|
| Market cap | 3.11 bn USD |
| P/E (LTM) | 5.3 |
| EV/EBITDA (LTM) | 5.7 |
| P/B | 5.42 |
| Net debt / EBITDA (LTM) | 0.98 |
| Operating cash flow (LTM) | 0.46 bn |
| ROE | 43.2% |
| Dividend yield (12m) | 10.0% |
| EV/EBITDA, 3-year average | 6.6 |
Net profit by quarter
| Period | Measure | bn USD |
|---|---|---|
| Q4 2024 | Net profit | 0.013194595 |
| Q1 2025 | Net profit | 0.012555933 |
| Q2 2025 | Net profit | 0.026887 |
| Q3 2025 | Net profit | 0.024051 |
| Q4 2025 | Net profit | 0.059458128 |
| Q1 2026 | Net profit | 0.088317703 |
| Q2 2026 | Net profit | 0.23031100000000002 |
| Q3 2026 | Net profit | 0.299584 |
Bottom line
What was genuinely strong in the quarter was everything tied to rates: VLCC 13 times the year-ago level, a 64.7% EBITDA margin, net profit of $299.6m and leverage of 0.98x LTM EBITDA. What was weak was that actual revenue lagged the price-implied benchmark by $431.5m and EBITDA by $563.0m, with no explanation for the gap in the facts. The question for a holder now is whether the spot rate of $1,366,000/day holds: the 10.0% dividend and the spot model's $1,881.3m EBITDA both rest on it. The 5.7x EV/EBITDA LTM multiple is a 14% discount to its own three-year average, and the portal model's +108% upside outweighs the gap. Our conclusion: rather attractive, with +108% upside on the portal model. Our view: the share is rather attractive at the current price; upside on the portal model +108%.