Equinox Gold: gold up 23% but profit down 27% – diesel and power ate the margin
Contents
On 11 November Equinox Gold released third-quarter 2026 results. Gold averaged 4268 USD/oz in the period versus 3459 USD a year earlier (+23.4%); revenue rose 27.8% to 1047.0 million USD, EBITDA grew 15.0% to 389.3 million USD, while net profit fell 27.0% to 62.5 million USD. At year-ago volumes and costs and current commodity prices, our calculation implies revenue of 1010.6 million USD and EBITDA of 466.9 million USD; the company earned 77.7 million USD less on EBITDA, a gap explained by diesel (+45.3%) and electricity (+63.3%). Our conclusion: rather attractive – the portal model puts the upside to fair value at +21%. Our view: the share is rather attractive at the current price; upside on the portal model +21%.
Our view: is there upside
Our view in numbers
| Metric | Our read |
|---|---|
| Verdict | Rather attractive |
| Upside on the portal model | +21% |
| How the model works | spot model: EBITDA re-priced to current commodity prices at the target EV/EBITDA, against market cap |
| EV/EBITDA now and 3-year average | 9.1 vs 14.5 – a 37% discount to its history |
| Dividend yield, 12m | 0.5% |
| Net debt / EBITDA | -0.02 – net cash |
| Strongest case for | EV/EBITDA of 9.1 against its own three-year average of 14.5 – a 37% discount, with the portal model showing +21% upside. |
| Strongest case against | Net profit fell 27.0% year on year and the EBITDA margin compressed from 41.3% to 37.2% as diesel rose 45.3% and electricity 63.3%. |
| What would change the view | A return of gold to 4268 USD/oz or a fall in diesel and power costs would lift the verdict one step; gold settling below 4000 USD would lower it one step. |
Key takeaways
— Gold averaged 4268 USD/oz in the reported quarter – 23.4% above a year earlier but already 5.5% below the previous quarter
— At year-ago volumes and costs, our calculation implies EBITDA of 466.9 million USD – the company fell 77.7 million short because of diesel and electricity
— Revenue grew 27.8% year on year, but the pace decelerated from 169.3% a quarter earlier – growth now rests on price, not on a low base
— The EBITDA margin compressed from 41.3% to 37.2% and the net margin from 10.4% to 6.0%: diesel and power costs rose faster than the metal price
— Net cash of 15.9 million USD with net debt/EBITDA at minus 0.02 – there is effectively no leverage
— EV/EBITDA for the last twelve months is 9.1 against its own three-year average of 14.5 – a 37% discount, the share is cheaper than its history
— Trailing twelve-month dividend yield is 0.47%, and the payout can grow only if the margin recovers
Key figures, USD bn
| Metric | Q3 2025 | Q3 2026 | Change |
|---|---|---|---|
| Revenue | 0.82 | 1.05 | +27.8% |
| EBITDA | 0.34 | 0.39 | +15.0% |
| Operating profit | 0.21 | 0.28 | +38.7% |
| Net profit | 0.09 | 0.06 | -27.0% |
| Operating cash flow | 0.24 | 0.28 | +15.6% |
| Capex | 0.24 | — | — |
| EBITDA margin | 41.3% | 37.2% | -4.1 pp |
| Net margin | 10.4% | 6.0% | -4.4 pp |
Gold averaged 4268 USD/oz in the reported quarter – 23.4% above a year earlier but already 5.5% below the previous quarter
Gold averaged 4268 USD/oz in the third quarter of 2026 versus 3459 USD a year earlier, up 23.4%. This is the main external driver of revenue: gold accounts for 100% of revenue in the portal model.
Against the previous quarter the metal fell 5.5%, from 4514 USD to 4268 USD. Spot gold stood at 4055 USD on 11 November, another 5.0% below the reported-period average. The price tailwind that carried the third quarter has already faded.
Commodity prices: period average and now
| Benchmark | Year ago | Q3 2026 | YoY | Spot 2026-11-11 |
|---|---|---|---|---|
| Gold, USD | 3 459 | 4 268 | +23,4% | 4 055 |
| US Diesel Index (EIA) (input cost), USD | 3,75 | 5,45 | +45,3% | 6,13 |
| Electricity Spot (input cost), USD | 62,9 | 102,8 | +63,3% | 63,9 |
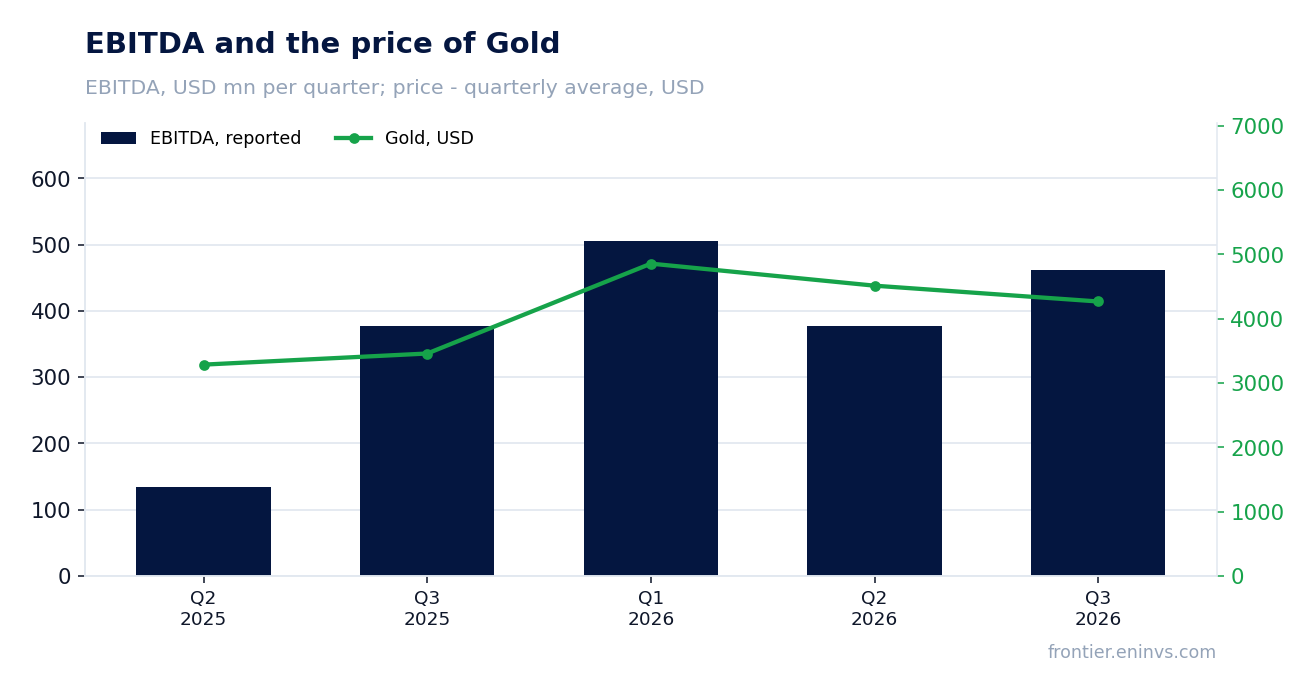
At year-ago volumes and costs, our calculation implies EBITDA of 466.9 million USD – the company fell 77.7 million short because of diesel and electricity
At the year-ago volumes and current gold and input prices, our calculation implies revenue of 1010.6 million USD and EBITDA of 466.9 million USD. Actual revenue came in 36.4 million USD higher (1047.0 million), while EBITDA was 77.7 million USD lower (389.3 million).
The EBITDA gap is explained by input costs: diesel rose 45.3% year on year to 5.454 USD, and electricity rose 63.3% to 102.8 USD. In the portal model diesel accounts for 10% of revenue and electricity for 5%, and their rise directly erodes the margin.
Revenue above the implied level suggests sales volumes or realised prices were higher than a year earlier. EBITDA below the implied level means the cost increase outweighed both the price gain and any volume growth.
What the prices implied and what the company earned
| Base (Q3 2025) | Implied at period prices | Reported | Reported vs implied | |
|---|---|---|---|---|
| Revenue, USD mn | 819,0 | 1 011 | 1 047 | +3,6% |
| EBITDA, USD mn | 338,4 | 466,9 | 389,3 | -16,6% |
Revenue and EBITDA by quarter
| Period | Measure | bn USD |
|---|---|---|
| Q2 2025 | Revenue | 0.285815 |
| Q3 2025 | Revenue | 0.81901 |
| Q1 2026 | Revenue | 0.8615929999999999 |
| Q2 2026 | Revenue | 0.769796 |
| Q3 2026 | Revenue | 1.047007 |
| Q2 2025 | EBITDA | 0.133989 |
| Q3 2025 | EBITDA | 0.37764700000000007 |
| Q1 2026 | EBITDA | 0.506332 |
| Q2 2026 | EBITDA | 0.37765899999999997 |
| Q3 2026 | EBITDA | 0.46203700000000003 |
EBITDA margin
| Period | Measure | % |
|---|---|---|
| Q2 2025 | EBITDA margin | 46.9 |
| Q3 2025 | EBITDA margin | 46.1 |
| Q1 2026 | EBITDA margin | 58.8 |
| Q2 2026 | EBITDA margin | 49.1 |
| Q3 2026 | EBITDA margin | 44.1 |
Revenue grew 27.8% year on year, but the pace decelerated from 169.3% a quarter earlier – growth now rests on price, not on a low base
Third-quarter 2026 revenue was 1047.0 million USD, 27.8% above a year earlier. In the second quarter growth was 169.3% – this is a deceleration, and an expected one: the year-ago base was low, while now the comparison is against an already strong quarter.
Against the previous quarter, revenue was 43.9% above the implied 727.8 million USD at unchanged volumes and costs. That means the company sold more metal or realised a higher price than the implied level, and the gain outweighed the rise in input costs.
The EBITDA margin compressed from 41.3% to 37.2% and the net margin from 10.4% to 6.0%: diesel and power costs rose faster than the metal price
The EBITDA margin was 37.2% in the reported quarter versus 41.3% a year earlier. With revenue up 27.8%, EBITDA rose only 15.0% – the difference is the margin compression caused by more expensive diesel and electricity.
Net profit fell 27.0% to 62.5 million USD and the net margin from 10.4% to 6.0%. Beyond the operating pressure, items below EBITDA affect profit, but the facts do not disclose them, so we state only that the profit decline is deeper than the EBITDA decline.
Net cash of 15.9 million USD with net debt/EBITDA at minus 0.02 – there is effectively no leverage
As of 30 September 2026 the company has net cash of 15.9 million USD: cash exceeds debt. Net debt/EBITDA for the last twelve months is minus 0.02 – a level at which debt creates neither interest nor refinancing pressure.
Operating cash flow in the reported quarter was 278.3 million USD with capital expenditure of 230.1 million USD. The 48.2 million USD difference is free cash flow, which after dividends goes to sustaining and growing production.
Over the last twelve months EBITDA was 887.7 million USD. At current gold and input prices that level may come under pressure, but the net cash position provides a cushion: even with a weaker EBITDA, debt will not become a problem.
Valuation vs its own history
now vs the 3-year average
| Period | Measure | × |
|---|---|---|
| EV/EBITDA | Now | 9.147796583008757 |
| EV/EBITDA | 3-year average | 14.461662733105861 |
EV/EBITDA for the last twelve months is 9.1 against its own three-year average of 14.5 – a 37% discount, the share is cheaper than its history
The EV/EBITDA multiple for the last twelve months is 9.1 against its own three-year average of 14.5. The 37% discount means the market values current EBITDA well below its three-year average.
However, last-twelve-month EBITDA was earned at higher gold prices than current spot. On the portal's spot model, which reprices EBITDA at current commodity prices, the upside to fair value is +21%. This is our own estimate, not a market consensus.
Share price, three years
close, last point 2026-11-10
| Period | Measure | USD per share |
|---|---|---|
| 2025-11-11 | Closing price | 12.399999618530273 |
| 2025-11-12 | Closing price | 13.140000343322754 |
| 2025-11-13 | Closing price | 12.979999542236328 |
| 2025-11-14 | Closing price | 12.75 |
| 2025-11-17 | Closing price | 12.449999809265137 |
| 2025-11-18 | Closing price | 12.600000381469727 |
| 2025-11-19 | Closing price | 12.8100004196167 |
| 2025-11-20 | Closing price | 12.119999885559082 |
| 2025-11-21 | Closing price | 11.890000343322754 |
| 2025-11-24 | Closing price | 12.739999771118164 |
| 2025-11-25 | Closing price | 12.779999732971191 |
| 2025-11-26 | Closing price | 13.5 |
| 2025-11-28 | Closing price | 13.880000114440918 |
| 2025-12-01 | Closing price | 14.029999732971191 |
| 2025-12-02 | Closing price | 13.920000076293945 |
| 2025-12-03 | Closing price | 13.779999732971191 |
| 2025-12-04 | Closing price | 13.949999809265137 |
| 2025-12-05 | Closing price | 13.920000076293945 |
| 2025-12-08 | Closing price | 13.40999984741211 |
| 2025-12-09 | Closing price | 14.010000228881836 |
| 2025-12-10 | Closing price | 14.380000114440918 |
| 2025-12-11 | Closing price | 14.680000305175781 |
| 2025-12-12 | Closing price | 14.699999809265137 |
| 2025-12-15 | Closing price | 13.949999809265137 |
| 2025-12-16 | Closing price | 13.90999984741211 |
| 2025-12-17 | Closing price | 13.890000343322754 |
| 2025-12-18 | Closing price | 13.760000228881836 |
| 2025-12-19 | Closing price | 14.100000381469727 |
| 2025-12-22 | Closing price | 14.899999618530273 |
| 2025-12-23 | Closing price | 14.890000343322754 |
| 2025-12-24 | Closing price | 14.600000381469727 |
| 2025-12-26 | Closing price | 14.8100004196167 |
| 2025-12-29 | Closing price | 13.989999771118164 |
| 2025-12-30 | Closing price | 14.199999809265137 |
| 2025-12-31 | Closing price | 14.039999961853027 |
| 2026-01-02 | Closing price | 13.699999809265137 |
| 2026-01-05 | Closing price | 14.289999961853027 |
| 2026-01-06 | Closing price | 14.5 |
| 2026-01-07 | Closing price | 14.4399995803833 |
| 2026-01-08 | Closing price | 14.640000343322754 |
| 2026-01-09 | Closing price | 14.15999984741211 |
| 2026-01-12 | Closing price | 14.4399995803833 |
| 2026-01-13 | Closing price | 14.569999694824219 |
| 2026-01-14 | Closing price | 14.680000305175781 |
| 2026-01-15 | Closing price | 14.5600004196167 |
| 2026-01-16 | Closing price | 14.239999771118164 |
| 2026-01-20 | Closing price | 15.640000343322754 |
| 2026-01-21 | Closing price | 14.829999923706055 |
| 2026-01-22 | Closing price | 15.930000305175781 |
| 2026-01-23 | Closing price | 16.190000534057617 |
| 2026-01-26 | Closing price | 16.329999923706055 |
| 2026-01-27 | Closing price | 16.829999923706055 |
| 2026-01-28 | Closing price | 17.1200008392334 |
| 2026-01-29 | Closing price | 16.010000228881836 |
| 2026-01-30 | Closing price | 14.300000190734863 |
| 2026-02-02 | Closing price | 14.149999618530273 |
| 2026-02-03 | Closing price | 15.109999656677246 |
| 2026-02-04 | Closing price | 15.239999771118164 |
| 2026-02-05 | Closing price | 13.739999771118164 |
| 2026-02-06 | Closing price | 14.5600004196167 |
| 2026-02-09 | Closing price | 15.529999732971191 |
| 2026-02-10 | Closing price | 15.850000381469727 |
| 2026-02-11 | Closing price | 16.34000015258789 |
| 2026-02-12 | Closing price | 15.0600004196167 |
| 2026-02-13 | Closing price | 15.800000190734863 |
| 2026-02-17 | Closing price | 15.0600004196167 |
| 2026-02-18 | Closing price | 15.649999618530273 |
| 2026-02-19 | Closing price | 16.979999542236328 |
| 2026-02-20 | Closing price | 16.809999465942383 |
| 2026-02-23 | Closing price | 17.850000381469727 |
| 2026-02-24 | Closing price | 18.540000915527344 |
| 2026-02-25 | Closing price | 18.110000610351562 |
| 2026-02-26 | Closing price | 18.399999618530273 |
| 2026-02-27 | Closing price | 18.760000228881836 |
| 2026-03-02 | Closing price | 18.75 |
| 2026-03-03 | Closing price | 17.229999542236328 |
| 2026-03-04 | Closing price | 17.149999618530273 |
| 2026-03-05 | Closing price | 16.420000076293945 |
| 2026-03-06 | Closing price | 16.6299991607666 |
| 2026-03-09 | Closing price | 16.510000228881836 |
| 2026-03-10 | Closing price | 16.520000457763672 |
| 2026-03-11 | Closing price | 16.049999237060547 |
| 2026-03-12 | Closing price | 15.920000076293945 |
| 2026-03-13 | Closing price | 14.569999694824219 |
| 2026-03-16 | Closing price | 14.880000114440918 |
| 2026-03-17 | Closing price | 14.449999809265137 |
| 2026-03-18 | Closing price | 13.420000076293945 |
| 2026-03-19 | Closing price | 12.40999984741211 |
| 2026-03-20 | Closing price | 11.989999771118164 |
| 2026-03-23 | Closing price | 12.640000343322754 |
| 2026-03-24 | Closing price | 12.579999923706055 |
| 2026-03-25 | Closing price | 13.0 |
| 2026-03-26 | Closing price | 12.029999732971191 |
| 2026-03-27 | Closing price | 12.579999923706055 |
| 2026-03-30 | Closing price | 12.9399995803833 |
| 2026-03-31 | Closing price | 14.460000038146973 |
| 2026-04-01 | Closing price | 14.9399995803833 |
| 2026-04-02 | Closing price | 14.59000015258789 |
| 2026-04-06 | Closing price | 14.609999656677246 |
| 2026-04-07 | Closing price | 14.779999732971191 |
| 2026-04-08 | Closing price | 15.279999732971191 |
| 2026-04-09 | Closing price | 14.880000114440918 |
| 2026-04-10 | Closing price | 15.079999923706055 |
| 2026-04-13 | Closing price | 15.069999694824219 |
| 2026-04-14 | Closing price | 15.640000343322754 |
| 2026-04-15 | Closing price | 15.09000015258789 |
| 2026-04-16 | Closing price | 14.819999694824219 |
| 2026-04-17 | Closing price | 15.609999656677246 |
| 2026-04-20 | Closing price | 15.390000343322754 |
| 2026-04-21 | Closing price | 14.170000076293945 |
| 2026-04-22 | Closing price | 14.4399995803833 |
| 2026-04-23 | Closing price | 14.079999923706055 |
| 2026-04-24 | Closing price | 14.329999923706055 |
| 2026-04-27 | Closing price | 14.34000015258789 |
| 2026-04-28 | Closing price | 13.829999923706055 |
| 2026-04-29 | Closing price | 13.4399995803833 |
| 2026-04-30 | Closing price | 13.960000038146973 |
| 2026-05-01 | Closing price | 13.979999542236328 |
| 2026-05-04 | Closing price | 13.859999656677246 |
| 2026-05-05 | Closing price | 13.600000381469727 |
| 2026-05-06 | Closing price | 14.369999885559082 |
| 2026-05-07 | Closing price | 14.369999885559082 |
| 2026-05-08 | Closing price | 14.289999961853027 |
| 2026-05-11 | Closing price | 14.859999656677246 |
| 2026-05-12 | Closing price | 14.800000190734863 |
| 2026-05-13 | Closing price | 14.489999771118164 |
| 2026-05-14 | Closing price | 14.329999923706055 |
| 2026-05-15 | Closing price | 13.229999542236328 |
| 2026-05-18 | Closing price | 12.930000305175781 |
| 2026-05-19 | Closing price | 12.220000267028809 |
| 2026-05-20 | Closing price | 12.420000076293945 |
| 2026-05-21 | Closing price | 12.3100004196167 |
| 2026-05-22 | Closing price | 12.130000114440918 |
| 2026-05-26 | Closing price | 12.619999885559082 |
| 2026-05-27 | Closing price | 12.229999542236328 |
| 2026-05-28 | Closing price | 12.579999923706055 |
| 2026-05-29 | Closing price | 13.539999961853027 |
| 2026-06-01 | Closing price | 12.5 |
| 2026-06-02 | Closing price | 12.109999656677246 |
| 2026-06-03 | Closing price | 11.220000267028809 |
| 2026-06-04 | Closing price | 11.5 |
| 2026-06-05 | Closing price | 10.789999961853027 |
| 2026-06-08 | Closing price | 10.84000015258789 |
| 2026-06-09 | Closing price | 10.460000038146973 |
| 2026-06-10 | Closing price | 9.729999542236328 |
| 2026-06-11 | Closing price | 10.239999771118164 |
| 2026-06-12 | Closing price | 10.539999961853027 |
| 2026-06-15 | Closing price | 11.199999809265137 |
| 2026-06-16 | Closing price | 11.539999961853027 |
| 2026-06-17 | Closing price | 11.029999732971191 |
| 2026-06-18 | Closing price | 10.510000228881836 |
| 2026-06-22 | Closing price | 10.25 |
| 2026-06-23 | Closing price | 9.770000457763672 |
| 2026-06-24 | Closing price | 9.369999885559082 |
| 2026-06-25 | Closing price | 9.40999984741211 |
| 2026-06-26 | Closing price | 9.710000038146973 |
| 2026-06-29 | Closing price | 9.729999542236328 |
| 2026-06-30 | Closing price | 9.720000267028809 |
| 2026-07-01 | Closing price | 9.75 |
| 2026-07-02 | Closing price | 10.140000343322754 |
| 2026-07-06 | Closing price | 10.3100004196167 |
| 2026-07-07 | Closing price | 9.8100004196167 |
| 2026-07-08 | Closing price | 9.4399995803833 |
| 2026-07-09 | Closing price | 9.739999771118164 |
| 2026-07-10 | Closing price | 9.760000228881836 |
| 2026-07-13 | Closing price | 9.449999809265137 |
| 2026-07-14 | Closing price | 9.5 |
| 2026-07-15 | Closing price | 9.350000381469727 |
| 2026-07-16 | Closing price | 8.75 |
| 2026-07-17 | Closing price | 8.619999885559082 |
| 2026-07-20 | Closing price | 8.680000305175781 |
| 2026-07-21 | Closing price | 9.0600004196167 |
| 2026-07-22 | Closing price | 9.350000381469727 |
| 2026-07-23 | Closing price | 9.289999961853027 |
| 2026-07-24 | Closing price | 9.279999732971191 |
| 2026-07-27 | Closing price | 9.520000457763672 |
| 2026-07-28 | Closing price | 9.149999618530273 |
| 2026-07-29 | Closing price | 8.960000038146973 |
| 2026-07-30 | Closing price | 9.40999984741211 |
| 2026-07-31 | Closing price | 8.949999809265137 |
| 2026-08-03 | Closing price | 9.180000305175781 |
| 2026-08-04 | Closing price | 9.579999923706055 |
| 2026-08-05 | Closing price | 10.319999694824219 |
| 2026-08-06 | Closing price | 10.739999771118164 |
| 2026-08-07 | Closing price | 11.579999923706055 |
| 2026-08-10 | Closing price | 11.59000015258789 |
| 2026-08-11 | Closing price | 11.65999984741211 |
| 2026-08-12 | Closing price | 11.529999732971191 |
| 2026-08-13 | Closing price | 11.220000267028809 |
| 2026-08-14 | Closing price | 11.600000381469727 |
| 2026-08-17 | Closing price | 11.789999961853027 |
| 2026-08-18 | Closing price | 11.449999809265137 |
| 2026-08-19 | Closing price | 12.65999984741211 |
| 2026-08-20 | Closing price | 12.880000114440918 |
| 2026-08-21 | Closing price | 13.529999732971191 |
| 2026-08-24 | Closing price | 13.760000228881836 |
| 2026-08-25 | Closing price | 13.979999542236328 |
| 2026-08-26 | Closing price | 13.630000114440918 |
| 2026-08-27 | Closing price | 13.449999809265137 |
| 2026-08-28 | Closing price | 12.989999771118164 |
| 2026-08-31 | Closing price | 12.859999656677246 |
| 2026-09-01 | Closing price | 12.180000305175781 |
| 2026-09-02 | Closing price | 12.630000114440918 |
| 2026-09-03 | Closing price | 13.119999885559082 |
| 2026-09-04 | Closing price | 12.8100004196167 |
| 2026-09-08 | Closing price | 12.640000343322754 |
| 2026-09-09 | Closing price | 12.850000381469727 |
| 2026-09-10 | Closing price | 12.199999809265137 |
| 2026-09-11 | Closing price | 12.399999618530273 |
| 2026-09-14 | Closing price | 11.850000381469727 |
| 2026-09-15 | Closing price | 11.859999656677246 |
| 2026-09-16 | Closing price | 11.579999923706055 |
| 2026-09-17 | Closing price | 12.220000267028809 |
| 2026-09-18 | Closing price | 12.449999809265137 |
| 2026-09-21 | Closing price | 12.15999984741211 |
| 2026-09-22 | Closing price | 12.760000228881836 |
| 2026-09-23 | Closing price | 12.050000190734863 |
| 2026-09-24 | Closing price | 11.729999542236328 |
| 2026-09-25 | Closing price | 11.9399995803833 |
| 2026-09-28 | Closing price | 11.229999542236328 |
| 2026-09-29 | Closing price | 11.399999618530273 |
| 2026-09-30 | Closing price | 11.109999656677246 |
| 2026-10-01 | Closing price | 10.819999694824219 |
| 2026-10-02 | Closing price | 11.109999656677246 |
| 2026-10-05 | Closing price | 11.229999542236328 |
| 2026-10-06 | Closing price | 11.380000114440918 |
| 2026-10-07 | Closing price | 10.949999809265137 |
| 2026-10-08 | Closing price | 11.119999885559082 |
| 2026-10-09 | Closing price | 11.420000076293945 |
| 2026-10-12 | Closing price | 11.199999809265137 |
| 2026-10-13 | Closing price | 10.850000381469727 |
| 2026-10-14 | Closing price | 10.289999961853027 |
| 2026-10-15 | Closing price | 11.109999656677246 |
| 2026-10-16 | Closing price | 11.149999618530273 |
| 2026-10-19 | Closing price | 11.09000015258789 |
| 2026-10-20 | Closing price | 11.0600004196167 |
| 2026-10-21 | Closing price | 11.039999961853027 |
| 2026-10-22 | Closing price | 10.359999656677246 |
| 2026-10-23 | Closing price | 10.109999656677246 |
| 2026-10-26 | Closing price | 10.050000190734863 |
| 2026-10-27 | Closing price | 10.430000305175781 |
| 2026-10-28 | Closing price | 10.479999542236328 |
| 2026-10-29 | Closing price | 10.180000305175781 |
| 2026-10-30 | Closing price | 9.699999809265137 |
| 2026-11-02 | Closing price | 10.079999923706055 |
| 2026-11-03 | Closing price | 10.0 |
| 2026-11-04 | Closing price | 11.279999732971191 |
| 2026-11-05 | Closing price | 11.279999732971191 |
| 2026-11-06 | Closing price | 11.520000457763672 |
| 2026-11-09 | Closing price | 12.09000015258789 |
| 2026-11-10 | Closing price | 11.229999542236328 |
Trailing twelve-month dividend yield is 0.47%, and the payout can grow only if the margin recovers
The trailing twelve-month dividend yield is 0.47% – payouts are small relative to the share price. With a market capitalisation of 7078.3 million USD, that is about 33.4 million USD of dividends a year.
Our estimate: the dividend is unlikely to grow this year, as net profit fell 27.0% in the reported quarter and the margin is compressing. The payout depends on the payout ratio and on the profit the company earns at current gold prices.
A yield of 0.47% is below the key rate and is not an argument for the share. For this stock the dividend is a nice extra, not a reason to buy.
Valuation on the latest reported figures
| Metric | Value |
|---|---|
| Market cap | 7.08 bn USD |
| P/E (LTM) | 32.0 |
| EV/EBITDA (LTM) | 9.1 |
| P/B | 1.22 |
| Net debt / EBITDA (LTM) | -0.02 |
| ROE | 1.0% |
| Dividend yield (12m) | 0.5% |
| EV/EBITDA, 3-year average | 14.5 |
Net profit by quarter
| Period | Measure | bn USD |
|---|---|---|
| Q2 2025 | Net profit | 0.023844999999999998 |
| Q3 2025 | Net profit | 0.085575 |
| Q1 2026 | Net profit | 0.31011099999999997 |
| Q2 2026 | Net profit | 0.23061600000000002 |
| Q3 2026 | Net profit | 0.062479 |
Bottom line
The balance sheet remains the strong point: net cash of 15.9 million USD and net debt/EBITDA at minus 0.02. The weak spot is the margin: the EBITDA margin compressed from 41.3% to 37.2%, net profit fell 27.0%, and by our calculation the company fell 77.7 million USD short of the EBITDA implied by gold prices. The key question for a holder is whether the company can contain costs with diesel and power more expensive. Our conclusion: rather attractive – the portal model puts the upside to fair value at +21%. Our view: the share is rather attractive at the current price; upside on the portal model +21%.