Energy Transfer LP: revenue up 85.9%, but almost all of it is commodity turnover while profit rose only 18.4%
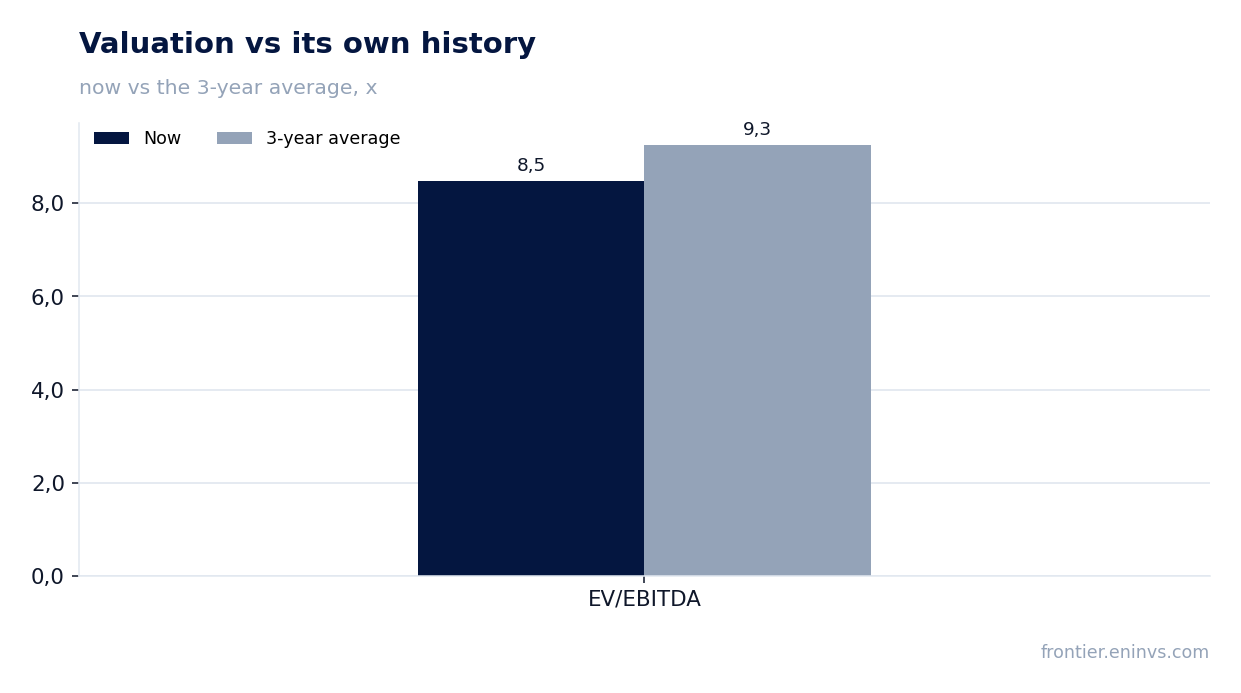
On 3 November Energy Transfer LP reported third-quarter 2026 results. Revenue rose 85.9% year on year to USD 37.1 bn, adjusted EBITDA by 40.1% to USD 5.0 bn and net profit by 18.4% to USD 1.2 bn. The top-line growth comes mostly from consolidating Sunoco LP and commodity resale rather than organic production; yet the stock trades below its own three-year history on EV/EBITDA (8.5 versus 9.3) and yields 6.7%, so at the current price it looks rather attractive.
Key takeaways
— Revenue rose 85.9% largely because of consolidating Sunoco LP, not organically
— EBITDA grew 40.1%, but the margin fell from 18.0% to 13.6% on commodity revenue
— Net profit rose only 18.4% because noncontrolling interests took USD 593 mn
— Leverage of 4.74x LTM EBITDA is a level, not an improvement: net debt rose from USD 62.2 bn to 85.4 bn over the year
— Capex was USD 1.6 bn for the quarter, with about USD 7 bn planned for 2027
— The distribution of USD 0.3425 per quarter is the twentieth consecutive increase, a 6.7% yield
— EV/EBITDA of 8.5 is below its own three-year average of 9.3, and the portal model implies +99% upside
Attractiveness
Key figures, USD bn
| Metric | Q3 2025 | Q3 2026 | Change |
|---|---|---|---|
| Revenue | 20.0 | 37.1 | +85.9% |
| EBITDA | 3.59 | 5.03 | +40.1% |
| Operating profit | 2.15 | 2.78 | +29.3% |
| Net profit | 1.02 | 1.21 | +18.4% |
| Operating cash flow | 2.57 | — | — |
| Capex | 1.30 | 1.58 | +22.1% |
| EBITDA margin | 18.0% | 13.6% | -4.4 pp |
| Net margin | 5.1% | 3.3% | -1.8 pp |
Revenue rose 85.9% largely because of consolidating Sunoco LP, not organically
Third-quarter 2026 revenue was USD 37.1 bn against 20.0 bn a year earlier, up 85.9%. There is acceleration versus the second quarter (78.4%), but the nature of the growth is commodity: in the investment in Sunoco LP segment revenue jumped from 6.0 to 18.0 bn on recent acquisitions, and in crude oil from 6.0 to 9.4 bn mostly on marketing activity.
Physical volumes grow more modestly: intrastate gas transportation rose 14% to a record, midstream gathering 6%, NGL transportation 6%, NGL exports 9%. These figures confirm the base is working, but they do not explain the doubling of revenue.
For a holder it matters that commodity revenue barely reaches profit: cost of products sold rose from 14.6 to 30.5 bn, faster than revenue. The company therefore cannot be valued on revenue – EBITDA and cash flow are what count.
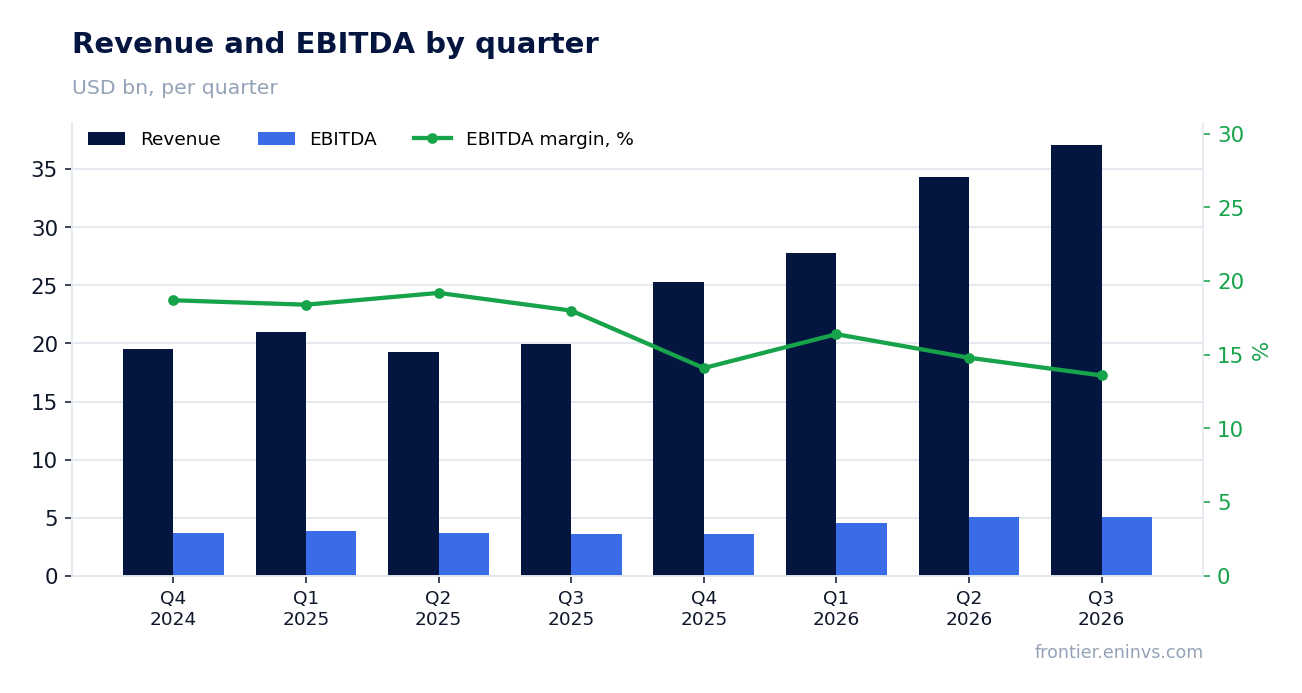
EBITDA grew 40.1%, but the margin fell from 18.0% to 13.6% on commodity revenue
Adjusted EBITDA for the third quarter of 2026 was USD 5.0 bn against 3.8 bn a year earlier, up 40.1%. That is markedly slower than revenue, and the EBITDA margin fell from 18.0% to 13.6%: the denominator was inflated by commodity resale, not operating efficiency.
By segment the gains came from investment in Sunoco LP (1.05 bn versus 0.49 bn), midstream (0.86 versus 0.75 bn) and NGL (1.22 versus 1.05 bn). In NGL and crude oil part of the gain is marketing margin on favourable conditions, and the company warns it will be partly offset by USD 100 mn of realised derivative losses in future periods.
The quarterly EBITDA is therefore sound but not all repeatable. The durable part is volume growth and new capacity; the one-off part is marketing spreads.
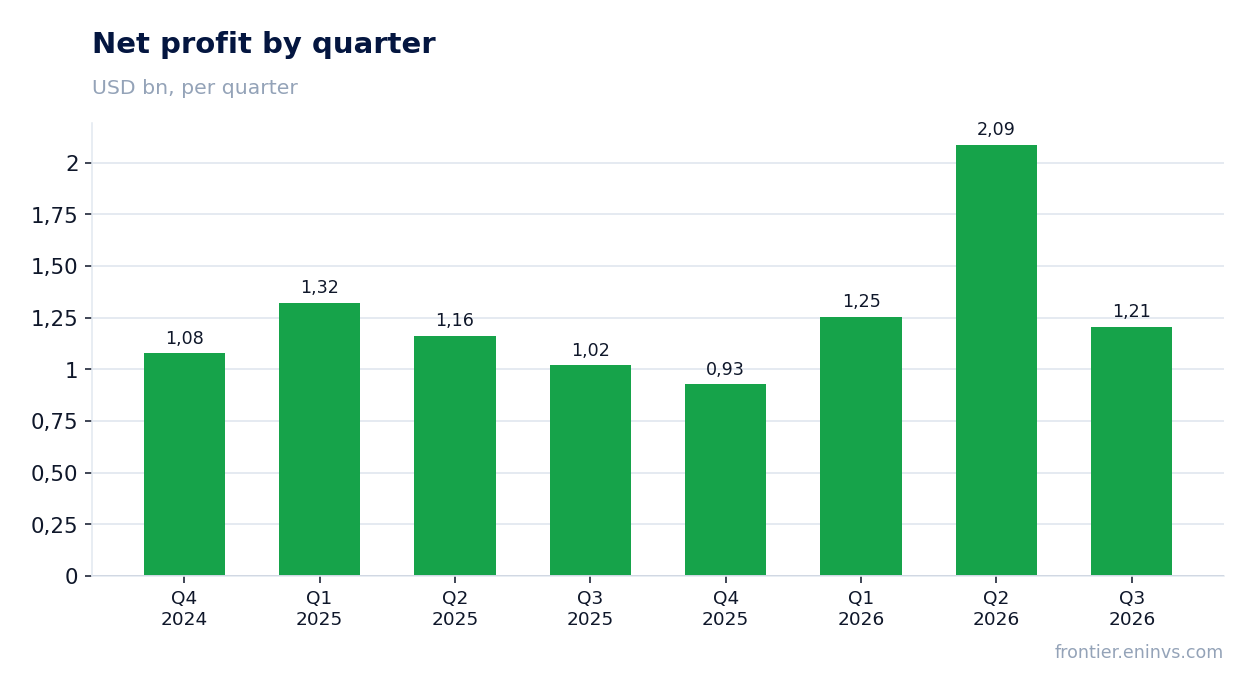
Net profit rose only 18.4% because noncontrolling interests took USD 593 mn
Net profit attributable to partners for the third quarter of 2026 was USD 1.2 bn against 1.0 bn a year earlier, up 18.4%. The gap with EBITDA growth of 40.1% is structural rather than operational: profit attributable to noncontrolling interests rose from 259 to 593 mn, mainly on consolidated Sunoco LP and USAC.
Interest expense rose from 890 to 944 mn, income tax from 87 to 187 mn. Operating profit rose from 2.2 to 2.8 bn, or 29.3%, faster than net profit.
The net margin fell from 5.1% to 3.3% for the same reason as the EBITDA margin: commodity revenue. Earnings per unit were USD 0.33 against 0.28 a year earlier.
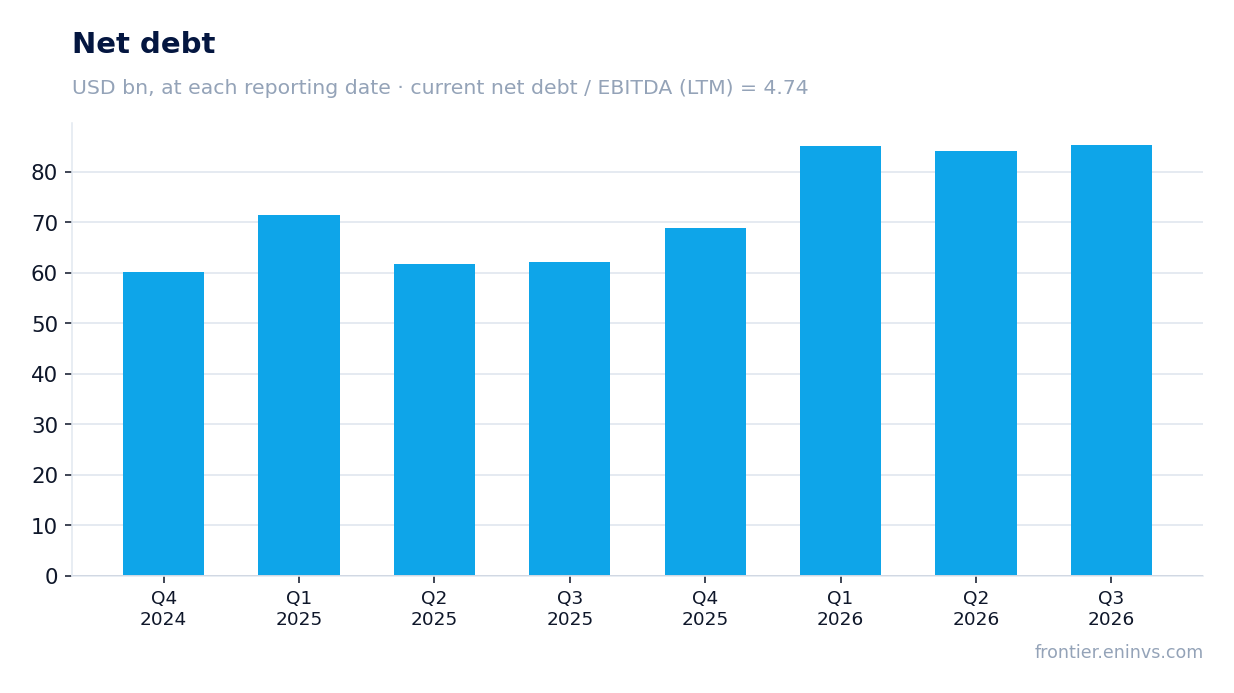
Leverage of 4.74x LTM EBITDA is a level, not an improvement: net debt rose from USD 62.2 bn to 85.4 bn over the year
Net debt at 30 September 2026 was USD 85.4 bn, or 4.74x trailing-twelve-month EBITDA. That is a level, not a direction: the report gives no earlier value of the ratio, so leverage cannot be called improved or worsened.
Net debt itself rose: from 84.1 bn at 30 June 2026 to 85.4 bn at 30 September (+1.3 bn), and over the year from 62.2 bn at 30 September 2025 to 85.4 bn (+23.2 bn). The annual increase is partly acquisitions and the Sunoco LP consolidation, but it is still large against LTM EBITDA of 18.0 bn.
Liquidity is there: at 30 September 2026 the USD 5.0 bn revolver had USD 4.41 bn available, maturing April 2029. In August the company redeemed USD 900 mn of 6.500% Series H preferred units using proceeds from junior subordinated notes – a refinancing, not a reduction of debt.
Capex was USD 1.6 bn for the quarter, with about USD 7 bn planned for 2027
Capital expenditure for the third quarter of 2026 was USD 1.6 bn, of which growth was 1.30 bn and maintenance 284 mn. For the nine months maintenance capex was 1.1 bn, and the company keeps its 2026 growth plan at USD 5.4–5.6 bn, with about USD 7 bn for 2027.
The projects are real: in September Phase I of the Hugh Brinson Pipeline entered service ahead of schedule, in October the 275 MMcf/d Mustang Draw II plant started up, and in November a final investment decision was taken on the South Mississippi Pipeline at about USD 1.6 bn, due in service in 2030.
A rising programme means free cash flow after construction will be constrained, and the distribution is partly funded by debt growth. That is the key fork for a holder: either the new capacity pays off, or leverage of 4.74 stays for long.
The distribution of USD 0.3425 per quarter is the twentieth consecutive increase, a 6.7% yield
For the third quarter of 2026 a distribution of USD 0.3425 per unit was declared, or 1.37 annualised, more than 3% above the third quarter of 2025. It is the twentieth consecutive increase and rests on distributable cash flow of 2.52 bn for the quarter against 1.90 bn a year earlier, up 33%.
Our estimate for the current year is about USD 1.37 per unit if the quarterly pace holds; it rests on distributable cash flow of 7.8 bn for the nine months against 6.2 bn a year earlier. The risk to the payout is the capex programme rising to USD 7 bn in 2027 and interest of 944 mn for the quarter.
The yield at the current price is 6.7%. It cannot be compared directly with a policy rate: no rate is in the facts and the security is dollar-denominated. But for an infrastructure name with twenty years of increases, 6.7% is a level that partly compensates for the debt load.
EV/EBITDA of 8.5 is below its own three-year average of 9.3, and the portal model implies +99% upside
On trailing-twelve-month EV/EBITDA the stock trades at 8.5 against its own three-year average of 9.3, or 8% below its history. P/E LTM is 12.7, ROE 11.4%. This is not a growth story but an infrastructure cash flow, and a multiple below its own history is support for that profile.
Our portal model re-prices EBITDA at current commodity prices at the target EV/EBITDA and implies +99% upside to fair value. That is our own estimate, not a market consensus and not a target price.
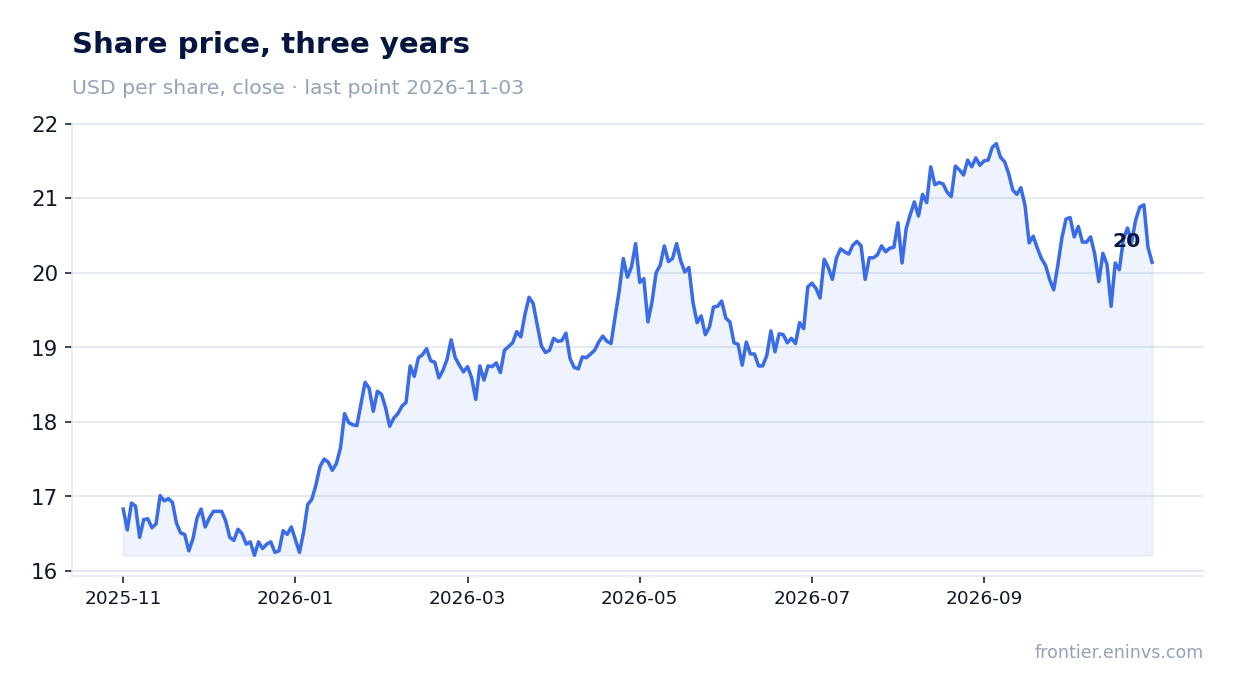
The market reaction was muted: the stock lost 1.0% on the release day and 1.0% from the release to 3 November 2026. The market saw commodity revenue growth and did not believe its quality – hence the discount to history.
Valuation on the latest reported figures
| Metric | Value |
|---|---|
| Market cap | 69.3 bn USD |
| P/E (LTM) | 12.7 |
| EV/EBITDA (LTM) | 8.5 |
| P/B | 1.09 |
| Net debt / EBITDA (LTM) | 4.74 |
| ROE | 11.4% |
| Dividend yield (12m) | 6.7% |
| EV/EBITDA, 3-year average | 9.3 |
Bottom line
What was genuinely strong in the report was not the doubling of revenue but physical volume growth and EBITDA up 40.1%: intrastate gas transportation rose 14% to a record and midstream gathering 6%. What was weak was the quality of that growth: the EBITDA margin fell from 18.0% to 13.6%, net profit rose only 18.4% because of noncontrolling interests, and the company itself calls part of the marketing margin temporary. Leverage of 4.74x LTM EBITDA is a level, not an improvement, and over the year net debt rose from USD 62.2 bn to 85.4 bn. The question for a holder now is whether the USD 7 bn of 2027 capex pays off before the debt load becomes a constraint on the distribution. At 8.5 times against its own history of 9.3 and a 6.7% yield, the stock looks rather attractive at the current price.
Open the company's financial profile ET →
See also: market overview · valuation map · stock screeners