Greenfire Resources: revenue doubled, but EBITDA fell short of what the oil price implied
Contents
On 18 November Greenfire Resources reported results for the third quarter of 2026. The average WTI price in the period was USD 85.4 versus USD 64.9 a year earlier (+31.7%), and spot is now USD 84.2. Revenue rose 112.2% to USD 217.3m, but EBITDA added only 55.6% to USD 25.0m, whereas at year-ago volumes and costs our calculation puts it at USD 46.8m. The EBITDA margin fell to 11.5% from 15.7%, and net profit was minus USD 14.9m. Our conclusion: the share is rather unattractive – on the portal's model its upside to fair value is negative, minus 36%. Our view: the share is rather unattractive at the current price; upside on the portal model -36%.
Our view: is there upside
Our view in numbers
| Metric | Our read |
|---|---|
| Verdict | Rather unattractive |
| Upside on the portal model | -36% |
| How the model works | spot model: EBITDA re-priced to current commodity prices at the target EV/EBITDA, against market cap |
| Net debt / EBITDA | 12.36 – high leverage |
| Strongest case for | Revenue rose 112.2% to USD 217.3m, and at a WTI price of USD 85.4 the company still generates positive operating cash flow of USD 60.8m in the quarter. |
| Strongest case against | At a price of USD 85.4 EBITDA was USD 25.0m against USD 46.8m in our calculation, and leverage of 12.36x LTM EBITDA leaves no cushion. |
| What would change the view | The verdict would improve to neutral if EBITDA at the current WTI spot of USD 84.2 exceeded USD 46.8m – the level the year-ago price backdrop implied. |
Key takeaways
— Oil rose 31.7% year on year, but spot is already below the quarterly average
— Revenue grew 112.2% while EBITDA added only 55.6%, and the gap is in costs, not price
— At year-ago volumes and costs our calculation puts EBITDA at USD 46.8m against the reported USD 25.0m
— The EBITDA margin compressed to 11.5% from 15.7%, and all of the revenue gain went into costs
— The net loss of USD 14.9m with an operating loss of USD 8.8m – depreciation of USD 33.8m eats the operating result
— Leverage of 12.36x LTM EBITDA at an EV/EBITDA of 34.2 – the market pays for profit that is not there yet
— On the portal's model the share trades 36% above fair value
Key figures, USD bn
| Metric | Q3 2025 | Q3 2026 | Change |
|---|---|---|---|
| Revenue | 0.10 | 0.22 | +112.2% |
| EBITDA | 0.02 | 0.02 | +55.6% |
| Operating profit | 0.01 | -0.01 | -169.1% |
| Net profit | -0.01 | -0.01 | — |
| Operating cash flow | 0.04 | 0.06 | +71.8% |
| EBITDA margin | 15.7% | 11.5% | -4.2 pp |
| Net margin | -6.2% | -6.9% | -0.7 pp |
Oil rose 31.7% year on year, but spot is already below the quarterly average
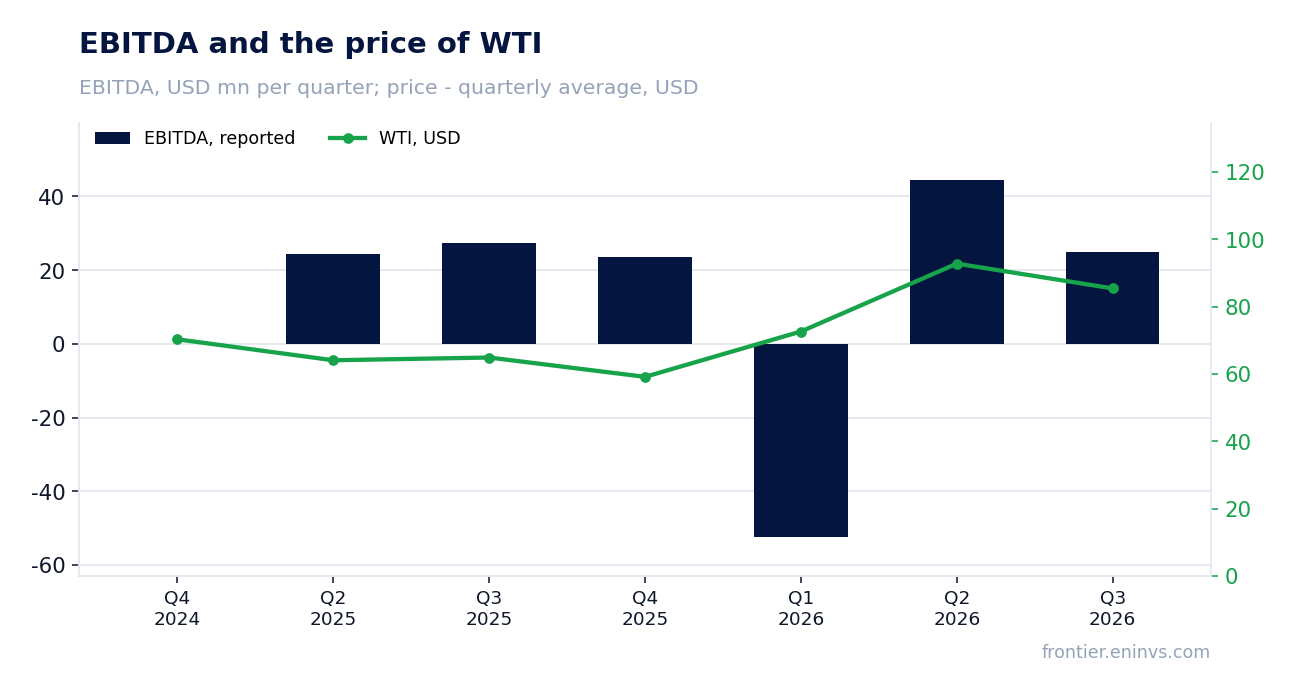
The average WTI price in the third quarter of 2026 was USD 85.4 per barrel versus USD 64.9 a year earlier – a rise of 31.7%. Against the previous quarter the price fell 7.9% from USD 92.8, and spot on 18 November is USD 84.2, 1.4% below the reported-period average.
For a producer this means the price backdrop of the quarter was markedly better than a year ago but is already turning down. Revenue of USD 217.3m reflects both price and volumes, but price made the main contribution: at unchanged volumes and costs our calculation shows it alone would have added USD 30.8m to year-ago revenue.
Further price movement will determine both revenue and margin. At the current spot of USD 84.2, quarterly revenue will be below the reported figure unless volumes grow.
Commodity prices: period average and now
| Benchmark | Year ago | Q3 2026 | YoY | Spot 2026-11-18 |
|---|---|---|---|---|
| WTI, USD | 64,9 | 85,4 | +31,7% | 84,2 |
Revenue grew 112.2% while EBITDA added only 55.6%, and the gap is in costs, not price
Revenue in the third quarter of 2026 was USD 217.3m versus USD 102.4m a year earlier, up 112.2%. That is an acceleration from the previous quarter's 23.5% growth: in the second quarter revenue was USD 129.0m.
EBITDA rose 55.6% to USD 25.0m, but at half the pace of revenue. At year-ago volumes and costs and on price alone, our calculation puts revenue at USD 133.2m and EBITDA at USD 46.8m. Actual revenue is USD 84.1m above the implied figure, while EBITDA is USD 21.9m below it.
The gap means costs grew along with revenue – either volumes, or unit costs, or both. The report does not disclose which line drove the increase, so we record the fact itself: the price promised more EBITDA than the company earned.
What the prices implied and what the company earned
| Base (Q3 2025) | Implied at period prices | Reported | Reported vs implied | |
|---|---|---|---|---|
| Revenue, USD mn | 102,4 | 133,2 | 217,3 | +63,1% |
| EBITDA, USD mn | 16,0 | 46,8 | 25,0 | -46,7% |
Revenue and EBITDA by quarter
| Period | Measure | bn USD |
|---|---|---|
| Q4 2024 | Revenue | 0.149387 |
| Q2 2025 | Revenue | 0.10452 |
| Q3 2025 | Revenue | 0.102399 |
| Q4 2025 | Revenue | 0.09627200000000001 |
| Q1 2026 | Revenue | 0.107084 |
| Q2 2026 | Revenue | 0.129037 |
| Q3 2026 | Revenue | 0.217297 |
| Q2 2025 | EBITDA | 0.024445 |
| Q3 2025 | EBITDA | 0.027506999999999997 |
| Q4 2025 | EBITDA | 0.023584 |
| Q1 2026 | EBITDA | −0.052416 |
| Q2 2026 | EBITDA | 0.044368000000000005 |
| Q3 2026 | EBITDA | 0.024960999999999997 |
EBITDA margin
| Period | Measure | % |
|---|---|---|
| Q4 2024 | EBITDA margin | — |
| Q2 2025 | EBITDA margin | 23.4 |
| Q3 2025 | EBITDA margin | 26.9 |
| Q4 2025 | EBITDA margin | 24.5 |
| Q1 2026 | EBITDA margin | −48.9 |
| Q2 2026 | EBITDA margin | 34.4 |
| Q3 2026 | EBITDA margin | 11.5 |
Missing EBITDA shown as zero, as in the original chart
At year-ago volumes and costs our calculation puts EBITDA at USD 46.8m against the reported USD 25.0m
The comparison with the previous quarter gives the same picture. At second-quarter 2026 volumes and costs and with only the price changing (from USD 92.8 to USD 85.4), revenue would have been USD 119.3m and EBITDA USD 34.6m. Actual revenue is USD 98.0m higher, EBITDA USD 9.7m lower.
Both calculations show the company growing revenue faster than EBITDA, with the revenue gain not converting into profit. This could reflect higher production volumes at high unit costs or one-off charges, but the report gives no breakdown, so we do not name a cause.
For an investor the gap itself matters: at a price of USD 85.4 the company earned USD 25.0m of EBITDA, whereas the price backdrop implied USD 46.8m.
The EBITDA margin compressed to 11.5% from 15.7%, and all of the revenue gain went into costs
The EBITDA margin in the third quarter of 2026 was 11.5% versus 15.7% a year earlier. With revenue of USD 217.3m and EBITDA of USD 25.0m, each dollar of revenue brings markedly less operating profit than a year ago.
The operating loss was USD 8.8m against depreciation of USD 33.8m – depreciation is what turns the operating loss into EBITDA of USD 25.0m. The net loss was USD 14.9m, a margin of minus 6.9% versus minus 6.2% a year earlier.
Margin compression amid rising oil prices is the report's main signal. It means costs per barrel rose faster than the realised price, and without a cost breakdown the company cannot show the market where exactly it is losing profit.
The net loss of USD 14.9m with an operating loss of USD 8.8m – depreciation of USD 33.8m eats the operating result
An operating loss of USD 8.8m on revenue of USD 217.3m means operating expenses exceeded revenue. EBITDA of USD 25.0m comes from depreciation of USD 33.8m, which is not a cash cost but reflects the capital intensity of production.
The net loss of USD 14.9m is USD 6.1m larger than the operating loss – the difference comes from items below operating profit that are not included in EBITDA. The report does not disclose their composition, so we do not name a cause.
For a shareholder what matters is that the company does not yet earn at the operating level: even at a price of USD 85.4 the operating result is negative.
Leverage of 12.36x LTM EBITDA at an EV/EBITDA of 34.2 – the market pays for profit that is not there yet
Net debt at 30 September 2026 was USD 417.9m against LTM EBITDA of USD 33.8m. The ratio of net debt to LTM EBITDA is 12.36 – a level at which debt service absorbs almost all of EBITDA.
Operating cash flow was USD 60.8m in the reported quarter and USD 112.7m over the last twelve months. Capital expenditure in the quarter was USD 43.8m, so free cash flow is positive, but a small part of EBITDA goes to sustaining production.
The LTM EV/EBITDA is 34.2 on a market capitalisation of USD 966.9m. The market pays a high multiple for profit earned at lower prices, which creates correction risk if EBITDA does not recover.
Share price, three years
close, last point 2026-11-17
| Period | Measure | USD per share |
|---|---|---|
| 2025-11-18 | Closing price | 4.989999771118164 |
| 2025-11-19 | Closing price | 5.079999923706055 |
| 2025-11-20 | Closing price | 5.360000133514404 |
| 2025-11-21 | Closing price | 5.179999828338623 |
| 2025-11-24 | Closing price | 5.159999847412109 |
| 2025-11-25 | Closing price | 5.139999866485596 |
| 2025-11-26 | Closing price | 4.71999979019165 |
| 2025-11-28 | Closing price | 4.570000171661377 |
| 2025-12-01 | Closing price | 4.670000076293945 |
| 2025-12-02 | Closing price | 4.730000019073486 |
| 2025-12-03 | Closing price | 4.909999847412109 |
| 2025-12-04 | Closing price | 4.949999809265137 |
| 2025-12-05 | Closing price | 5.110000133514404 |
| 2025-12-08 | Closing price | 4.920000076293945 |
| 2025-12-09 | Closing price | 4.769999980926514 |
| 2025-12-10 | Closing price | 4.710000038146973 |
| 2025-12-11 | Closing price | 4.630000114440918 |
| 2025-12-12 | Closing price | 4.5 |
| 2025-12-15 | Closing price | 4.380000114440918 |
| 2025-12-16 | Closing price | 4.329999923706055 |
| 2025-12-17 | Closing price | 4.510000228881836 |
| 2025-12-18 | Closing price | 4.71999979019165 |
| 2025-12-19 | Closing price | 4.400000095367432 |
| 2025-12-22 | Closing price | 4.46999979019165 |
| 2025-12-23 | Closing price | 4.670000076293945 |
| 2025-12-24 | Closing price | 4.71999979019165 |
| 2025-12-26 | Closing price | 4.639999866485596 |
| 2025-12-29 | Closing price | 4.809999942779541 |
| 2025-12-30 | Closing price | 4.75 |
| 2025-12-31 | Closing price | 4.760000228881836 |
| 2026-01-02 | Closing price | 4.809999942779541 |
| 2026-01-05 | Closing price | 4.659999847412109 |
| 2026-01-06 | Closing price | 4.559999942779541 |
| 2026-01-07 | Closing price | 4.46999979019165 |
| 2026-01-08 | Closing price | 4.579999923706055 |
| 2026-01-09 | Closing price | 4.739999771118164 |
| 2026-01-12 | Closing price | 4.880000114440918 |
| 2026-01-13 | Closing price | 4.940000057220459 |
| 2026-01-14 | Closing price | 5.070000171661377 |
| 2026-01-15 | Closing price | 4.980000019073486 |
| 2026-01-16 | Closing price | 4.960000038146973 |
| 2026-01-20 | Closing price | 4.889999866485596 |
| 2026-01-21 | Closing price | 5.230000019073486 |
| 2026-01-22 | Closing price | 5.190000057220459 |
| 2026-01-23 | Closing price | 5.400000095367432 |
| 2026-01-26 | Closing price | 5.260000228881836 |
| 2026-01-27 | Closing price | 5.539999961853027 |
| 2026-01-28 | Closing price | 5.5 |
| 2026-01-29 | Closing price | 5.539999961853027 |
| 2026-01-30 | Closing price | 5.449999809265137 |
| 2026-02-02 | Closing price | 5.340000152587891 |
| 2026-02-03 | Closing price | 5.480000019073486 |
| 2026-02-04 | Closing price | 5.670000076293945 |
| 2026-02-05 | Closing price | 5.489999771118164 |
| 2026-02-06 | Closing price | 5.739999771118164 |
| 2026-02-09 | Closing price | 6.03000020980835 |
| 2026-02-10 | Closing price | 5.880000114440918 |
| 2026-02-11 | Closing price | 6.03000020980835 |
| 2026-02-12 | Closing price | 5.739999771118164 |
| 2026-02-13 | Closing price | 5.78000020980835 |
| 2026-02-17 | Closing price | 5.769999980926514 |
| 2026-02-18 | Closing price | 5.940000057220459 |
| 2026-02-19 | Closing price | 6.139999866485596 |
| 2026-02-20 | Closing price | 6.079999923706055 |
| 2026-02-23 | Closing price | 5.909999847412109 |
| 2026-02-24 | Closing price | 5.840000152587891 |
| 2026-02-25 | Closing price | 5.739999771118164 |
| 2026-02-26 | Closing price | 5.789999961853027 |
| 2026-02-27 | Closing price | 5.940000057220459 |
| 2026-03-02 | Closing price | 5.96999979019165 |
| 2026-03-03 | Closing price | 6.159999847412109 |
| 2026-03-04 | Closing price | 6.050000190734863 |
| 2026-03-05 | Closing price | 6.369999885559082 |
| 2026-03-06 | Closing price | 6.639999866485596 |
| 2026-03-09 | Closing price | 6.570000171661377 |
| 2026-03-10 | Closing price | 6.179999828338623 |
| 2026-03-11 | Closing price | 6.269999980926514 |
| 2026-03-12 | Closing price | 6.320000171661377 |
| 2026-03-13 | Closing price | 5.989999771118164 |
| 2026-03-16 | Closing price | 6.03000020980835 |
| 2026-03-17 | Closing price | 5.949999809265137 |
| 2026-03-18 | Closing price | 6.170000076293945 |
| 2026-03-19 | Closing price | 6.599999904632568 |
| 2026-03-20 | Closing price | 6.920000076293945 |
| 2026-03-23 | Closing price | 6.809999942779541 |
| 2026-03-24 | Closing price | 6.670000076293945 |
| 2026-03-25 | Closing price | 6.449999809265137 |
| 2026-03-26 | Closing price | 6.429999828338623 |
| 2026-03-27 | Closing price | 6.579999923706055 |
| 2026-03-30 | Closing price | 6.46999979019165 |
| 2026-03-31 | Closing price | 6.320000171661377 |
| 2026-04-01 | Closing price | 6.070000171661377 |
| 2026-04-02 | Closing price | 6.300000190734863 |
| 2026-04-06 | Closing price | 6.300000190734863 |
| 2026-04-07 | Closing price | 6.28000020980835 |
| 2026-04-08 | Closing price | 5.980000019073486 |
| 2026-04-09 | Closing price | 5.909999847412109 |
| 2026-04-10 | Closing price | 5.909999847412109 |
| 2026-04-13 | Closing price | 6.070000171661377 |
| 2026-04-14 | Closing price | 6.150000095367432 |
| 2026-04-15 | Closing price | 6.090000152587891 |
| 2026-04-16 | Closing price | 6.239999771118164 |
| 2026-04-17 | Closing price | 5.690000057220459 |
| 2026-04-20 | Closing price | 5.78000020980835 |
| 2026-04-21 | Closing price | 5.909999847412109 |
| 2026-04-22 | Closing price | 6.03000020980835 |
| 2026-04-23 | Closing price | 5.980000019073486 |
| 2026-04-24 | Closing price | 6.099999904632568 |
| 2026-04-27 | Closing price | 6.230000019073486 |
| 2026-04-28 | Closing price | 6.199999809265137 |
| 2026-04-29 | Closing price | 6.570000171661377 |
| 2026-04-30 | Closing price | 6.730000019073486 |
| 2026-05-01 | Closing price | 6.5 |
| 2026-05-04 | Closing price | 6.489999771118164 |
| 2026-05-05 | Closing price | 6.650000095367432 |
| 2026-05-06 | Closing price | 5.849999904632568 |
| 2026-05-07 | Closing price | 5.650000095367432 |
| 2026-05-08 | Closing price | 5.78000020980835 |
| 2026-05-11 | Closing price | 5.820000171661377 |
| 2026-05-12 | Closing price | 6.099999904632568 |
| 2026-05-13 | Closing price | 5.929999828338623 |
| 2026-05-14 | Closing price | 6.010000228881836 |
| 2026-05-15 | Closing price | 6.170000076293945 |
| 2026-05-18 | Closing price | 6.300000190734863 |
| 2026-05-19 | Closing price | 6.28000020980835 |
| 2026-05-20 | Closing price | 6.130000114440918 |
| 2026-05-21 | Closing price | 5.949999809265137 |
| 2026-05-22 | Closing price | 6.019999980926514 |
| 2026-05-26 | Closing price | 5.809999942779541 |
| 2026-05-27 | Closing price | 5.679999828338623 |
| 2026-05-28 | Closing price | 5.789999961853027 |
| 2026-05-29 | Closing price | 5.630000114440918 |
| 2026-06-01 | Closing price | 5.829999923706055 |
| 2026-06-02 | Closing price | 5.889999866485596 |
| 2026-06-03 | Closing price | 5.940000057220459 |
| 2026-06-04 | Closing price | 5.980000019073486 |
| 2026-06-05 | Closing price | 5.659999847412109 |
| 2026-06-08 | Closing price | 5.800000190734863 |
| 2026-06-09 | Closing price | 5.650000095367432 |
| 2026-06-10 | Closing price | 5.789999961853027 |
| 2026-06-11 | Closing price | 5.800000190734863 |
| 2026-06-12 | Closing price | 5.760000228881836 |
| 2026-06-15 | Closing price | 5.590000152587891 |
| 2026-06-16 | Closing price | 5.550000190734863 |
| 2026-06-17 | Closing price | 5.519999980926514 |
| 2026-06-18 | Closing price | 5.489999771118164 |
| 2026-06-22 | Closing price | 5.489999771118164 |
| 2026-06-23 | Closing price | 5.599999904632568 |
| 2026-06-24 | Closing price | 5.449999809265137 |
| 2026-06-25 | Closing price | 5.650000095367432 |
| 2026-06-26 | Closing price | 5.650000095367432 |
| 2026-06-29 | Closing price | 5.739999771118164 |
| 2026-06-30 | Closing price | 5.650000095367432 |
| 2026-07-01 | Closing price | 5.610000133514404 |
| 2026-07-02 | Closing price | 5.539999961853027 |
| 2026-07-06 | Closing price | 5.460000038146973 |
| 2026-07-07 | Closing price | 5.539999961853027 |
| 2026-07-08 | Closing price | 5.739999771118164 |
| 2026-07-09 | Closing price | 5.650000095367432 |
| 2026-07-10 | Closing price | 5.570000171661377 |
| 2026-07-13 | Closing price | 6.019999980926514 |
| 2026-07-14 | Closing price | 6.110000133514404 |
| 2026-07-15 | Closing price | 6.260000228881836 |
| 2026-07-16 | Closing price | 6.110000133514404 |
| 2026-07-17 | Closing price | 6.349999904632568 |
| 2026-07-20 | Closing price | 6.400000095367432 |
| 2026-07-21 | Closing price | 6.409999847412109 |
| 2026-07-22 | Closing price | 6.650000095367432 |
| 2026-07-23 | Closing price | 6.630000114440918 |
| 2026-07-24 | Closing price | 6.510000228881836 |
| 2026-07-27 | Closing price | 6.179999828338623 |
| 2026-07-28 | Closing price | 6.150000095367432 |
| 2026-07-29 | Closing price | 6.269999980926514 |
| 2026-07-30 | Closing price | 6.329999923706055 |
| 2026-07-31 | Closing price | 6.340000152587891 |
| 2026-08-03 | Closing price | 6.150000095367432 |
| 2026-08-04 | Closing price | 5.940000057220459 |
| 2026-08-05 | Closing price | 5.849999904632568 |
| 2026-08-06 | Closing price | 6.429999828338623 |
| 2026-08-07 | Closing price | 6.150000095367432 |
| 2026-08-10 | Closing price | 6.489999771118164 |
| 2026-08-11 | Closing price | 6.650000095367432 |
| 2026-08-12 | Closing price | 7.099999904632568 |
| 2026-08-13 | Closing price | 6.809999942779541 |
| 2026-08-14 | Closing price | 6.940000057220459 |
| 2026-08-17 | Closing price | 6.449999809265137 |
| 2026-08-18 | Closing price | 6.389999866485596 |
| 2026-08-19 | Closing price | 6.179999828338623 |
| 2026-08-20 | Closing price | 6.369999885559082 |
| 2026-08-21 | Closing price | 6.449999809265137 |
| 2026-08-24 | Closing price | 6.360000133514404 |
| 2026-08-25 | Closing price | 6.21999979019165 |
| 2026-08-26 | Closing price | 6.119999885559082 |
| 2026-08-27 | Closing price | 6.150000095367432 |
| 2026-08-28 | Closing price | 6.059999942779541 |
| 2026-08-31 | Closing price | 6.159999847412109 |
| 2026-09-01 | Closing price | 6.289999961853027 |
| 2026-09-02 | Closing price | 6.170000076293945 |
| 2026-09-03 | Closing price | 6.199999809265137 |
| 2026-09-04 | Closing price | 6.159999847412109 |
| 2026-09-08 | Closing price | 6.230000019073486 |
| 2026-09-09 | Closing price | 6.389999866485596 |
| 2026-09-10 | Closing price | 6.25 |
| 2026-09-11 | Closing price | 6.519999980926514 |
| 2026-09-14 | Closing price | 6.619999885559082 |
| 2026-09-15 | Closing price | 6.929999828338623 |
| 2026-09-16 | Closing price | 6.489999771118164 |
| 2026-09-17 | Closing price | 6.659999847412109 |
| 2026-09-18 | Closing price | 6.659999847412109 |
| 2026-09-21 | Closing price | 6.480000019073486 |
| 2026-09-22 | Closing price | 6.309999942779541 |
| 2026-09-23 | Closing price | 6.079999923706055 |
| 2026-09-24 | Closing price | 6.179999828338623 |
| 2026-09-25 | Closing price | 5.869999885559082 |
| 2026-09-28 | Closing price | 5.760000228881836 |
| 2026-09-29 | Closing price | 5.639999866485596 |
| 2026-09-30 | Closing price | 5.650000095367432 |
| 2026-10-01 | Closing price | 5.590000152587891 |
| 2026-10-02 | Closing price | 5.800000190734863 |
| 2026-10-05 | Closing price | 5.989999771118164 |
| 2026-10-06 | Closing price | 6.210000038146973 |
| 2026-10-07 | Closing price | 6.139999866485596 |
| 2026-10-08 | Closing price | 6.260000228881836 |
| 2026-10-09 | Closing price | 6.349999904632568 |
| 2026-10-12 | Closing price | 6.340000152587891 |
| 2026-10-13 | Closing price | 6.78000020980835 |
| 2026-10-14 | Closing price | 6.510000228881836 |
| 2026-10-15 | Closing price | 6.449999809265137 |
| 2026-10-16 | Closing price | 6.570000171661377 |
| 2026-10-19 | Closing price | 6.579999923706055 |
| 2026-10-20 | Closing price | 6.670000076293945 |
| 2026-10-21 | Closing price | 6.860000133514404 |
| 2026-10-22 | Closing price | 6.670000076293945 |
| 2026-10-23 | Closing price | 6.980000019073486 |
| 2026-10-26 | Closing price | 7.0 |
| 2026-10-27 | Closing price | 6.78000020980835 |
| 2026-10-28 | Closing price | 6.940000057220459 |
| 2026-10-29 | Closing price | 6.800000190734863 |
| 2026-10-30 | Closing price | 6.699999809265137 |
| 2026-11-02 | Closing price | 6.150000095367432 |
| 2026-11-03 | Closing price | 6.170000076293945 |
| 2026-11-04 | Closing price | 5.659999847412109 |
| 2026-11-05 | Closing price | 5.480000019073486 |
| 2026-11-06 | Closing price | 5.599999904632568 |
| 2026-11-09 | Closing price | 7.730000019073486 |
| 2026-11-10 | Closing price | 7.679999828338623 |
| 2026-11-11 | Closing price | 7.699999809265137 |
| 2026-11-12 | Closing price | 7.730000019073486 |
| 2026-11-13 | Closing price | 7.739999771118164 |
| 2026-11-16 | Closing price | 7.699999809265137 |
| 2026-11-17 | Closing price | 7.710000038146973 |
On the portal's model the share trades 36% above fair value
On the portal's model, which re-prices EBITDA at current commodity prices at the target EV/EBITDA, fair value is 36% below the current market price. This is our own estimate, not a market consensus.
The model relies on the current WTI spot of USD 84.2, below the reported-period average of USD 85.4. At that price the company's EBITDA will be below the reported figure, and the gap with the market's valuation will persist.
The LTM EV/EBITDA of 34.2 in itself shows the market is pricing in a profit recovery. If EBITDA does not grow, the share will adjust towards fair value.
Valuation on the latest reported figures
| Metric | Value |
|---|---|
| Market cap | 0.97 bn USD |
| EV/EBITDA (LTM) | 34.2 |
| P/B | 1.61 |
| Net debt / EBITDA (LTM) | 12.36 |
| Operating cash flow (LTM) | 0.11 bn |
| ROE | -5.6% |
Net profit by quarter
| Period | Measure | bn USD |
|---|---|---|
| Q4 2024 | Net profit | 0.056182 |
| Q2 2025 | Net profit | 0.035237000000000004 |
| Q3 2025 | Net profit | −0.0063490000000000005 |
| Q4 2025 | Net profit | −0.006207 |
| Q1 2026 | Net profit | −0.053066 |
| Q2 2026 | Net profit | 0.038452 |
| Q3 2026 | Net profit | −0.014915 |
Bottom line
The report's strength remains revenue: USD 217.3m, up 112.2% year on year, an acceleration from 23.5% in the second quarter. But EBITDA rose only 55.6% to USD 25.0m, the margin compressed to 11.5% from 15.7%, and at year-ago volumes and costs our calculation puts EBITDA at USD 46.8m. The net loss of USD 14.9m and operating loss of USD 8.8m show the company does not earn at the operating level. Leverage of 12.36x LTM EBITDA and an EV/EBITDA of 34.2 leave no cushion. Our conclusion: the share is rather unattractive – on the portal's model its upside to fair value is minus 36%. Our view: the share is rather unattractive at the current price; upside on the portal model -36%.