GeoPark: Brent rose 34.2% but EBITDA fell 83.8% – the price never reached the P&L
Contents
On 11 November GeoPark released its third-quarter 2026 results. The average Brent price in the period was 91.3 dollars against 68 dollars a year earlier (+34.2%), revenue rose 22.0% to 152.6 million dollars, but EBITDA fell 83.8% to 11.1 million and net profit dropped 58.4% to 6.6 million. At the year-ago volumes and costs and current prices, our calculation puts EBITDA at 108.8 million dollars – the report is 97.7 million below that, and the gap sits in volumes, the realised price against the benchmark and unit costs. Our conclusion: rather unattractive – the EV/EBITDA multiple of 4.6 is 78% above its own three-year average of 2.6, and the premium to history is justified by neither earnings nor the dividend. Our view: the share is rather unattractive at the current price; no portal model for this share; EV/EBITDA 4.6 against a 3-year average of 2.6, a 78% premium to its history.
Our view: is there upside
Our view in numbers
| Metric | Our read |
|---|---|
| Verdict | Rather unattractive |
| Upside on the portal model | no portal model for this share |
| EV/EBITDA now and 3-year average | 4.6 vs 2.6 – a 78% premium to its history |
| Dividend yield, 12m | 0.8% |
| Net debt / EBITDA | 1.89 – moderate leverage |
| Strongest case for | The portal spot model at current prices gives annual EBITDA of 194.3 million dollars against 148.4 million over the last twelve months – a rise of 30.9%, and EV/EBITDA on that base is 4.5. |
| Strongest case against | EV/EBITDA of 4.6 is 78% above its own three-year average of 2.6, while quarterly EBITDA fell 83.8% to 11.1 million dollars – the premium to history has not been earned. |
| What would change the view | The verdict would improve one step if quarterly EBITDA returned above 70 million dollars with Brent around 90, and would worsen if Brent fell below 80 dollars with current unit costs. |
Key takeaways
— Brent rose 34.2% year on year, but revenue added only 22.0% – volumes and realisations ate the price
— At the year-ago volumes and costs, our calculation puts EBITDA at 108.8 million dollars; the report delivered 11.1 million – a 97.7 million gap
— The EBITDA margin collapsed from 54.8% to 7.3% with oil higher – so the cause is unit costs and one-offs
— Net debt of 386.6 million dollars is 1.89 times trailing-twelve-month EBITDA, and a higher Brent does not reduce it
— At today's prices the portal spot model gives annual EBITDA of 194.3 million against 148.4 million over the last twelve months
— A dividend yield of 0.82% does not cover inflation – the payout is no argument for the share
— EV/EBITDA of 4.6 against its own three-year average of 2.6 – a 78% premium that has not been earned
Key figures, USD bn
| Metric | Q3 2025 | Q3 2026 | Change |
|---|---|---|---|
| Revenue | 0.13 | 0.15 | +22.0% |
| EBITDA | 0.07 | 0.01 | -83.8% |
| Operating profit | 0.03 | 0.05 | +48.5% |
| Net profit | 0.02 | 0.01 | -58.4% |
| Operating cash flow | 0.02 | 0.02 | -21.8% |
| Capex | 0.02 | — | — |
| EBITDA margin | 54.8% | 7.3% | -47.5 pp |
| Net margin | 12.7% | 4.3% | -8.4 pp |
Brent rose 34.2% year on year, but revenue added only 22.0% – volumes and realisations ate the price
The average Brent price in the third quarter of 2026 was 91.3 dollars a barrel against 68 dollars a year earlier – a rise of 34.2%. Against the previous quarter the price fell 5.6% from 96.8 dollars, and spot on 11 November stands at 91.8 dollars, just 0.6% above the period average. Oil generates 95% of GeoPark's revenue, so this backdrop should have pushed the top line up.
Revenue rose 22.0% to 152.6 million dollars, lagging the price by more than 12 percentage points. Henry Hub gas fell 6.2% to 2.893 dollars, but it accounts for only 5% of sales and cannot explain the shortfall. The rest of the gap is volumes and the realised price against the benchmark: with the same number of barrels and the same discount to Brent, revenue would have grown faster.
The slowdown also shows in the quarterly dynamics: in the second quarter of 2026 revenue grew 54.0% year on year, in the third – 22.0%. The deceleration coincided with oil falling 5.6% against the previous quarter, but that alone is not enough: the second-quarter base was low, and the comparison effect worked the other way.
Commodity prices: period average and now
| Benchmark | Year ago | Q3 2026 | YoY | Spot 2026-11-11 |
|---|---|---|---|---|
| Brent, USD | 68,0 | 91,3 | +34,2% | 91,8 |
| Henry Hub, USD | 3,08 | 2,89 | -6,2% | 3,31 |
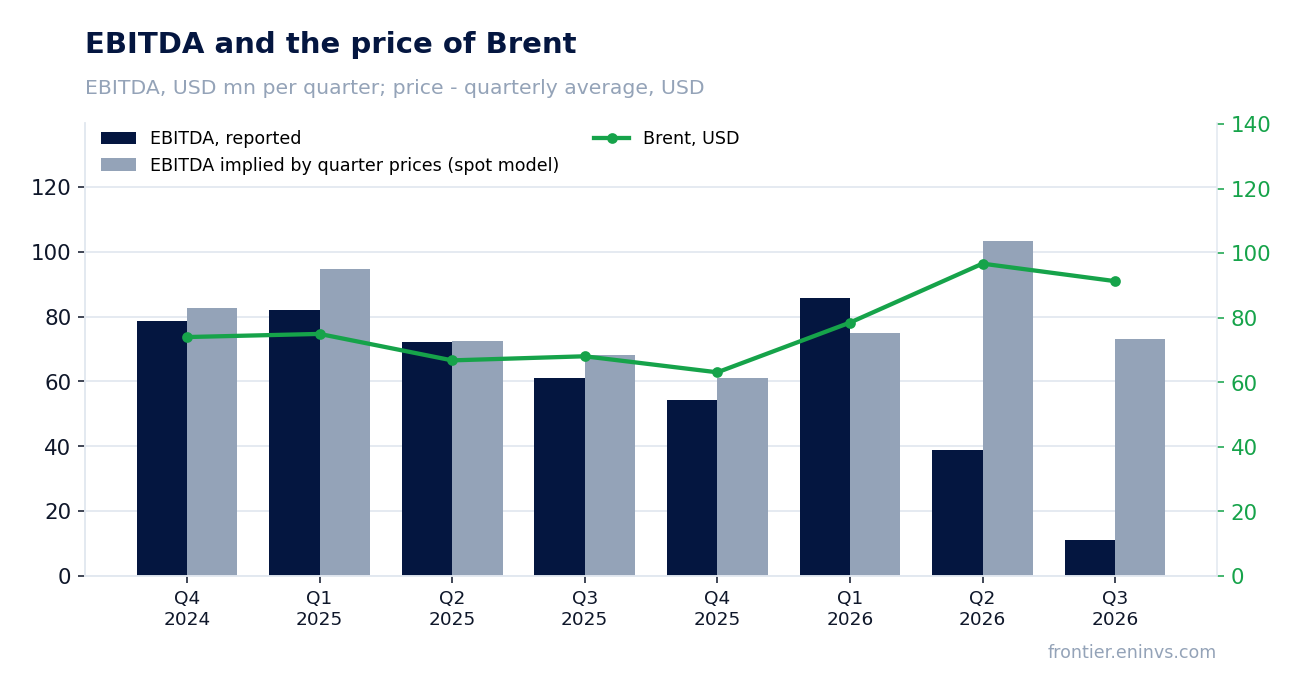
At the year-ago volumes and costs, our calculation puts EBITDA at 108.8 million dollars; the report delivered 11.1 million – a 97.7 million gap
Taking the volumes and non-commodity costs of the third quarter of 2025 and substituting only current prices gives revenue of 165.3 million dollars and EBITDA of 108.8 million. The report delivered 152.6 million of revenue and 11.1 million of EBITDA: 12.7 million and 97.7 million below the calculation respectively. In other words, the price worked for the company and everything else worked against it.
The gap sits almost entirely in EBITDA, not revenue: a 12.7 million shortfall at the top line turns into 97.7 million at the operating line. That happens when the realised price falls against the benchmark or unit costs rise – every dollar a barrel hits EBITDA harder than revenue. The report does not name the causes, and we do not substitute our own.
The portal's spot model, re-priced from the average of the previous four quarters, expected EBITDA of 73.3 million dollars and revenue of 162.9 million. The actual came in 84.8% below the model on EBITDA and 6.3% below on revenue. The model's deviation in the previous four periods was +0.7%, -71.2%, +7.8% and -62.3% – it has already missed badly twice, but this is the largest miss yet.
What the prices implied and what the company earned
| Base (Q3 2025) | Implied at period prices | Reported | Reported vs implied | |
|---|---|---|---|---|
| Revenue, USD mn | 125,1 | 165,3 | 152,6 | -7,7% |
| EBITDA, USD mn | 68,6 | 108,8 | 11,1 | -89,8% |
| EBITDA, portal spot model, USD mn | — | 73,3 | 11,1 | -84,8% |
Revenue and EBITDA by quarter
| Period | Measure | bn USD |
|---|---|---|
| Q4 2024 | Revenue | 0.143714 |
| Q1 2025 | Revenue | 0.137 |
| Q2 2025 | Revenue | 0.119787 |
| Q3 2025 | Revenue | 0.125088 |
| Q4 2025 | Revenue | 0.116518 |
| Q1 2026 | Revenue | 0.128373 |
| Q2 2026 | Revenue | 0.1845 |
| Q3 2026 | Revenue | 0.15259999999999999 |
| Q4 2024 | EBITDA | 0.078702 |
| Q1 2025 | EBITDA | 0.082 |
| Q2 2025 | EBITDA | 0.07215600000000001 |
| Q3 2025 | EBITDA | 0.061054000000000004 |
| Q4 2025 | EBITDA | 0.05435299999999999 |
| Q1 2026 | EBITDA | 0.08574599999999999 |
| Q2 2026 | EBITDA | 0.039 |
| Q3 2026 | EBITDA | 0.0111 |
EBITDA margin
| Period | Measure | % |
|---|---|---|
| Q4 2024 | EBITDA margin | 54.8 |
| Q1 2025 | EBITDA margin | 59.9 |
| Q2 2025 | EBITDA margin | 60.2 |
| Q3 2025 | EBITDA margin | 48.8 |
| Q4 2025 | EBITDA margin | 46.6 |
| Q1 2026 | EBITDA margin | 66.8 |
| Q2 2026 | EBITDA margin | 21.1 |
| Q3 2026 | EBITDA margin | 7.3 |
The EBITDA margin collapsed from 54.8% to 7.3% with oil higher – so the cause is unit costs and one-offs
The EBITDA margin in the third quarter of 2026 was 7.3% against 54.8% a year earlier. With Brent 34.2% higher, such a move is impossible without rising unit costs: either cash cost per barrel increased or one-off charges landed in EBITDA. Operating profit was 48.1 million dollars – 4.3 times EBITDA, which is unusual and points to large items between the two lines.
The net margin fell from 12.7% to 4.3%, and net profit dropped 58.4% to 6.6 million dollars. The profit decline is milder than the EBITDA decline because items below the operating line – depreciation, interest and possibly FX – cushioned it. The report does not disclose their composition, and we limit ourselves to stating the fact.
For the shareholder this is the key question of the quarter: if the cost increase is permanent, even with Brent above 90 dollars the company will earn little. If the charges are one-off, the next quarter will show a margin recovery. There is no fourth-quarter data yet, and building a recovery into the valuation would be premature.
Net debt of 386.6 million dollars is 1.89 times trailing-twelve-month EBITDA, and a higher Brent does not reduce it
As of 30 September 2026 GeoPark's net debt was 386.6 million dollars, equal to 1.89 times trailing-twelve-month EBITDA. The level is moderate, but it is calculated on EBITDA of 204.8 million dollars for the same period – while third-quarter EBITDA was only 11.1 million. If the weak margin persists, the denominator will shrink quickly and 1.89 will become a much larger number.
Operating cash flow in the third quarter was 16.3 million dollars – positive but small relative to debt. Over the last twelve months the flow is 229.6 million dollars, which covers interest and production maintenance but leaves little room to reduce debt. At current prices the portal spot model puts net debt to EBITDA at 1.99 – slightly above the current level, because model annual EBITDA of 194.3 million dollars is below LTM.
Reserve life at the current production rate is 12.1 years. That means the company can sustain output without large new projects, but it has nowhere to grow: it must drill every year just to hold the volume, and capex will absorb cash flow.
At today's prices the portal spot model gives annual EBITDA of 194.3 million against 148.4 million over the last twelve months
The portal spot model re-prices the trailing-twelve-month base at current prices. With Brent at 91.8 dollars and Henry Hub at 3.31 dollars, annual EBITDA is estimated at 194.3 million dollars against 148.4 million on the model for the last twelve months – a rise of 30.9%. This is not company guidance but our estimate of price sensitivity.
On that EBITDA, EV/EBITDA is 4.5 and net debt to EBITDA is 1.99. So at current prices the share trades at 4.5 times annual EBITDA, closer to the historical average of 2.6 than the LTM multiple of 4.6. But even 4.5 is a premium to the three-year average, and it rests only on the assumption that the margin recovers to normal.
The key price for the verdict is Brent. At 91.8 dollars the model gives 194.3 million of EBITDA; if Brent returns to the 68 dollars of a year ago, EBITDA will fall roughly in proportion and the multiple will rise. Spot is now just 0.6% above the period average, so the market already sees the current price level.
Valuation vs its own history
now vs the 3-year average
| Period | Measure | × |
|---|---|---|
| EV/EBITDA | Now | 4.5608542301381965 |
| EV/EBITDA | 3-year average | 2.5636056726294276 |
A dividend yield of 0.82% does not cover inflation – the payout is no argument for the share
GeoPark's dividend yield over the last twelve months is 0.82% on the current price. With a market capitalisation of 480.9 million dollars that is about 3.9 million of payouts – a small sum for a company with 386.6 million of net debt. The yield is comparable neither with the key rate nor with long-bond yields, and as an argument for the share the dividend does not work.
We do not give a payout estimate for the current year: the facts contain neither a dividend policy nor a calculation base, and without them any estimate would be invention. It is clear only that with quarterly EBITDA of 11.1 million dollars and net debt of 386.6 million, the company is unlikely to raise payouts – it will more likely direct cash to debt service and drilling.
What could reduce the payout: a further fall in the margin, higher capex to sustain production and the need to refinance debt at high rates. What could increase it: an EBITDA recovery with Brent above 90 dollars. Neither scenario dominates yet, and the dividend remains an insignificant factor.
Share price, three years
close, last point 2026-11-10
| Period | Measure | USD per share |
|---|---|---|
| 2025-11-10 | Closing price | 8.100000381469727 |
| 2025-11-11 | Closing price | 8.3100004196167 |
| 2025-11-12 | Closing price | 8.029999732971191 |
| 2025-11-13 | Closing price | 7.889999866485596 |
| 2025-11-14 | Closing price | 7.900000095367432 |
| 2025-11-17 | Closing price | 7.710000038146973 |
| 2025-11-18 | Closing price | 7.78000020980835 |
| 2025-11-19 | Closing price | 8.010000228881836 |
| 2025-11-20 | Closing price | 7.789999961853027 |
| 2025-11-21 | Closing price | 7.699999809265137 |
| 2025-11-24 | Closing price | 7.599999904632568 |
| 2025-11-25 | Closing price | 7.920000076293945 |
| 2025-11-26 | Closing price | 8.0600004196167 |
| 2025-11-28 | Closing price | 8.15999984741211 |
| 2025-12-01 | Closing price | 8.270000457763672 |
| 2025-12-02 | Closing price | 8.140000343322754 |
| 2025-12-03 | Closing price | 8.289999961853027 |
| 2025-12-04 | Closing price | 8.40999984741211 |
| 2025-12-05 | Closing price | 8.25 |
| 2025-12-08 | Closing price | 8.149999618530273 |
| 2025-12-09 | Closing price | 7.480000019073486 |
| 2025-12-10 | Closing price | 7.320000171661377 |
| 2025-12-11 | Closing price | 7.210000038146973 |
| 2025-12-12 | Closing price | 7.170000076293945 |
| 2025-12-15 | Closing price | 7.199999809265137 |
| 2025-12-16 | Closing price | 7.039999961853027 |
| 2025-12-17 | Closing price | 7.070000171661377 |
| 2025-12-18 | Closing price | 7.179999828338623 |
| 2025-12-19 | Closing price | 7.090000152587891 |
| 2025-12-22 | Closing price | 7.179999828338623 |
| 2025-12-23 | Closing price | 7.260000228881836 |
| 2025-12-24 | Closing price | 7.260000228881836 |
| 2025-12-26 | Closing price | 7.269999980926514 |
| 2025-12-29 | Closing price | 7.320000171661377 |
| 2025-12-30 | Closing price | 7.369999885559082 |
| 2025-12-31 | Closing price | 7.409999847412109 |
| 2026-01-02 | Closing price | 7.289999961853027 |
| 2026-01-05 | Closing price | 7.090000152587891 |
| 2026-01-06 | Closing price | 7.010000228881836 |
| 2026-01-07 | Closing price | 7.019999980926514 |
| 2026-01-08 | Closing price | 7.159999847412109 |
| 2026-01-09 | Closing price | 7.150000095367432 |
| 2026-01-12 | Closing price | 7.289999961853027 |
| 2026-01-13 | Closing price | 7.489999771118164 |
| 2026-01-14 | Closing price | 7.760000228881836 |
| 2026-01-15 | Closing price | 7.630000114440918 |
| 2026-01-16 | Closing price | 7.619999885559082 |
| 2026-01-20 | Closing price | 7.449999809265137 |
| 2026-01-21 | Closing price | 7.940000057220459 |
| 2026-01-22 | Closing price | 7.769999980926514 |
| 2026-01-23 | Closing price | 8.079999923706055 |
| 2026-01-26 | Closing price | 8.039999961853027 |
| 2026-01-27 | Closing price | 8.380000114440918 |
| 2026-01-28 | Closing price | 8.430000305175781 |
| 2026-01-29 | Closing price | 8.550000190734863 |
| 2026-01-30 | Closing price | 8.479999542236328 |
| 2026-02-02 | Closing price | 8.109999656677246 |
| 2026-02-03 | Closing price | 8.0600004196167 |
| 2026-02-04 | Closing price | 8.34000015258789 |
| 2026-02-05 | Closing price | 8.170000076293945 |
| 2026-02-06 | Closing price | 8.319999694824219 |
| 2026-02-09 | Closing price | 8.449999809265137 |
| 2026-02-10 | Closing price | 8.399999618530273 |
| 2026-02-11 | Closing price | 8.649999618530273 |
| 2026-02-12 | Closing price | 8.210000038146973 |
| 2026-02-13 | Closing price | 8.239999771118164 |
| 2026-02-17 | Closing price | 8.109999656677246 |
| 2026-02-18 | Closing price | 8.300000190734863 |
| 2026-02-19 | Closing price | 8.569999694824219 |
| 2026-02-20 | Closing price | 8.600000381469727 |
| 2026-02-23 | Closing price | 8.329999923706055 |
| 2026-02-24 | Closing price | 8.399999618530273 |
| 2026-02-25 | Closing price | 8.380000114440918 |
| 2026-02-26 | Closing price | 8.520000457763672 |
| 2026-02-27 | Closing price | 8.3100004196167 |
| 2026-03-02 | Closing price | 8.5 |
| 2026-03-03 | Closing price | 8.270000457763672 |
| 2026-03-04 | Closing price | 8.420000076293945 |
| 2026-03-05 | Closing price | 8.8100004196167 |
| 2026-03-06 | Closing price | 8.619999885559082 |
| 2026-03-09 | Closing price | 8.739999771118164 |
| 2026-03-10 | Closing price | 8.359999656677246 |
| 2026-03-11 | Closing price | 8.6899995803833 |
| 2026-03-12 | Closing price | 8.920000076293945 |
| 2026-03-13 | Closing price | 8.770000457763672 |
| 2026-03-16 | Closing price | 9.149999618530273 |
| 2026-03-17 | Closing price | 9.760000228881836 |
| 2026-03-18 | Closing price | 9.90999984741211 |
| 2026-03-19 | Closing price | 10.1899995803833 |
| 2026-03-20 | Closing price | 9.800000190734863 |
| 2026-03-23 | Closing price | 9.529999732971191 |
| 2026-03-24 | Closing price | 9.699999809265137 |
| 2026-03-25 | Closing price | 9.460000038146973 |
| 2026-03-26 | Closing price | 9.210000038146973 |
| 2026-03-27 | Closing price | 9.619999885559082 |
| 2026-03-30 | Closing price | 9.710000038146973 |
| 2026-03-31 | Closing price | 9.5 |
| 2026-04-01 | Closing price | 8.729999542236328 |
| 2026-04-02 | Closing price | 8.850000381469727 |
| 2026-04-06 | Closing price | 8.8100004196167 |
| 2026-04-07 | Closing price | 8.5600004196167 |
| 2026-04-08 | Closing price | 8.40999984741211 |
| 2026-04-09 | Closing price | 8.149999618530273 |
| 2026-04-10 | Closing price | 9.399999618530273 |
| 2026-04-13 | Closing price | 9.949999809265137 |
| 2026-04-14 | Closing price | 9.90999984741211 |
| 2026-04-15 | Closing price | 9.140000343322754 |
| 2026-04-16 | Closing price | 9.359999656677246 |
| 2026-04-17 | Closing price | 8.819999694824219 |
| 2026-04-20 | Closing price | 8.8100004196167 |
| 2026-04-21 | Closing price | 9.109999656677246 |
| 2026-04-22 | Closing price | 9.229999542236328 |
| 2026-04-23 | Closing price | 9.109999656677246 |
| 2026-04-24 | Closing price | 9.050000190734863 |
| 2026-04-27 | Closing price | 9.239999771118164 |
| 2026-04-28 | Closing price | 9.25 |
| 2026-04-29 | Closing price | 9.510000228881836 |
| 2026-04-30 | Closing price | 9.680000305175781 |
| 2026-05-01 | Closing price | 9.479999542236328 |
| 2026-05-04 | Closing price | 9.729999542236328 |
| 2026-05-05 | Closing price | 9.819999694824219 |
| 2026-05-06 | Closing price | 9.40999984741211 |
| 2026-05-07 | Closing price | 9.149999618530273 |
| 2026-05-08 | Closing price | 9.329999923706055 |
| 2026-05-11 | Closing price | 9.899999618530273 |
| 2026-05-12 | Closing price | 9.960000038146973 |
| 2026-05-13 | Closing price | 9.680000305175781 |
| 2026-05-14 | Closing price | 9.729999542236328 |
| 2026-05-15 | Closing price | 9.579999923706055 |
| 2026-05-18 | Closing price | 10.390000343322754 |
| 2026-05-19 | Closing price | 10.170000076293945 |
| 2026-05-20 | Closing price | 9.819999694824219 |
| 2026-05-21 | Closing price | 9.710000038146973 |
| 2026-05-22 | Closing price | 9.729999542236328 |
| 2026-05-26 | Closing price | 9.970000267028809 |
| 2026-05-27 | Closing price | 9.739999771118164 |
| 2026-05-28 | Closing price | 9.84000015258789 |
| 2026-05-29 | Closing price | 10.25 |
| 2026-06-01 | Closing price | 11.34000015258789 |
| 2026-06-02 | Closing price | 11.779999732971191 |
| 2026-06-03 | Closing price | 11.1899995803833 |
| 2026-06-04 | Closing price | 11.079999923706055 |
| 2026-06-05 | Closing price | 10.569999694824219 |
| 2026-06-08 | Closing price | 10.760000228881836 |
| 2026-06-09 | Closing price | 10.84000015258789 |
| 2026-06-10 | Closing price | 10.949999809265137 |
| 2026-06-11 | Closing price | 11.0600004196167 |
| 2026-06-12 | Closing price | 11.199999809265137 |
| 2026-06-15 | Closing price | 10.1899995803833 |
| 2026-06-16 | Closing price | 10.390000343322754 |
| 2026-06-17 | Closing price | 10.329999923706055 |
| 2026-06-18 | Closing price | 10.140000343322754 |
| 2026-06-22 | Closing price | 9.890000343322754 |
| 2026-06-23 | Closing price | 9.670000076293945 |
| 2026-06-24 | Closing price | 9.239999771118164 |
| 2026-06-25 | Closing price | 9.119999885559082 |
| 2026-06-26 | Closing price | 9.229999542236328 |
| 2026-06-29 | Closing price | 9.199999809265137 |
| 2026-06-30 | Closing price | 9.100000381469727 |
| 2026-07-01 | Closing price | 9.050000190734863 |
| 2026-07-02 | Closing price | 9.069999694824219 |
| 2026-07-06 | Closing price | 9.350000381469727 |
| 2026-07-07 | Closing price | 9.619999885559082 |
| 2026-07-08 | Closing price | 9.949999809265137 |
| 2026-07-09 | Closing price | 9.819999694824219 |
| 2026-07-10 | Closing price | 9.890000343322754 |
| 2026-07-13 | Closing price | 10.0 |
| 2026-07-14 | Closing price | 10.350000381469727 |
| 2026-07-15 | Closing price | 9.859999656677246 |
| 2026-07-16 | Closing price | 9.520000457763672 |
| 2026-07-17 | Closing price | 9.680000305175781 |
| 2026-07-20 | Closing price | 9.699999809265137 |
| 2026-07-21 | Closing price | 10.149999618530273 |
| 2026-07-22 | Closing price | 10.3100004196167 |
| 2026-07-23 | Closing price | 10.260000228881836 |
| 2026-07-24 | Closing price | 10.0 |
| 2026-07-27 | Closing price | 9.479999542236328 |
| 2026-07-28 | Closing price | 9.260000228881836 |
| 2026-07-29 | Closing price | 9.390000343322754 |
| 2026-07-30 | Closing price | 9.59000015258789 |
| 2026-07-31 | Closing price | 9.75 |
| 2026-08-03 | Closing price | 9.5 |
| 2026-08-04 | Closing price | 9.380000114440918 |
| 2026-08-05 | Closing price | 9.489999771118164 |
| 2026-08-06 | Closing price | 9.510000228881836 |
| 2026-08-07 | Closing price | 9.430000305175781 |
| 2026-08-10 | Closing price | 9.65999984741211 |
| 2026-08-11 | Closing price | 9.3100004196167 |
| 2026-08-12 | Closing price | 9.270000457763672 |
| 2026-08-13 | Closing price | 9.369999885559082 |
| 2026-08-14 | Closing price | 9.470000267028809 |
| 2026-08-17 | Closing price | 9.59000015258789 |
| 2026-08-18 | Closing price | 9.369999885559082 |
| 2026-08-19 | Closing price | 9.529999732971191 |
| 2026-08-20 | Closing price | 9.779999732971191 |
| 2026-08-21 | Closing price | 9.789999961853027 |
| 2026-08-24 | Closing price | 9.84000015258789 |
| 2026-08-25 | Closing price | 9.739999771118164 |
| 2026-08-26 | Closing price | 9.710000038146973 |
| 2026-08-27 | Closing price | 9.850000381469727 |
| 2026-08-28 | Closing price | 9.829999923706055 |
| 2026-08-31 | Closing price | 11.0 |
| 2026-09-01 | Closing price | 11.229999542236328 |
| 2026-09-02 | Closing price | 11.6899995803833 |
| 2026-09-03 | Closing price | 11.899999618530273 |
| 2026-09-04 | Closing price | 11.5600004196167 |
| 2026-09-08 | Closing price | 11.949999809265137 |
| 2026-09-09 | Closing price | 11.90999984741211 |
| 2026-09-10 | Closing price | 11.970000267028809 |
| 2026-09-11 | Closing price | 11.479999542236328 |
| 2026-09-14 | Closing price | 11.470000267028809 |
| 2026-09-15 | Closing price | 11.789999961853027 |
| 2026-09-16 | Closing price | 11.279999732971191 |
| 2026-09-17 | Closing price | 11.149999618530273 |
| 2026-09-18 | Closing price | 11.039999961853027 |
| 2026-09-21 | Closing price | 10.779999732971191 |
| 2026-09-22 | Closing price | 10.899999618530273 |
| 2026-09-23 | Closing price | 11.109999656677246 |
| 2026-09-24 | Closing price | 11.34000015258789 |
| 2026-09-25 | Closing price | 11.199999809265137 |
| 2026-09-28 | Closing price | 10.680000305175781 |
| 2026-09-29 | Closing price | 10.510000228881836 |
| 2026-09-30 | Closing price | 10.449999809265137 |
| 2026-10-01 | Closing price | 10.40999984741211 |
| 2026-10-02 | Closing price | 10.850000381469727 |
| 2026-10-05 | Closing price | 11.279999732971191 |
| 2026-10-06 | Closing price | 11.4399995803833 |
| 2026-10-07 | Closing price | 11.109999656677246 |
| 2026-10-08 | Closing price | 11.449999809265137 |
| 2026-10-09 | Closing price | 11.539999961853027 |
| 2026-10-12 | Closing price | 11.880000114440918 |
| 2026-10-13 | Closing price | 11.84000015258789 |
| 2026-10-14 | Closing price | 11.59000015258789 |
| 2026-10-15 | Closing price | 11.529999732971191 |
| 2026-10-16 | Closing price | 11.760000228881836 |
| 2026-10-19 | Closing price | 11.720000267028809 |
| 2026-10-20 | Closing price | 11.680000305175781 |
| 2026-10-21 | Closing price | 11.550000190734863 |
| 2026-10-22 | Closing price | 11.279999732971191 |
| 2026-10-23 | Closing price | 11.779999732971191 |
| 2026-10-26 | Closing price | 11.15999984741211 |
| 2026-10-27 | Closing price | 11.199999809265137 |
| 2026-10-28 | Closing price | 11.0 |
| 2026-10-29 | Closing price | 10.819999694824219 |
| 2026-10-30 | Closing price | 10.880000114440918 |
| 2026-11-02 | Closing price | 10.380000114440918 |
| 2026-11-03 | Closing price | 10.329999923706055 |
| 2026-11-04 | Closing price | 9.430000305175781 |
| 2026-11-05 | Closing price | 9.130000114440918 |
| 2026-11-06 | Closing price | 9.4399995803833 |
| 2026-11-09 | Closing price | 9.40999984741211 |
| 2026-11-10 | Closing price | 9.234999656677246 |
EV/EBITDA of 4.6 against its own three-year average of 2.6 – a 78% premium that has not been earned
On the trailing-twelve-month EV/EBITDA multiple the share trades at 4.6 against its own three-year average of 2.6 – a 78% premium. That means the market is paying almost twice what it has habitually paid for GeoPark's earnings over the past three years. Such a premium can only be justified by EBITDA growth, and in the third quarter EBITDA fell 83.8%.
The trailing P/E is 6.7 and ROE is 7.8%. For a commodity producer with 12.1 years of reserve life and a falling margin this is not cheap: LTM profit of 71.8 million dollars was earned at an average oil price only slightly above the current one, and quarterly profit has already fallen to 6.6 million.
Our conclusion rests on the multiple against history, not on the spot model: the model gives EBITDA of 194.3 million dollars and EV/EBITDA of 4.5, but that is an estimate conditional on a margin recovery that has not yet appeared. Until the margin returns to normal, the 78% premium to the three-year average is the main argument against the share.
Valuation on the latest reported figures
| Metric | Value |
|---|---|
| Market cap | 0.48 bn USD |
| P/E (LTM) | 6.7 |
| EV/EBITDA (LTM) | 4.6 |
| P/B | 1.96 |
| Net debt / EBITDA (LTM) | 1.89 |
| Operating cash flow (LTM) | 0.23 bn |
| ROE | 7.8% |
| Dividend yield (12m) | 0.8% |
| EV/EBITDA, 3-year average | 2.6 |
Net profit by quarter
| Period | Measure | bn USD |
|---|---|---|
| Q4 2024 | Net profit | 0.015344 |
| Q1 2025 | Net profit | 0.013079999999999998 |
| Q2 2025 | Net profit | −0.010335 |
| Q3 2025 | Net profit | 0.015855 |
| Q4 2025 | Net profit | 0.031067 |
| Q1 2026 | Net profit | 0.020183 |
| Q2 2026 | Net profit | 0.014 |
| Q3 2026 | Net profit | 0.0066 |
Bottom line
The strong side of the quarter was the price: Brent rose 34.2% year on year and revenue added 22.0% to 152.6 million dollars. But the price never reached EBITDA – it fell 83.8% to 11.1 million, the margin compressed from 54.8% to 7.3%, and by our calculation the company under-earned 97.7 million dollars relative to what the year-ago volumes and costs implied. Net debt of 386.6 million dollars is 1.89 times trailing-twelve-month EBITDA, the 0.82% dividend yield does not compensate for the risk, and EV/EBITDA of 4.6 is 78% above its own three-year average of 2.6. Our conclusion: rather unattractive – the 78% premium to history is justified by neither earnings nor the dividend. Our view: the share is rather unattractive at the current price; no portal model for this share; EV/EBITDA 4.6 against a 3-year average of 2.6, a 78% premium to its history.