Hudbay Minerals: copper and gold up by a third, yet the company earned far more than price alone implied
Contents

On 17 November Hudbay Minerals released its third-quarter 2026 results. The average copper price in the period was 14,408 dollars against 10,825 a year earlier (+33.1%), gold 4,268 against 3,459 dollars (+23.4%). At the year-ago volumes and costs those prices would have produced revenue of 440 million and EBITDA of 186.6 million dollars on our calculation, while the company reported revenue of 765.9 million and EBITDA of 412.1 million – revenue growth of +120.8% year on year, an acceleration from +17.7% a quarter earlier. Our conclusion: rather attractive – the portal model puts the upside to fair value at +25%, even though at EV/EBITDA of 5.3 the share trades 5% above its own three-year average of 5.1. Our view: the share is rather attractive at the current price; upside on the portal model +25%.
Our view: is there upside
Our view in numbers
| Metric | Our read |
|---|---|
| Verdict | Rather attractive |
| Upside on the portal model | +25% |
| How the model works | spot model: EBITDA re-priced to current commodity prices at the target EV/EBITDA, against market cap |
| EV/EBITDA now and 3-year average | 5.3 vs 5.1 – a 5% premium to its history |
| Dividend yield, 12m | 0.1% |
| Net debt / EBITDA | 0.03 – low leverage |
| Strongest case for | On the portal model the share trades 25% below fair value, and net debt of 50.0 million at a ratio to EBITDA of 0.03 poses no risk to a shareholder. |
| Strongest case against | EV/EBITDA of 5.3 stands 5% above the three-year average of 5.1, and at current prices EBITDA is 10.1% below LTM – there is almost no multiple cushion. |
| What would change the view | A return of copper to the reported-period average of 14,408 dollars would lift the verdict one step, while a sustained move below 13,000 dollars would lower it one step. |
Key takeaways
— Copper rose 33.1% and gold 23.4%, but price alone explains only 186.6 million of the 412.1 million dollars of EBITDA
— Revenue grew 120.8% with an acceleration from 17.7% a quarter earlier – price alone does not deliver that pace
— EBITDA margin rose to 53.8% from 26.9%, yet net profit fell 32.8% on a high year-ago base
— Leverage is almost absent: net debt of 50.0 million against trailing-twelve-month EBITDA of 1,449.9 million – a ratio of 0.03
— Operating cash flow of 214.9 million was almost entirely absorbed by capital expenditure of 217.5 million
— At today's prices EBITDA is put at 1,330.5 million against 1,480.4 million over the trailing twelve months – a thinner base ahead
— EV/EBITDA of 5.3 against a three-year average of 5.1 – a 5% premium, with almost no multiple cushion
Key figures, USD bn
| Metric | Q3 2025 | Q3 2026 | Change |
|---|---|---|---|
| Revenue | 0.35 | 0.77 | +120.8% |
| EBITDA | 0.09 | 0.41 | +341.2% |
| Operating profit | 0.01 | 0.29 | +2642.3% |
| Net profit | 0.22 | 0.15 | -32.8% |
| Operating cash flow | 0.11 | 0.21 | +89.3% |
| Capex | 0.11 | 0.22 | +97.0% |
| EBITDA margin | 26.9% | 53.8% | +26.9 pp |
| Net margin | 64.1% | 19.5% | -44.6 pp |
Copper rose 33.1% and gold 23.4%, but price alone explains only 186.6 million of the 412.1 million dollars of EBITDA
The average copper price in the reported quarter was 14,408 dollars against 10,825 a year earlier, up 33.1%. Against the previous quarter copper rose 5.3%. Gold averaged 4,268 dollars against 3,459 (+23.4%) but was 5.5% cheaper than in the previous quarter.
On 17 November copper trades at 13,307 dollars, 7.6% below the reported-period average, and gold at 3,867 dollars, 9.4% below. The prices that built this quarter's result no longer hold: the market has pulled back from July–September levels.
At the year-ago volumes and non-commodity costs, with only prices moving, revenue would have been 440 million dollars (a price effect of +93.2 million, +26.9%) and EBITDA 186.6 million on our calculation. That is less than half of the reported 412.1 million, so price alone cannot explain the quarter.
Commodity prices: period average and now
| Benchmark | Year ago | Q3 2026 | YoY | Spot 2026-11-17 |
|---|---|---|---|---|
| Copper, USD | 10 825 | 14 408 | +33,1% | 13 307 |
| Gold, USD | 3 459 | 4 268 | +23,4% | 3 867 |
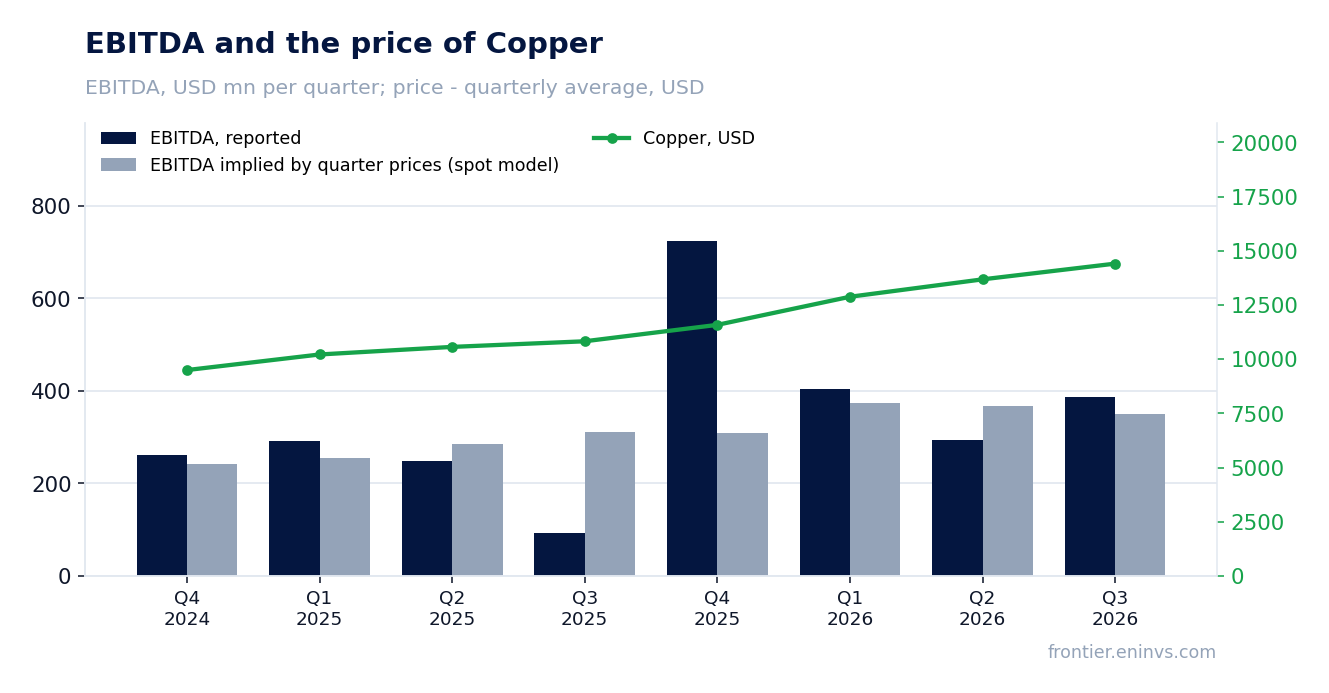
Revenue grew 120.8% with an acceleration from 17.7% a quarter earlier – price alone does not deliver that pace
Reported revenue was 765.9 million dollars against 346.8 million a year earlier, up 120.8%. A quarter earlier growth was 17.7%, so the pace accelerated. Against the previous quarter revenue added 21.5%.
At the previous quarter's volumes and costs, with only prices moving, revenue would have been 641 million (a price effect of +9.7 million, +1.5%) on our calculation. The reported 765.9 million is 124.9 million, or 19.5%, higher. Price does not explain that gap – its source lies in sales volumes, the realised price against the benchmark or one-off receipts, and the disclosure does not name them.
The portal's spot model, built from the average of the previous four quarters, expected revenue of 684.2 million; the actual figure is 11.9% above it. The model's deviation from actuals in the four preceding periods ranged from -69.9% to +19.5%, so on this issuer it errs widely and today's estimate is a reference point, not a precise forecast.
What the prices implied and what the company earned
| Base (Q3 2025) | Implied at period prices | Reported | Reported vs implied | |
|---|---|---|---|---|
| Revenue, USD mn | 346,8 | 440,0 | 765,9 | +74,1% |
| EBITDA, USD mn | 93,4 | 186,6 | 412,1 | +120,8% |
| EBITDA, portal spot model, USD mn | — | 349,3 | 412,1 | +18,0% |
Revenue and EBITDA by quarter
| Period | Measure | bn USD |
|---|---|---|
| Q4 2024 | Revenue | 0.5849 |
| Q1 2025 | Revenue | 0.5949 |
| Q2 2025 | Revenue | 0.5364 |
| Q3 2025 | Revenue | 0.3468 |
| Q4 2025 | Revenue | 0.7329 |
| Q1 2026 | Revenue | 0.7573 |
| Q2 2026 | Revenue | 0.6313 |
| Q3 2026 | Revenue | 0.7659 |
| Q4 2024 | EBITDA | 0.26039999999999996 |
| Q1 2025 | EBITDA | 0.2907 |
| Q2 2025 | EBITDA | 0.24860000000000002 |
| Q3 2025 | EBITDA | 0.09340000000000001 |
| Q4 2025 | EBITDA | 0.725 |
| Q1 2026 | EBITDA | 0.40340000000000004 |
| Q2 2026 | EBITDA | 0.2938 |
| Q3 2026 | EBITDA | 0.3875 |
EBITDA margin
| Period | Measure | % |
|---|---|---|
| Q4 2024 | EBITDA margin | 44.5 |
| Q1 2025 | EBITDA margin | 48.9 |
| Q2 2025 | EBITDA margin | 46.3 |
| Q3 2025 | EBITDA margin | 26.9 |
| Q4 2025 | EBITDA margin | 98.9 |
| Q1 2026 | EBITDA margin | 53.3 |
| Q2 2026 | EBITDA margin | 46.5 |
| Q3 2026 | EBITDA margin | 50.6 |
EBITDA margin rose to 53.8% from 26.9%, yet net profit fell 32.8% on a high year-ago base
Reported EBITDA was 412.1 million dollars against 93.4 million a year earlier (+341.2%), the margin 53.8% against 26.9%. Operating profit was 285.2 million. At the year-ago volumes and costs, prices would have produced EBITDA of 186.6 million on our calculation, so the actual figure is 225.5 million, or 120.8%, higher.
Net profit, by contrast, fell 32.8% to 149.5 million dollars and its margin dropped to 19.5% from 64.1%. The reason is the comparison base: a year earlier quarterly profit was 222.4 million on revenue of only 346.8 million, so something outside the operating result flowed into profit then. There is no such contribution now, which is why profit is lower on a far better operating picture.
The portal's spot model expected EBITDA of 349.3 million; the actual figure is 18.0% above it. Deviations from the model in the four preceding periods ranged from -69.9% to +19.5%, so here too the gap is not explained by price alone.
Leverage is almost absent: net debt of 50.0 million against trailing-twelve-month EBITDA of 1,449.9 million – a ratio of 0.03
At 30 September 2026 net debt stood at 50.0 million dollars. Against trailing-twelve-month EBITDA of 1,449.9 million that is a ratio of 0.03 – leverage is practically nil. The direction of change in this ratio is not in the facts, so we state the level only.
Operating cash flow for the quarter was 214.9 million dollars and capital expenditure 217.5 million. The flow went almost entirely into investment: the difference is negative and the quarter produced no free cash flow. For a producer this is a normal investment-phase picture, but it means output growth is funded from current revenue, not from new debt.
Over the trailing twelve months operating cash flow was 932.6 million dollars – the resource that covers both capital expenditure and dividends. With net debt of 50.0 million the balance sheet poses no risk to a shareholder even if prices fall.
Operating cash flow of 214.9 million was almost entirely absorbed by capital expenditure of 217.5 million
Capital expenditure for the quarter was 217.5 million dollars against 110.4 million a year earlier – almost double. It is the largest expense line of the period and it exceeded operating cash flow of 214.9 million.
For a shareholder this means the quarter added no cash to the balance sheet: all the EBITDA that reached cash flow went into construction and sustaining output. With net debt of 50.0 million the policy needs no external financing, but it leaves no free surplus either.
The trailing-twelve-month dividend yield is 0.1%, so payouts are symbolic. With capital expenditure above operating cash flow the company puts money into production rather than distribution, and until the investment phase ends there is no reason to expect higher payouts.
Valuation vs its own history
now vs the 3-year average
| Period | Measure | × |
|---|---|---|
| EV/EBITDA | Now | 5.349500414936761 |
| EV/EBITDA | 3-year average | 5.07956978306242 |
At today's prices EBITDA is put at 1,330.5 million against 1,480.4 million over the trailing twelve months – a thinner base ahead
On the portal's spot model, at today's copper and gold prices annual EBITDA would be 1,330.5 million dollars against 1,480.4 million over the trailing twelve months, 10.1% less. The reason is the price pullback: copper is 7.6% and gold 9.4% below the reported-period averages.
On that base EV/EBITDA at current prices is 5.8 and net debt to EBITDA 0.04. Even adjusted for lower prices the multiple stays around six, and debt does not affect the valuation.
For the share this matters more than the reported LTM: trailing-twelve-month earnings were made at past, higher prices, and starting from them overstates the base. The portal model, re-priced to current prices, puts the upside to fair value at +25%.
Share price, three years
close, last point 2026-11-16
| Period | Measure | USD per share |
|---|---|---|
| 2025-11-17 | Closing price | 15.329999923706055 |
| 2025-11-18 | Closing price | 15.109999656677246 |
| 2025-11-19 | Closing price | 15.479999542236328 |
| 2025-11-20 | Closing price | 14.579999923706055 |
| 2025-11-21 | Closing price | 14.899999618530273 |
| 2025-11-24 | Closing price | 15.710000038146973 |
| 2025-11-25 | Closing price | 15.760000228881836 |
| 2025-11-26 | Closing price | 16.59000015258789 |
| 2025-11-28 | Closing price | 16.959999084472656 |
| 2025-12-01 | Closing price | 16.860000610351562 |
| 2025-12-02 | Closing price | 16.440000534057617 |
| 2025-12-03 | Closing price | 17.389999389648438 |
| 2025-12-04 | Closing price | 17.34000015258789 |
| 2025-12-05 | Closing price | 17.479999542236328 |
| 2025-12-08 | Closing price | 17.360000610351562 |
| 2025-12-09 | Closing price | 17.56999969482422 |
| 2025-12-10 | Closing price | 18.25 |
| 2025-12-11 | Closing price | 18.6200008392334 |
| 2025-12-12 | Closing price | 18.68000030517578 |
| 2025-12-15 | Closing price | 18.850000381469727 |
| 2025-12-16 | Closing price | 18.56999969482422 |
| 2025-12-17 | Closing price | 18.989999771118164 |
| 2025-12-18 | Closing price | 18.969999313354492 |
| 2025-12-19 | Closing price | 19.270000457763672 |
| 2025-12-22 | Closing price | 19.719999313354492 |
| 2025-12-23 | Closing price | 19.940000534057617 |
| 2025-12-24 | Closing price | 19.860000610351562 |
| 2025-12-26 | Closing price | 20.219999313354492 |
| 2025-12-29 | Closing price | 19.40999984741211 |
| 2025-12-30 | Closing price | 19.899999618530273 |
| 2025-12-31 | Closing price | 19.850000381469727 |
| 2026-01-02 | Closing price | 20.100000381469727 |
| 2026-01-05 | Closing price | 21.299999237060547 |
| 2026-01-06 | Closing price | 21.43000030517578 |
| 2026-01-07 | Closing price | 21.190000534057617 |
| 2026-01-08 | Closing price | 21.110000610351562 |
| 2026-01-09 | Closing price | 21.559999465942383 |
| 2026-01-12 | Closing price | 22.540000915527344 |
| 2026-01-13 | Closing price | 22.510000228881836 |
| 2026-01-14 | Closing price | 23.09000015258789 |
| 2026-01-15 | Closing price | 22.760000228881836 |
| 2026-01-16 | Closing price | 22.5 |
| 2026-01-20 | Closing price | 24.690000534057617 |
| 2026-01-21 | Closing price | 24.049999237060547 |
| 2026-01-22 | Closing price | 24.110000610351562 |
| 2026-01-23 | Closing price | 24.969999313354492 |
| 2026-01-26 | Closing price | 25.43000030517578 |
| 2026-01-27 | Closing price | 26.239999771118164 |
| 2026-01-28 | Closing price | 27.079999923706055 |
| 2026-01-29 | Closing price | 26.90999984741211 |
| 2026-01-30 | Closing price | 23.68000030517578 |
| 2026-02-02 | Closing price | 24.100000381469727 |
| 2026-02-03 | Closing price | 26.260000228881836 |
| 2026-02-04 | Closing price | 25.549999237060547 |
| 2026-02-05 | Closing price | 23.5 |
| 2026-02-06 | Closing price | 24.729999542236328 |
| 2026-02-09 | Closing price | 25.90999984741211 |
| 2026-02-10 | Closing price | 25.389999389648438 |
| 2026-02-11 | Closing price | 26.43000030517578 |
| 2026-02-12 | Closing price | 25.389999389648438 |
| 2026-02-13 | Closing price | 26.100000381469727 |
| 2026-02-17 | Closing price | 25.190000534057617 |
| 2026-02-18 | Closing price | 24.93000030517578 |
| 2026-02-19 | Closing price | 24.739999771118164 |
| 2026-02-20 | Closing price | 24.979999542236328 |
| 2026-02-23 | Closing price | 26.059999465942383 |
| 2026-02-24 | Closing price | 27.799999237060547 |
| 2026-02-25 | Closing price | 27.709999084472656 |
| 2026-02-26 | Closing price | 28.030000686645508 |
| 2026-02-27 | Closing price | 28.329999923706055 |
| 2026-03-02 | Closing price | 26.739999771118164 |
| 2026-03-03 | Closing price | 24.940000534057617 |
| 2026-03-04 | Closing price | 24.799999237060547 |
| 2026-03-05 | Closing price | 23.040000915527344 |
| 2026-03-06 | Closing price | 22.290000915527344 |
| 2026-03-09 | Closing price | 22.5 |
| 2026-03-10 | Closing price | 23.030000686645508 |
| 2026-03-11 | Closing price | 22.510000228881836 |
| 2026-03-12 | Closing price | 21.850000381469727 |
| 2026-03-13 | Closing price | 20.729999542236328 |
| 2026-03-16 | Closing price | 21.139999389648438 |
| 2026-03-17 | Closing price | 21.209999084472656 |
| 2026-03-18 | Closing price | 19.8799991607666 |
| 2026-03-19 | Closing price | 18.649999618530273 |
| 2026-03-20 | Closing price | 18.079999923706055 |
| 2026-03-23 | Closing price | 18.850000381469727 |
| 2026-03-24 | Closing price | 18.950000762939453 |
| 2026-03-25 | Closing price | 20.020000457763672 |
| 2026-03-26 | Closing price | 18.81999969482422 |
| 2026-03-27 | Closing price | 19.479999542236328 |
| 2026-03-30 | Closing price | 19.049999237060547 |
| 2026-03-31 | Closing price | 20.899999618530273 |
| 2026-04-01 | Closing price | 22.0 |
| 2026-04-02 | Closing price | 21.639999389648438 |
| 2026-04-06 | Closing price | 21.739999771118164 |
| 2026-04-07 | Closing price | 21.84000015258789 |
| 2026-04-08 | Closing price | 23.780000686645508 |
| 2026-04-09 | Closing price | 23.469999313354492 |
| 2026-04-10 | Closing price | 24.329999923706055 |
| 2026-04-13 | Closing price | 24.40999984741211 |
| 2026-04-14 | Closing price | 25.219999313354492 |
| 2026-04-15 | Closing price | 24.8799991607666 |
| 2026-04-16 | Closing price | 24.920000076293945 |
| 2026-04-17 | Closing price | 25.8799991607666 |
| 2026-04-20 | Closing price | 25.670000076293945 |
| 2026-04-21 | Closing price | 23.850000381469727 |
| 2026-04-22 | Closing price | 24.690000534057617 |
| 2026-04-23 | Closing price | 24.020000457763672 |
| 2026-04-24 | Closing price | 24.350000381469727 |
| 2026-04-27 | Closing price | 24.40999984741211 |
| 2026-04-28 | Closing price | 22.979999542236328 |
| 2026-04-29 | Closing price | 22.459999084472656 |
| 2026-04-30 | Closing price | 23.110000610351562 |
| 2026-05-01 | Closing price | 22.799999237060547 |
| 2026-05-04 | Closing price | 21.770000457763672 |
| 2026-05-05 | Closing price | 22.350000381469727 |
| 2026-05-06 | Closing price | 24.0 |
| 2026-05-07 | Closing price | 23.850000381469727 |
| 2026-05-08 | Closing price | 25.020000457763672 |
| 2026-05-11 | Closing price | 25.5 |
| 2026-05-12 | Closing price | 27.1200008392334 |
| 2026-05-13 | Closing price | 27.739999771118164 |
| 2026-05-14 | Closing price | 27.290000915527344 |
| 2026-05-15 | Closing price | 24.950000762939453 |
| 2026-05-18 | Closing price | 24.260000228881836 |
| 2026-05-19 | Closing price | 23.959999084472656 |
| 2026-05-20 | Closing price | 24.489999771118164 |
| 2026-05-21 | Closing price | 24.739999771118164 |
| 2026-05-22 | Closing price | 24.389999389648438 |
| 2026-05-26 | Closing price | 26.549999237060547 |
| 2026-05-27 | Closing price | 26.59000015258789 |
| 2026-05-28 | Closing price | 28.229999542236328 |
| 2026-05-29 | Closing price | 29.15999984741211 |
| 2026-06-01 | Closing price | 30.59000015258789 |
| 2026-06-02 | Closing price | 31.8700008392334 |
| 2026-06-03 | Closing price | 30.329999923706055 |
| 2026-06-04 | Closing price | 30.1200008392334 |
| 2026-06-05 | Closing price | 25.65999984741211 |
| 2026-06-08 | Closing price | 26.110000610351562 |
| 2026-06-09 | Closing price | 25.59000015258789 |
| 2026-06-10 | Closing price | 24.68000030517578 |
| 2026-06-11 | Closing price | 26.639999389648438 |
| 2026-06-12 | Closing price | 27.81999969482422 |
| 2026-06-15 | Closing price | 28.75 |
| 2026-06-16 | Closing price | 29.100000381469727 |
| 2026-06-17 | Closing price | 28.170000076293945 |
| 2026-06-18 | Closing price | 27.59000015258789 |
| 2026-06-22 | Closing price | 27.90999984741211 |
| 2026-06-23 | Closing price | 25.360000610351562 |
| 2026-06-24 | Closing price | 22.989999771118164 |
| 2026-06-25 | Closing price | 23.530000686645508 |
| 2026-06-26 | Closing price | 23.299999237060547 |
| 2026-06-29 | Closing price | 23.68000030517578 |
| 2026-06-30 | Closing price | 23.610000610351562 |
| 2026-07-01 | Closing price | 22.59000015258789 |
| 2026-07-02 | Closing price | 22.59000015258789 |
| 2026-07-06 | Closing price | 23.34000015258789 |
| 2026-07-07 | Closing price | 21.549999237060547 |
| 2026-07-08 | Closing price | 20.59000015258789 |
| 2026-07-09 | Closing price | 21.579999923706055 |
| 2026-07-10 | Closing price | 21.639999389648438 |
| 2026-07-13 | Closing price | 20.8700008392334 |
| 2026-07-14 | Closing price | 22.5 |
| 2026-07-15 | Closing price | 21.979999542236328 |
| 2026-07-16 | Closing price | 20.81999969482422 |
| 2026-07-17 | Closing price | 20.360000610351562 |
| 2026-07-20 | Closing price | 20.84000015258789 |
| 2026-07-21 | Closing price | 23.0 |
| 2026-07-22 | Closing price | 23.549999237060547 |
| 2026-07-23 | Closing price | 22.6299991607666 |
| 2026-07-24 | Closing price | 22.350000381469727 |
| 2026-07-27 | Closing price | 22.43000030517578 |
| 2026-07-28 | Closing price | 21.780000686645508 |
| 2026-07-29 | Closing price | 21.979999542236328 |
| 2026-07-30 | Closing price | 22.75 |
| 2026-07-31 | Closing price | 22.75 |
| 2026-08-03 | Closing price | 23.399999618530273 |
| 2026-08-04 | Closing price | 24.770000457763672 |
| 2026-08-05 | Closing price | 25.899999618530273 |
| 2026-08-06 | Closing price | 26.309999465942383 |
| 2026-08-07 | Closing price | 27.610000610351562 |
| 2026-08-10 | Closing price | 27.90999984741211 |
| 2026-08-11 | Closing price | 27.670000076293945 |
| 2026-08-12 | Closing price | 27.8700008392334 |
| 2026-08-13 | Closing price | 26.469999313354492 |
| 2026-08-14 | Closing price | 26.690000534057617 |
| 2026-08-17 | Closing price | 27.440000534057617 |
| 2026-08-18 | Closing price | 26.40999984741211 |
| 2026-08-19 | Closing price | 27.469999313354492 |
| 2026-08-20 | Closing price | 28.149999618530273 |
| 2026-08-21 | Closing price | 30.059999465942383 |
| 2026-08-24 | Closing price | 29.600000381469727 |
| 2026-08-25 | Closing price | 30.790000915527344 |
| 2026-08-26 | Closing price | 29.989999771118164 |
| 2026-08-27 | Closing price | 30.360000610351562 |
| 2026-08-28 | Closing price | 29.290000915527344 |
| 2026-08-31 | Closing price | 28.65999984741211 |
| 2026-09-01 | Closing price | 27.020000457763672 |
| 2026-09-02 | Closing price | 27.31999969482422 |
| 2026-09-03 | Closing price | 27.690000534057617 |
| 2026-09-04 | Closing price | 27.43000030517578 |
| 2026-09-08 | Closing price | 29.0 |
| 2026-09-09 | Closing price | 28.81999969482422 |
| 2026-09-10 | Closing price | 26.649999618530273 |
| 2026-09-11 | Closing price | 26.520000457763672 |
| 2026-09-14 | Closing price | 25.6299991607666 |
| 2026-09-15 | Closing price | 25.239999771118164 |
| 2026-09-16 | Closing price | 25.260000228881836 |
| 2026-09-17 | Closing price | 26.440000534057617 |
| 2026-09-18 | Closing price | 26.899999618530273 |
| 2026-09-21 | Closing price | 26.649999618530273 |
| 2026-09-22 | Closing price | 27.739999771118164 |
| 2026-09-23 | Closing price | 26.790000915527344 |
| 2026-09-24 | Closing price | 26.479999542236328 |
| 2026-09-25 | Closing price | 26.6299991607666 |
| 2026-09-28 | Closing price | 26.8700008392334 |
| 2026-09-29 | Closing price | 27.010000228881836 |
| 2026-09-30 | Closing price | 26.68000030517578 |
| 2026-10-01 | Closing price | 26.18000030517578 |
| 2026-10-02 | Closing price | 27.200000762939453 |
| 2026-10-05 | Closing price | 27.260000228881836 |
| 2026-10-06 | Closing price | 26.950000762939453 |
| 2026-10-07 | Closing price | 25.8700008392334 |
| 2026-10-08 | Closing price | 25.389999389648438 |
| 2026-10-09 | Closing price | 26.1200008392334 |
| 2026-10-12 | Closing price | 25.760000228881836 |
| 2026-10-13 | Closing price | 25.68000030517578 |
| 2026-10-14 | Closing price | 24.239999771118164 |
| 2026-10-15 | Closing price | 24.219999313354492 |
| 2026-10-16 | Closing price | 23.6200008392334 |
| 2026-10-19 | Closing price | 23.920000076293945 |
| 2026-10-20 | Closing price | 23.65999984741211 |
| 2026-10-21 | Closing price | 23.989999771118164 |
| 2026-10-22 | Closing price | 21.889999389648438 |
| 2026-10-23 | Closing price | 21.979999542236328 |
| 2026-10-26 | Closing price | 22.15999984741211 |
| 2026-10-27 | Closing price | 23.389999389648438 |
| 2026-10-28 | Closing price | 23.600000381469727 |
| 2026-10-29 | Closing price | 23.360000610351562 |
| 2026-10-30 | Closing price | 21.700000762939453 |
| 2026-11-02 | Closing price | 21.700000762939453 |
| 2026-11-03 | Closing price | 21.440000534057617 |
| 2026-11-04 | Closing price | 22.219999313354492 |
| 2026-11-05 | Closing price | 20.579999923706055 |
| 2026-11-06 | Closing price | 20.90999984741211 |
| 2026-11-09 | Closing price | 22.790000915527344 |
| 2026-11-10 | Closing price | 21.950000762939453 |
| 2026-11-11 | Closing price | 21.940000534057617 |
| 2026-11-12 | Closing price | 21.6200008392334 |
| 2026-11-13 | Closing price | 21.3799991607666 |
| 2026-11-16 | Closing price | 19.549999237060547 |
EV/EBITDA of 5.3 against a three-year average of 5.1 – a 5% premium, with almost no multiple cushion
On the trailing twelve months EV/EBITDA is 5.3 against the company's own three-year average of 5.1 – a 5% premium. The share trades slightly above its own history on this multiple, and there is no discount to provide a cushion.
The trailing P/E is 12.8 and return on equity 12.3%. With net debt of 50.0 million and a ratio to EBITDA of 0.03 the balance sheet does not drag on the valuation, so the whole premium to history sits in the operating part.
The two yardsticks disagree: the portal model gives +25% upside, while the multiple stands 5% above its own history. For this share we treat the model as decisive – it re-prices earnings at current prices, whereas the LTM multiple rests on prices that have already passed. That is why the verdict is rather attractive rather than fairly valued.
Valuation on the latest reported figures
| Metric | Value |
|---|---|
| Market cap | 7.73 bn USD |
| P/E (LTM) | 12.8 |
| EV/EBITDA (LTM) | 5.3 |
| P/B | 2.39 |
| Net debt / EBITDA (LTM) | 0.03 |
| Operating cash flow (LTM) | 0.93 bn |
| ROE | 12.3% |
| Dividend yield (12m) | 0.1% |
| EV/EBITDA, 3-year average | 5.1 |
Net profit by quarter
| Period | Measure | bn USD |
|---|---|---|
| Q4 2024 | Net profit | 0.0193 |
| Q1 2025 | Net profit | 0.1004 |
| Q2 2025 | Net profit | 0.1177 |
| Q3 2025 | Net profit | 0.22240000000000001 |
| Q4 2025 | Net profit | 0.128 |
| Q1 2026 | Net profit | 0.1904 |
| Q2 2026 | Net profit | 0.1374 |
| Q3 2026 | Net profit | 0.1495 |
Bottom line
What was genuinely strong was the operating result: EBITDA of 412.1 million at a 53.8% margin against 26.9% a year earlier, revenue of 765.9 million with growth accelerating to 120.8%, and net debt of 50.0 million at a ratio to EBITDA of 0.03. What was weak was net profit, down 32.8% on a high year-ago base, and cash flow: capital expenditure of 217.5 million exceeded operating cash flow of 214.9 million. Price explains only 186.6 million of the 412.1 million dollars of EBITDA, so the durability of the result depends on volumes and costs, not on commodities alone. At current prices EBITDA is 10.1% below LTM, and EV/EBITDA of 5.3 stands 5% above the three-year average of 5.1. Our conclusion: rather attractive – the portal model puts the upside to fair value at +25%, and for this share we treat the re-pricing at current prices as decisive rather than the LTM multiple. Our view: the share is rather attractive at the current price; upside on the portal model +25%.