Hallador Energy: revenue fell 11.3% and EBITDA collapsed 59.5% – coal generation failed to carry the price
Contents
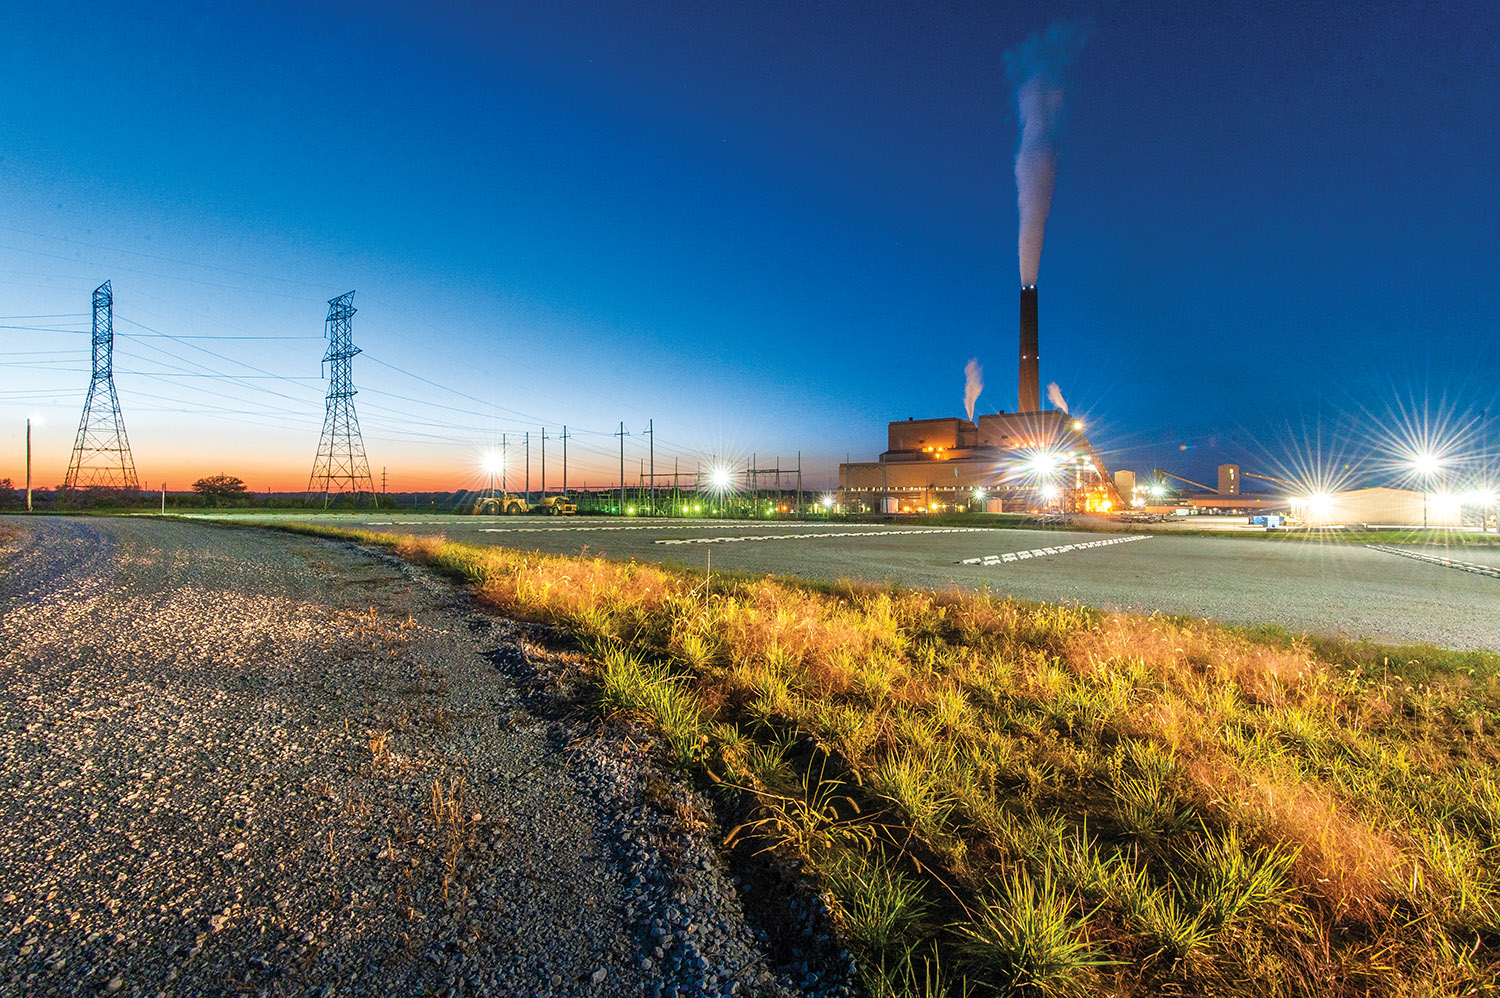
On 9 November Hallador Energy released its third-quarter 2026 results. Revenue was $130.25 million, EBITDA $15.46 million and net loss $4.5 million. Year on year revenue fell 11.3%, EBITDA 59.5% and net profit swung to a loss of 118.8%. The US steam coal benchmark averaged $49.6 per tonne in the period versus $50.5 a quarter earlier, and spot is now $50.4. At the previous quarter's volumes and costs, our calculation shows the price move alone would have produced revenue of $99.8 million and EBITDA of -$4.6 million; the reported $130.2 million and $15.5 million are explained by higher electricity deliveries after the Merom outage. Our verdict: the share is rather unattractive – EV/EBITDA of 25.6 against its own three-year average of 6.5, a 292% premium to history. Our view: the share is rather unattractive at the current price; no portal model for this share; EV/EBITDA 25.6 against a 3-year average of 6.5, a 292% premium to its history.
Our view: is there upside
Our view in numbers
| Metric | Our read |
|---|---|
| Verdict | Rather unattractive |
| Upside on the portal model | no portal model for this share |
| EV/EBITDA now and 3-year average | 25.6 vs 6.5 – a 292% premium to its history |
| Net debt / EBITDA | 21.25 – high leverage |
| Strongest case for | The $3.0 billion segment-level contracted book and the 460 MW Turtle Creek project, with a targeted FID before the end of 2026, offer potential not reflected in current LTM EBITDA of $19.9 million. |
| Strongest case against | EV/EBITDA of 25.6 against its own three-year average of 6.5 – a 292% premium to history with negative free cash flow and net debt to EBITDA of 21.25. |
| What would change the view | The verdict would improve if Merom load holds above 1.4 million MWh and LTM EBITDA grows enough for the multiple to approach its historical average of 6.5. |
Key takeaways
— The coal price barely moved, yet revenue fell 11.3% on lower third-party coal sales
— At the previous quarter's volumes and costs, our calculation shows the price move alone would have produced EBITDA of -$4.6 million; the reported $15.5 million came from electricity deliveries after the Merom outage
— Merom generation rose 77% quarter on quarter to about 1.4 million MWh, lifting electric sales to $92.8 million
— Half of the $4.5 million net loss was a one-off $5.7 million debt extinguishment charge
— Debt rose to $551.9 million while free cash flow turned negative on $57.1 million of capex
— EV/EBITDA of 25.6 against its own three-year average of 6.5 – a 292% premium to history
— The $3.0 billion forward sales book and the Turtle Creek project are the main case for the share, but they are not yet in earnings
Key figures, USD bn
| Metric | Q3 2025 | Q3 2026 | Change |
|---|---|---|---|
| Revenue | 0.15 | 0.13 | -11.3% |
| EBITDA | 0.04 | 0.02 | -59.5% |
| Operating profit | 0.03 | 0.01 | -73.0% |
| Net profit | 0.02 | -0.00 | -118.8% |
| Operating cash flow | 0.02 | -0.02 | -193.8% |
| Capex | 0.02 | 0.06 | +192.4% |
| EBITDA margin | 26.0% | 11.9% | -14.1 pp |
| Net margin | 16.3% | -3.5% | -19.8 pp |
The coal price barely moved, yet revenue fell 11.3% on lower third-party coal sales
The US steam coal benchmark averaged $49.6 per tonne in the third quarter of 2026 versus $50.5 a quarter earlier, a 1.7% decline. Spot on 5 November was $50.4, 1.6% above the period average. The price backdrop was broadly neutral, and it does not explain the 11.3% year-on-year fall in revenue to $130.25 million.
The issuer names the cause: revenue fell primarily on lower third-party coal sales. The report shows third-party coal sales dropping to $36.1 million from $51.3 million a year earlier, while electric sales were almost flat at $92.8 million versus $93.2 million. Quarter on quarter total revenue rose 28% on higher energy deliveries.
Year-on-year momentum decelerated: revenue grew 39.6% in the third quarter of 2025, the decline was 1.3% in the second quarter of 2026 and 11.3% now. For a coal producer this means the price factor no longer supports the top line, while the volume factor has turned negative in third-party sales.
Commodity prices: period average and now
| Benchmark | Year ago | Q3 2026 | YoY | Spot 2026-11-05 |
|---|---|---|---|---|
| Steam coal US, USD | — | 49,6 | — | 50,4 |
At the previous quarter's volumes and costs, our calculation shows the price move alone would have produced EBITDA of -$4.6 million; the reported $15.5 million came from electricity deliveries after the Merom outage
At the previous quarter's volumes and costs, with only the price moving, our calculation gives revenue of $99.8 million and EBITDA of -$4.6 million. The reported $130.2 million and $15.5 million are $30.4 million and $20.0 million above that. The gap is explained not by price but by volumes: Merom generation rose 77% quarter on quarter to about 1.4 million MWh after the planned major maintenance outage in July.
The portal's spot model, re-priced from the average of the previous four quarters to this period's prices, expected EBITDA of $10.2 million and revenue of $111.1 million. The actual $15.5 million and $130.2 million are 52.2% and 17.2% above the model. The revenue beat partly reflects the fact that reported revenue includes third-party coal sales and other revenues, while expenses include purchased power – activity beyond own production and generation.
For a coal producer the key question is whether it earned what the price allowed. The answer: the price allowed little, and the result was carried by generation volumes after the outage. That is a one-off recovery effect, not a durable improvement in the price environment.
What the prices implied and what the company earned
| Base (—) | Implied at period prices | Reported | Reported vs implied | |
|---|---|---|---|---|
| EBITDA, portal spot model, USD mn | — | 10,2 | 15,5 | +52,2% |
Revenue and EBITDA by quarter
| Period | Measure | bn USD |
|---|---|---|
| Q4 2024 | Revenue | 0.09338500000000001 |
| Q1 2025 | Revenue | 0.11772400000000001 |
| Q2 2025 | Revenue | 0.102889 |
| Q3 2025 | Revenue | 0.146846 |
| Q4 2025 | Revenue | 0.101944 |
| Q1 2026 | Revenue | 0.10180700000000001 |
| Q2 2026 | Revenue | 0.101505 |
| Q3 2026 | Revenue | 0.13025 |
| Q4 2024 | EBITDA | −0.19585399999999997 |
| Q1 2025 | EBITDA | 0.028852 |
| Q2 2025 | EBITDA | 0.017412 |
| Q3 2025 | EBITDA | 0.038201 |
| Q4 2025 | EBITDA | 0.017812999999999996 |
| Q1 2026 | EBITDA | 0.004955 |
| Q2 2026 | EBITDA | −0.002863999999999999 |
| Q3 2026 | EBITDA | 0.015463000000000001 |
EBITDA margin
| Period | Measure | % |
|---|---|---|
| Q4 2024 | EBITDA margin | −209.7 |
| Q1 2025 | EBITDA margin | 24.5 |
| Q2 2025 | EBITDA margin | 16.9 |
| Q3 2025 | EBITDA margin | 26.0 |
| Q4 2025 | EBITDA margin | 17.5 |
| Q1 2026 | EBITDA margin | 4.9 |
| Q2 2026 | EBITDA margin | −2.8 |
| Q3 2026 | EBITDA margin | 11.9 |
Merom generation rose 77% quarter on quarter to about 1.4 million MWh, lifting electric sales to $92.8 million
Electric sales were $92.8 million in the third quarter versus $59.5 million in the second quarter and $93.2 million a year earlier. The quarterly rise is explained by the completion of the planned major maintenance outage at Merom in July: generation rose 77% quarter on quarter to about 1.4 million MWh. Year on year electric sales were almost flat.
The cost of purchased power rose to $11.1 million from $2.1 million a year earlier, reflecting activity beyond own generation. Other operating and maintenance costs fell to $31.5 million from $44.4 million, partly offsetting the margin pressure.
Generation volume is the key operating lever for the issuer: with the coal price almost unchanged, it is plant load that determines how much EBITDA is earned. The next report needs to show whether Merom load stays above 1.4 million MWh without the one-off repair effect.
Half of the $4.5 million net loss was a one-off $5.7 million debt extinguishment charge
The net loss for the third quarter was $4.5 million versus a profit of $23.9 million a year earlier. The report names the one-off items: a $5.7 million loss on debt extinguishment for the quarter and $5.9 million for nine months, a $343 thousand loss on asset disposal, and $36 thousand of exploration costs. The debt extinguishment loss is the largest and exceeds the entire quarterly net loss.
The year-ago base was different: it included a $2.3 million gain on asset disposal that inflated profit. So the 118.8% fall in net profit reflects both a one-off charge this quarter and a one-off gain in the comparison base.
Operating profit was positive at $7.8 million and EBITDA at $15.5 million. The loss formed below the operating line: $6.0 million of interest, $5.7 million of debt extinguishment and $1.8 million of tax expense. For assessing business resilience it is the operating part that matters, and it remains positive.
Debt rose to $551.9 million while free cash flow turned negative on $57.1 million of capex
Total debt rose to $551.9 million at 30 September 2026 from $45.0 million at 30 June after the closing of a new $600.0 million senior secured construction bridge loan and the refinancing of existing debt. Of that, $329.8 million remained in restricted cash, primarily for the turbine acquisition. Net debt on the balance sheet at 30 September was $0.4 billion versus $0.0 billion at 31 December 2025.
Operating cash flow for the quarter was negative at -$21.8 million, and capital expenditures were $57.1 million versus $19.5 million a year earlier, mainly for the Turtle Creek project and Merom upgrades. Free cash flow was therefore negative. Net debt to EBITDA over the last twelve months is 21.25 – a level, not a direction.
Liquidity rose to $103.2 million from $84.2 million a quarter earlier and $46.4 million a year earlier. Interest expense for the quarter was $6.0 million, of which $3.4 million on debt. Debt service with negative free cash flow remains a key risk.
Valuation vs its own history
now vs the 3-year average
| Period | Measure | × |
|---|---|---|
| EV/EBITDA | Now | 25.564488920901248 |
| EV/EBITDA | 3-year average | 6.513875267991466 |
EV/EBITDA of 25.6 against its own three-year average of 6.5 – a 292% premium to history
EV/EBITDA over the last twelve months is 25.6 against its own three-year average of 6.5. That is a 292% premium to history – the share is valued well above its usual level. The reason is the denominator: LTM EBITDA is $19.9 million, reflecting weak quarters in the first half of 2026 when EBITDA was $5.0 million and -$2.9 million.
Market capitalisation is $478.5 million. At the current coal price of $50.4 and Merom load of about 1.4 million MWh, quarterly EBITDA of $15.5 million annualises to roughly $62 million, which would bring the multiple down to about 8. But that requires sustaining generation volumes and a stable coal price.
Return on equity is negative at -9.5%. For a coal producer valuation should start from EBITDA at current prices; at a spot coal price of $50.4 and restored load the multiple looks high against history, but not absurd if volumes hold.
Share price, three years
close, last point 2026-11-10
| Period | Measure | USD per share |
|---|---|---|
| 2025-11-10 | Closing price | 20.010000228881836 |
| 2025-11-11 | Closing price | 23.809999465942383 |
| 2025-11-12 | Closing price | 22.719999313354492 |
| 2025-11-13 | Closing price | 20.950000762939453 |
| 2025-11-14 | Closing price | 20.34000015258789 |
| 2025-11-17 | Closing price | 20.25 |
| 2025-11-18 | Closing price | 20.43000030517578 |
| 2025-11-19 | Closing price | 20.809999465942383 |
| 2025-11-20 | Closing price | 20.030000686645508 |
| 2025-11-21 | Closing price | 19.209999084472656 |
| 2025-11-24 | Closing price | 19.760000228881836 |
| 2025-11-25 | Closing price | 19.649999618530273 |
| 2025-11-26 | Closing price | 19.889999389648438 |
| 2025-11-28 | Closing price | 20.389999389648438 |
| 2025-12-01 | Closing price | 19.850000381469727 |
| 2025-12-02 | Closing price | 19.18000030517578 |
| 2025-12-03 | Closing price | 19.25 |
| 2025-12-04 | Closing price | 19.6200008392334 |
| 2025-12-05 | Closing price | 19.950000762939453 |
| 2025-12-08 | Closing price | 21.15999984741211 |
| 2025-12-09 | Closing price | 22.34000015258789 |
| 2025-12-10 | Closing price | 22.030000686645508 |
| 2025-12-11 | Closing price | 22.790000915527344 |
| 2025-12-12 | Closing price | 22.299999237060547 |
| 2025-12-15 | Closing price | 21.209999084472656 |
| 2025-12-16 | Closing price | 20.420000076293945 |
| 2025-12-17 | Closing price | 17.309999465942383 |
| 2025-12-18 | Closing price | 18.3799991607666 |
| 2025-12-19 | Closing price | 19.280000686645508 |
| 2025-12-22 | Closing price | 19.75 |
| 2025-12-23 | Closing price | 19.530000686645508 |
| 2025-12-24 | Closing price | 19.489999771118164 |
| 2025-12-26 | Closing price | 19.31999969482422 |
| 2025-12-29 | Closing price | 19.290000915527344 |
| 2025-12-30 | Closing price | 19.020000457763672 |
| 2025-12-31 | Closing price | 19.040000915527344 |
| 2026-01-02 | Closing price | 19.360000610351562 |
| 2026-01-05 | Closing price | 19.3799991607666 |
| 2026-01-06 | Closing price | 19.09000015258789 |
| 2026-01-07 | Closing price | 18.1200008392334 |
| 2026-01-08 | Closing price | 18.6299991607666 |
| 2026-01-09 | Closing price | 19.56999969482422 |
| 2026-01-12 | Closing price | 20.290000915527344 |
| 2026-01-13 | Closing price | 20.6200008392334 |
| 2026-01-14 | Closing price | 18.790000915527344 |
| 2026-01-15 | Closing price | 19.43000030517578 |
| 2026-01-16 | Closing price | 20.209999084472656 |
| 2026-01-20 | Closing price | 19.950000762939453 |
| 2026-01-21 | Closing price | 20.100000381469727 |
| 2026-01-22 | Closing price | 20.5 |
| 2026-01-23 | Closing price | 20.0 |
| 2026-01-26 | Closing price | 18.700000762939453 |
| 2026-01-27 | Closing price | 18.670000076293945 |
| 2026-01-28 | Closing price | 18.209999084472656 |
| 2026-01-29 | Closing price | 18.190000534057617 |
| 2026-01-30 | Closing price | 18.489999771118164 |
| 2026-02-02 | Closing price | 17.940000534057617 |
| 2026-02-03 | Closing price | 18.559999465942383 |
| 2026-02-04 | Closing price | 17.780000686645508 |
| 2026-02-05 | Closing price | 18.780000686645508 |
| 2026-02-06 | Closing price | 20.059999465942383 |
| 2026-02-09 | Closing price | 20.860000610351562 |
| 2026-02-10 | Closing price | 20.489999771118164 |
| 2026-02-11 | Closing price | 20.329999923706055 |
| 2026-02-12 | Closing price | 19.360000610351562 |
| 2026-02-13 | Closing price | 20.09000015258789 |
| 2026-02-17 | Closing price | 18.959999084472656 |
| 2026-02-18 | Closing price | 18.65999984741211 |
| 2026-02-19 | Closing price | 18.84000015258789 |
| 2026-02-20 | Closing price | 18.399999618530273 |
| 2026-02-23 | Closing price | 17.93000030517578 |
| 2026-02-24 | Closing price | 18.229999542236328 |
| 2026-02-25 | Closing price | 18.579999923706055 |
| 2026-02-26 | Closing price | 18.520000457763672 |
| 2026-02-27 | Closing price | 18.18000030517578 |
| 2026-03-02 | Closing price | 18.969999313354492 |
| 2026-03-03 | Closing price | 18.760000228881836 |
| 2026-03-04 | Closing price | 18.950000762939453 |
| 2026-03-05 | Closing price | 19.729999542236328 |
| 2026-03-06 | Closing price | 19.690000534057617 |
| 2026-03-09 | Closing price | 18.850000381469727 |
| 2026-03-10 | Closing price | 19.09000015258789 |
| 2026-03-11 | Closing price | 18.920000076293945 |
| 2026-03-12 | Closing price | 19.329999923706055 |
| 2026-03-13 | Closing price | 17.100000381469727 |
| 2026-03-16 | Closing price | 15.970000267028809 |
| 2026-03-17 | Closing price | 16.75 |
| 2026-03-18 | Closing price | 16.420000076293945 |
| 2026-03-19 | Closing price | 16.809999465942383 |
| 2026-03-20 | Closing price | 15.720000267028809 |
| 2026-03-23 | Closing price | 15.720000267028809 |
| 2026-03-24 | Closing price | 16.6299991607666 |
| 2026-03-25 | Closing price | 17.6299991607666 |
| 2026-03-26 | Closing price | 18.3799991607666 |
| 2026-03-27 | Closing price | 17.56999969482422 |
| 2026-03-30 | Closing price | 16.799999237060547 |
| 2026-03-31 | Closing price | 16.280000686645508 |
| 2026-04-01 | Closing price | 15.869999885559082 |
| 2026-04-02 | Closing price | 15.829999923706055 |
| 2026-04-06 | Closing price | 16.079999923706055 |
| 2026-04-07 | Closing price | 15.640000343322754 |
| 2026-04-08 | Closing price | 15.729999542236328 |
| 2026-04-09 | Closing price | 15.270000457763672 |
| 2026-04-10 | Closing price | 15.199999809265137 |
| 2026-04-13 | Closing price | 15.15999984741211 |
| 2026-04-14 | Closing price | 15.09000015258789 |
| 2026-04-15 | Closing price | 15.819999694824219 |
| 2026-04-16 | Closing price | 16.579999923706055 |
| 2026-04-17 | Closing price | 15.75 |
| 2026-04-20 | Closing price | 15.199999809265137 |
| 2026-04-21 | Closing price | 15.84000015258789 |
| 2026-04-22 | Closing price | 16.049999237060547 |
| 2026-04-23 | Closing price | 15.9399995803833 |
| 2026-04-24 | Closing price | 15.970000267028809 |
| 2026-04-27 | Closing price | 16.389999389648438 |
| 2026-04-28 | Closing price | 15.460000038146973 |
| 2026-04-29 | Closing price | 15.15999984741211 |
| 2026-04-30 | Closing price | 15.529999732971191 |
| 2026-05-01 | Closing price | 15.619999885559082 |
| 2026-05-04 | Closing price | 15.5600004196167 |
| 2026-05-05 | Closing price | 17.65999984741211 |
| 2026-05-06 | Closing price | 18.549999237060547 |
| 2026-05-07 | Closing price | 18.8700008392334 |
| 2026-05-08 | Closing price | 18.809999465942383 |
| 2026-05-11 | Closing price | 19.31999969482422 |
| 2026-05-12 | Closing price | 19.75 |
| 2026-05-13 | Closing price | 19.420000076293945 |
| 2026-05-14 | Closing price | 19.389999389648438 |
| 2026-05-15 | Closing price | 18.149999618530273 |
| 2026-05-18 | Closing price | 18.299999237060547 |
| 2026-05-19 | Closing price | 18.010000228881836 |
| 2026-05-20 | Closing price | 17.610000610351562 |
| 2026-05-21 | Closing price | 17.780000686645508 |
| 2026-05-22 | Closing price | 17.959999084472656 |
| 2026-05-26 | Closing price | 19.020000457763672 |
| 2026-05-27 | Closing price | 19.6299991607666 |
| 2026-05-28 | Closing price | 19.780000686645508 |
| 2026-05-29 | Closing price | 19.260000228881836 |
| 2026-06-01 | Closing price | 19.010000228881836 |
| 2026-06-02 | Closing price | 18.8799991607666 |
| 2026-06-03 | Closing price | 18.139999389648438 |
| 2026-06-04 | Closing price | 18.950000762939453 |
| 2026-06-05 | Closing price | 16.65999984741211 |
| 2026-06-08 | Closing price | 16.920000076293945 |
| 2026-06-09 | Closing price | 16.190000534057617 |
| 2026-06-10 | Closing price | 15.8100004196167 |
| 2026-06-11 | Closing price | 16.1299991607666 |
| 2026-06-12 | Closing price | 16.440000534057617 |
| 2026-06-15 | Closing price | 16.450000762939453 |
| 2026-06-16 | Closing price | 17.299999237060547 |
| 2026-06-17 | Closing price | 17.670000076293945 |
| 2026-06-18 | Closing price | 19.450000762939453 |
| 2026-06-22 | Closing price | 18.93000030517578 |
| 2026-06-23 | Closing price | 17.729999542236328 |
| 2026-06-24 | Closing price | 17.700000762939453 |
| 2026-06-25 | Closing price | 18.149999618530273 |
| 2026-06-26 | Closing price | 17.530000686645508 |
| 2026-06-29 | Closing price | 16.93000030517578 |
| 2026-06-30 | Closing price | 17.389999389648438 |
| 2026-07-01 | Closing price | 16.790000915527344 |
| 2026-07-02 | Closing price | 16.25 |
| 2026-07-06 | Closing price | 16.479999542236328 |
| 2026-07-07 | Closing price | 15.529999732971191 |
| 2026-07-08 | Closing price | 16.09000015258789 |
| 2026-07-09 | Closing price | 16.540000915527344 |
| 2026-07-10 | Closing price | 16.329999923706055 |
| 2026-07-13 | Closing price | 16.68000030517578 |
| 2026-07-14 | Closing price | 17.239999771118164 |
| 2026-07-15 | Closing price | 16.40999984741211 |
| 2026-07-16 | Closing price | 16.049999237060547 |
| 2026-07-17 | Closing price | 15.979999542236328 |
| 2026-07-20 | Closing price | 15.770000457763672 |
| 2026-07-21 | Closing price | 16.610000610351562 |
| 2026-07-22 | Closing price | 16.290000915527344 |
| 2026-07-23 | Closing price | 16.049999237060547 |
| 2026-07-24 | Closing price | 15.239999771118164 |
| 2026-07-27 | Closing price | 15.210000038146973 |
| 2026-07-28 | Closing price | 14.609999656677246 |
| 2026-07-29 | Closing price | 13.699999809265137 |
| 2026-07-30 | Closing price | 14.609999656677246 |
| 2026-07-31 | Closing price | 14.220000267028809 |
| 2026-08-03 | Closing price | 14.9399995803833 |
| 2026-08-04 | Closing price | 15.130000114440918 |
| 2026-08-05 | Closing price | 14.770000457763672 |
| 2026-08-06 | Closing price | 14.819999694824219 |
| 2026-08-07 | Closing price | 14.760000228881836 |
| 2026-08-10 | Closing price | 15.880000114440918 |
| 2026-08-11 | Closing price | 15.640000343322754 |
| 2026-08-12 | Closing price | 15.770000457763672 |
| 2026-08-13 | Closing price | 15.489999771118164 |
| 2026-08-14 | Closing price | 16.15999984741211 |
| 2026-08-17 | Closing price | 16.190000534057617 |
| 2026-08-18 | Closing price | 15.789999961853027 |
| 2026-08-19 | Closing price | 16.3799991607666 |
| 2026-08-20 | Closing price | 15.529999732971191 |
| 2026-08-21 | Closing price | 15.380000114440918 |
| 2026-08-24 | Closing price | 15.960000038146973 |
| 2026-08-25 | Closing price | 16.360000610351562 |
| 2026-08-26 | Closing price | 16.239999771118164 |
| 2026-08-27 | Closing price | 16.6299991607666 |
| 2026-08-28 | Closing price | 16.239999771118164 |
| 2026-08-31 | Closing price | 16.579999923706055 |
| 2026-09-01 | Closing price | 16.3700008392334 |
| 2026-09-02 | Closing price | 16.350000381469727 |
| 2026-09-03 | Closing price | 16.110000610351562 |
| 2026-09-04 | Closing price | 16.600000381469727 |
| 2026-09-08 | Closing price | 16.899999618530273 |
| 2026-09-09 | Closing price | 16.520000457763672 |
| 2026-09-10 | Closing price | 15.600000381469727 |
| 2026-09-11 | Closing price | 15.34000015258789 |
| 2026-09-14 | Closing price | 14.479999542236328 |
| 2026-09-15 | Closing price | 14.329999923706055 |
| 2026-09-16 | Closing price | 14.6899995803833 |
| 2026-09-17 | Closing price | 15.170000076293945 |
| 2026-09-18 | Closing price | 15.119999885559082 |
| 2026-09-21 | Closing price | 15.010000228881836 |
| 2026-09-22 | Closing price | 15.069999694824219 |
| 2026-09-23 | Closing price | 14.510000228881836 |
| 2026-09-24 | Closing price | 14.539999961853027 |
| 2026-09-25 | Closing price | 14.720000267028809 |
| 2026-09-28 | Closing price | 14.390000343322754 |
| 2026-09-29 | Closing price | 14.09000015258789 |
| 2026-09-30 | Closing price | 13.869999885559082 |
| 2026-10-01 | Closing price | 13.520000457763672 |
| 2026-10-02 | Closing price | 13.489999771118164 |
| 2026-10-05 | Closing price | 13.949999809265137 |
| 2026-10-06 | Closing price | 14.8100004196167 |
| 2026-10-07 | Closing price | 13.649999618530273 |
| 2026-10-08 | Closing price | 14.5 |
| 2026-10-09 | Closing price | 13.920000076293945 |
| 2026-10-12 | Closing price | 14.5600004196167 |
| 2026-10-13 | Closing price | 13.949999809265137 |
| 2026-10-14 | Closing price | 12.420000076293945 |
| 2026-10-15 | Closing price | 12.710000038146973 |
| 2026-10-16 | Closing price | 11.710000038146973 |
| 2026-10-19 | Closing price | 11.65999984741211 |
| 2026-10-20 | Closing price | 11.34000015258789 |
| 2026-10-21 | Closing price | 11.449999809265137 |
| 2026-10-22 | Closing price | 11.220000267028809 |
| 2026-10-23 | Closing price | 11.050000190734863 |
| 2026-10-26 | Closing price | 10.989999771118164 |
| 2026-10-27 | Closing price | 11.880000114440918 |
| 2026-10-28 | Closing price | 11.890000343322754 |
| 2026-10-29 | Closing price | 11.729999542236328 |
| 2026-10-30 | Closing price | 11.220000267028809 |
| 2026-11-02 | Closing price | 10.600000381469727 |
| 2026-11-03 | Closing price | 10.640000343322754 |
| 2026-11-04 | Closing price | 9.609999656677246 |
| 2026-11-05 | Closing price | 9.359999656677246 |
| 2026-11-06 | Closing price | 10.100000381469727 |
| 2026-11-09 | Closing price | 10.59000015258789 |
| 2026-11-10 | Closing price | 10.149999618530273 |
The $3.0 billion forward sales book and the Turtle Creek project are the main case for the share, but they are not yet in earnings
The issuer reports contracted revenue at the segment level of about $3.0 billion including the agreements of 7 October 2026, including intercompany coal sales. Consolidated contracted revenue is $2.5 billion, with accredited capacity commitments extending to 2040. Contract prices step up materially from 2027.
The roughly 460 MW Turtle Creek project is advancing toward a final investment decision before the end of 2026, with a targeted commercial operation date in the second half of 2028. The issuer took title to turbine equipment under a $350 million agreement, with the remaining $265 million deposited in escrow. MISO completed the interconnection study, but the interconnection agreement has not yet been executed.
These factors create potential but are not yet in earnings: LTM EBITDA is $19.9 million while capex was already $57.1 million in the quarter. Reserves at the current production rate last 7.6 years. The case for the share is the contracted base and the project; the case against is the current valuation and negative free cash flow.
Valuation on the latest reported figures
| Metric | Value |
|---|---|
| Market cap | 0.48 bn USD |
| EV/EBITDA (LTM) | 25.6 |
| P/B | 2.99 |
| Net debt / EBITDA (LTM) | 21.25 |
| Operating cash flow (LTM) | -0.02 bn |
| ROE | -9.5% |
| EV/EBITDA, 3-year average | 6.5 |
Net profit by quarter
| Period | Measure | bn USD |
|---|---|---|
| Q4 2024 | Net profit | −0.21580000000000002 |
| Q1 2025 | Net profit | 0.009979 |
| Q2 2025 | Net profit | 0.008248 |
| Q3 2025 | Net profit | 0.023884 |
| Q4 2025 | Net profit | −0.00023999999999999488 |
| Q1 2026 | Net profit | −0.009321 |
| Q2 2026 | Net profit | −0.015235 |
| Q3 2026 | Net profit | −0.004497 |
Bottom line
The strong side of the quarter was generation: Merom rose 77% quarter on quarter after the outage, electric sales were $92.8 million, and EBITDA of $15.5 million beat both our calculation and the portal's spot model. But that result is one-off in nature, not a consequence of the price environment: the coal price barely moved. The $4.5 million net loss was half created by a $5.7 million debt extinguishment charge, and free cash flow was negative with $57.1 million of capex. The key question for a holder is whether Merom load holds and when the $3.0 billion contracted book starts turning into profit. Our verdict: the share is rather unattractive – EV/EBITDA of 25.6 against its own three-year average of 6.5, a 292% premium to history. Our view: the share is rather unattractive at the current price; no portal model for this share; EV/EBITDA 25.6 against a 3-year average of 6.5, a 292% premium to its history.