Headwater Exploration: WTI is up 31.7%, yet EBITDA came in below what that price implied
Contents
On 17 November Headwater Exploration reported results for the third quarter of 2026. The average WTI price in the period was USD 85.4 against USD 64.9 a year earlier (+31.7%), but at the previous quarter's price of USD 92.8 and its volumes and costs our calculation gives revenue of USD 158.5m and EBITDA of USD 87.0m; actual revenue was USD 170.8m, EBITDA USD 84.1m and net profit USD 47.5m. At today's prices the portal's spot model puts annual EBITDA at USD 328.7m against USD 289.4m for the trailing twelve months, and EV/EBITDA on that base at 5.8. Our conclusion: rather unattractive – on the portal's model the share trades 11% above its modelled fair value, and on EV/EBITDA LTM of 8.0 it carries a 63% premium to its own three-year average of 4.9. Our view: the share is rather unattractive at the current price; upside on the portal model -11%.
Our view: is there upside
Our view in numbers
| Metric | Our read |
|---|---|
| Verdict | Rather unattractive |
| Upside on the portal model | -11% |
| How the model works | spot model: EBITDA re-priced to current commodity prices at the target EV/EBITDA, against market cap |
| EV/EBITDA now and 3-year average | 8.0 vs 4.9 – a 63% premium to its history |
| Dividend yield, 12m | 4.0% |
| Net debt / EBITDA | -0.35 – net cash |
| Strongest case for | Net cash of USD 84.1m and operating cash flow of USD 87.9m cover capital expenditure of USD 44.1m and a dividend yielding 3.97%. |
| Strongest case against | EV/EBITDA LTM of 8.0 against its own three-year average of 4.9 is a 63% premium, and on the portal's model the share trades 11% above modelled fair value. |
| What would change the view | The verdict would move one step up if the average WTI price held sustainably above USD 90 and EBITDA at current volumes caught up with the price-implied figure. |
Key takeaways
— WTI rose 31.7% year on year but fell 7.9% from the previous quarter
— At the previous quarter's price EBITDA would have been USD 87.0m; it came in at USD 84.1m
— Revenue beat the price-implied figure by USD 12.3m, and that outweighed the EBITDA shortfall
— The 49.3% EBITDA margin and 27.8% net margin rest on the high price, not on one-off items
— Net cash of USD 84.1m with net debt to EBITDA LTM at -0.35
— A 3.97% dividend yield, with payouts taking part of the cash flow
— EV/EBITDA LTM of 8.0 against its own three-year average of 4.9 – a 63% premium
Key figures, USD bn
| Metric | — | Q3 2026 | Change |
|---|---|---|---|
| Revenue | — | 0.17 | — |
| EBITDA | — | 0.08 | — |
| Operating profit | — | 0.06 | — |
| Net profit | — | 0.05 | — |
| Operating cash flow | — | 0.09 | — |
| EBITDA margin | — | 49.3% | — |
| Net margin | — | 27.8% | — |
WTI rose 31.7% year on year but fell 7.9% from the previous quarter
The average WTI price in the third quarter of 2026 was USD 85.4 against USD 64.9 a year earlier, a rise of 31.7%. From the previous quarter the price fell from USD 92.8 by 7.9%. Spot on 17 November is USD 84.6, 0.9% below the reported-period average.
For Headwater Exploration this is the main external factor: in the portal's model oil sales generate 93% of revenue. Year-on-year revenue and profit therefore look stronger than the quarter-on-quarter picture, and the comparison with the previous quarter shows more honestly what the company itself delivered.
Commodity prices: period average and now
| Benchmark | Year ago | Q3 2026 | YoY | Spot 2026-11-17 |
|---|---|---|---|---|
| WTI, USD | 64,9 | 85,4 | +31,7% | 84,6 |
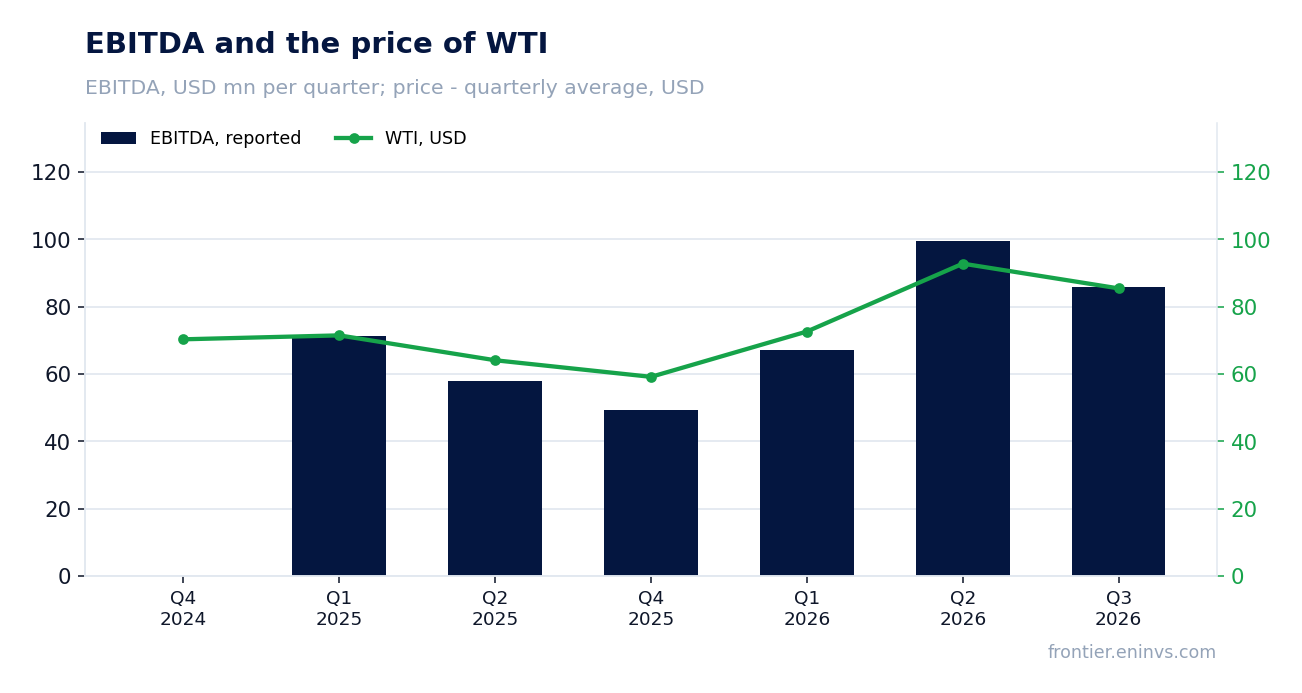
At the previous quarter's price EBITDA would have been USD 87.0m; it came in at USD 84.1m
At the previous quarter's volumes and costs, moving only the price, our calculation gives revenue of USD 158.5m and EBITDA of USD 87.0m. Actual revenue was USD 170.8m, USD 12.3m (7.7%) above the price-implied figure; actual EBITDA was USD 84.1m, USD 2.9m (3.4%) below it.
The revenue gap is explained by volumes and the realised price against the benchmark: more was sold than the previous quarter's price implied. The EBITDA gap of 3.4% is small, but it means the volume growth did not fully convert into profit – part of it was absorbed by unit costs.
The difference between revenue and EBITDA matters for judging the quality of the report: the company sold more, but margin per barrel was lower than at the previous quarter's price. That is not a failure, but it is not the result one should have expected at WTI of USD 85.4.
Revenue and EBITDA by quarter
| Period | Measure | bn USD |
|---|---|---|
| Q4 2024 | Revenue | 0.116643 |
| Q1 2025 | Revenue | 0.11826600000000001 |
| Q2 2025 | Revenue | 0.10481 |
| Q4 2025 | Revenue | 0.108554 |
| Q1 2026 | Revenue | 0.12846100000000002 |
| Q2 2026 | Revenue | 0.171127 |
| Q3 2026 | Revenue | 0.17076 |
| Q1 2025 | EBITDA | 0.07122400000000001 |
| Q2 2025 | EBITDA | 0.057981 |
| Q4 2025 | EBITDA | 0.049445 |
| Q1 2026 | EBITDA | 0.067176 |
| Q2 2026 | EBITDA | 0.099668 |
| Q3 2026 | EBITDA | 0.085943 |
EBITDA margin
| Period | Measure | % |
|---|---|---|
| Q4 2024 | EBITDA margin | — |
| Q1 2025 | EBITDA margin | 60.2 |
| Q2 2025 | EBITDA margin | 55.3 |
| Q4 2025 | EBITDA margin | 45.5 |
| Q1 2026 | EBITDA margin | 52.3 |
| Q2 2026 | EBITDA margin | 58.2 |
| Q3 2026 | EBITDA margin | 50.3 |
Missing EBITDA shown as zero, as in the original chart
Revenue beat the price-implied figure by USD 12.3m, and that outweighed the EBITDA shortfall
Revenue for the third quarter of 2026 was USD 170.8m, EBITDA USD 84.1m, operating profit USD 63.8m and net profit USD 47.5m. At the previous quarter's price revenue would have been USD 158.5m, so actual sales added USD 12.3m.
That means volumes rose against the previous quarter and offset the 7.9% price decline. EBITDA, however, was USD 2.9m below the price-implied figure, so the volume growth came with higher unit costs or a realised price below WTI.
For an investor the takeaway is this: the company sold more but earned less per barrel than the price allowed. The next report will show whether that was a one-off difference in the realised price or persistent pressure on costs.
The 49.3% EBITDA margin and 27.8% net margin rest on the high price, not on one-off items
The EBITDA margin for the reported period was 49.3% and the net margin 27.8%. With revenue of USD 170.8m and EBITDA of USD 84.1m, that is consistent with what a WTI price of USD 85.4 delivers at controlled costs.
There are no one-off items in the facts that would explain the profit: net profit of USD 47.5m against operating profit of USD 63.8m is reasonable for a company with net cash. The margin can therefore be treated as operating, not the result of an asset sale or a revaluation.
The high margin is the main argument for the quality of the business, but it is also the main risk: at the previous quarter's price of USD 92.8 EBITDA would have been USD 87.0m, so the margin is price-sensitive. At the current price of USD 84.6 the margin is likely to be lower.
Net cash of USD 84.1m with net debt to EBITDA LTM at -0.35
As of 30 September 2026 the company had net cash of USD 84.1m, and net debt to EBITDA for the trailing twelve months was -0.35. That is a level at which debt creates no risk for the dividend or for capital spending.
Operating cash flow in the reported quarter was USD 87.9m and capital expenditure USD 44.1m. Free cash flow is positive and covers both investment and shareholder payouts.
At current prices the portal's spot model gives net debt to EBITDA of -0.26, so the cash cushion remains. This is not the leverage that can change the verdict, but it removes balance-sheet risk from the equation.
Valuation vs its own history
now vs the 3-year average
| Period | Measure | × |
|---|---|---|
| EV/EBITDA | Now | 8.0042753559903 |
| EV/EBITDA | 3-year average | 4.903738395944062 |
A 3.97% dividend yield, with payouts taking part of the cash flow
The dividend yield for the trailing twelve months is 3.97%. With a market capitalisation of USD 1,994.0m that corresponds to payouts of about USD 79.1m a year, comparable to net profit of USD 109.5m for the trailing twelve months.
Our estimate for the current year's dividend assumes the payout ratio stays at last year's level and profit stays close to LTM. It rests on cash flow rather than one-off items and looks sustainable at a WTI price of around USD 85.
A yield of 3.97% is below that of many companies in the sector and does not offset the premium to the company's own history on the multiple. If WTI falls to USD 75, profit and the dividend could shrink, and the yield would stop being an argument.
Share price, three years
close, last point 2026-11-16
| Period | Measure | USD per share |
|---|---|---|
| 2025-11-17 | Closing price | 8.229999542236328 |
| 2025-11-18 | Closing price | 8.600000381469727 |
| 2025-11-19 | Closing price | 8.869999885559082 |
| 2025-11-20 | Closing price | 8.760000228881836 |
| 2025-11-21 | Closing price | 8.65999984741211 |
| 2025-11-24 | Closing price | 8.8100004196167 |
| 2025-11-25 | Closing price | 8.729999542236328 |
| 2025-11-26 | Closing price | 8.760000228881836 |
| 2025-11-27 | Closing price | 8.800000190734863 |
| 2025-11-28 | Closing price | 8.920000076293945 |
| 2025-12-01 | Closing price | 9.020000457763672 |
| 2025-12-02 | Closing price | 9.079999923706055 |
| 2025-12-03 | Closing price | 9.279999732971191 |
| 2025-12-04 | Closing price | 9.569999694824219 |
| 2025-12-05 | Closing price | 9.489999771118164 |
| 2025-12-08 | Closing price | 9.369999885559082 |
| 2025-12-09 | Closing price | 9.229999542236328 |
| 2025-12-10 | Closing price | 9.25 |
| 2025-12-11 | Closing price | 9.039999961853027 |
| 2025-12-12 | Closing price | 9.100000381469727 |
| 2025-12-15 | Closing price | 9.039999961853027 |
| 2025-12-16 | Closing price | 8.649999618530273 |
| 2025-12-17 | Closing price | 8.960000038146973 |
| 2025-12-18 | Closing price | 9.0 |
| 2025-12-19 | Closing price | 9.079999923706055 |
| 2025-12-22 | Closing price | 9.210000038146973 |
| 2025-12-23 | Closing price | 9.390000343322754 |
| 2025-12-24 | Closing price | 9.390000343322754 |
| 2025-12-29 | Closing price | 9.4399995803833 |
| 2025-12-30 | Closing price | 9.5 |
| 2025-12-31 | Closing price | 9.369999885559082 |
| 2026-01-02 | Closing price | 9.539999961853027 |
| 2026-01-05 | Closing price | 9.0600004196167 |
| 2026-01-06 | Closing price | 9.149999618530273 |
| 2026-01-07 | Closing price | 8.920000076293945 |
| 2026-01-08 | Closing price | 9.199999809265137 |
| 2026-01-09 | Closing price | 9.489999771118164 |
| 2026-01-12 | Closing price | 9.40999984741211 |
| 2026-01-13 | Closing price | 9.819999694824219 |
| 2026-01-14 | Closing price | 9.8100004196167 |
| 2026-01-15 | Closing price | 10.0 |
| 2026-01-16 | Closing price | 10.369999885559082 |
| 2026-01-19 | Closing price | 10.510000228881836 |
| 2026-01-20 | Closing price | 10.479999542236328 |
| 2026-01-21 | Closing price | 10.800000190734863 |
| 2026-01-22 | Closing price | 10.65999984741211 |
| 2026-01-23 | Closing price | 10.869999885559082 |
| 2026-01-26 | Closing price | 10.949999809265137 |
| 2026-01-27 | Closing price | 11.300000190734863 |
| 2026-01-28 | Closing price | 11.350000381469727 |
| 2026-01-29 | Closing price | 11.34000015258789 |
| 2026-01-30 | Closing price | 11.0 |
| 2026-02-02 | Closing price | 10.930000305175781 |
| 2026-02-03 | Closing price | 11.319999694824219 |
| 2026-02-04 | Closing price | 11.4399995803833 |
| 2026-02-05 | Closing price | 11.149999618530273 |
| 2026-02-06 | Closing price | 11.479999542236328 |
| 2026-02-09 | Closing price | 11.729999542236328 |
| 2026-02-10 | Closing price | 11.670000076293945 |
| 2026-02-11 | Closing price | 11.84000015258789 |
| 2026-02-12 | Closing price | 11.369999885559082 |
| 2026-02-13 | Closing price | 11.569999694824219 |
| 2026-02-17 | Closing price | 11.470000267028809 |
| 2026-02-18 | Closing price | 11.90999984741211 |
| 2026-02-19 | Closing price | 11.989999771118164 |
| 2026-02-20 | Closing price | 11.970000267028809 |
| 2026-02-23 | Closing price | 12.050000190734863 |
| 2026-02-24 | Closing price | 12.029999732971191 |
| 2026-02-25 | Closing price | 12.020000457763672 |
| 2026-02-26 | Closing price | 12.199999809265137 |
| 2026-02-27 | Closing price | 12.5600004196167 |
| 2026-03-02 | Closing price | 12.880000114440918 |
| 2026-03-03 | Closing price | 12.4399995803833 |
| 2026-03-04 | Closing price | 12.479999542236328 |
| 2026-03-05 | Closing price | 12.479999542236328 |
| 2026-03-06 | Closing price | 12.289999961853027 |
| 2026-03-09 | Closing price | 12.25 |
| 2026-03-10 | Closing price | 12.8100004196167 |
| 2026-03-11 | Closing price | 12.84000015258789 |
| 2026-03-12 | Closing price | 12.6899995803833 |
| 2026-03-13 | Closing price | 12.510000228881836 |
| 2026-03-16 | Closing price | 12.489999771118164 |
| 2026-03-17 | Closing price | 12.630000114440918 |
| 2026-03-18 | Closing price | 12.539999961853027 |
| 2026-03-19 | Closing price | 12.949999809265137 |
| 2026-03-20 | Closing price | 12.789999961853027 |
| 2026-03-23 | Closing price | 12.779999732971191 |
| 2026-03-24 | Closing price | 12.84000015258789 |
| 2026-03-25 | Closing price | 12.800000190734863 |
| 2026-03-26 | Closing price | 12.720000267028809 |
| 2026-03-27 | Closing price | 13.1899995803833 |
| 2026-03-30 | Closing price | 12.989999771118164 |
| 2026-03-31 | Closing price | 12.850000381469727 |
| 2026-04-01 | Closing price | 11.979999542236328 |
| 2026-04-02 | Closing price | 12.479999542236328 |
| 2026-04-06 | Closing price | 12.609999656677246 |
| 2026-04-07 | Closing price | 12.739999771118164 |
| 2026-04-08 | Closing price | 11.960000038146973 |
| 2026-04-09 | Closing price | 11.779999732971191 |
| 2026-04-10 | Closing price | 12.0600004196167 |
| 2026-04-13 | Closing price | 12.359999656677246 |
| 2026-04-14 | Closing price | 12.079999923706055 |
| 2026-04-15 | Closing price | 12.09000015258789 |
| 2026-04-16 | Closing price | 12.100000381469727 |
| 2026-04-17 | Closing price | 11.529999732971191 |
| 2026-04-20 | Closing price | 11.6899995803833 |
| 2026-04-21 | Closing price | 11.829999923706055 |
| 2026-04-22 | Closing price | 12.329999923706055 |
| 2026-04-23 | Closing price | 12.529999732971191 |
| 2026-04-24 | Closing price | 12.6899995803833 |
| 2026-04-27 | Closing price | 13.1899995803833 |
| 2026-04-28 | Closing price | 13.239999771118164 |
| 2026-04-29 | Closing price | 13.460000038146973 |
| 2026-04-30 | Closing price | 13.420000076293945 |
| 2026-05-01 | Closing price | 13.449999809265137 |
| 2026-05-04 | Closing price | 13.260000228881836 |
| 2026-05-05 | Closing price | 13.329999923706055 |
| 2026-05-06 | Closing price | 12.760000228881836 |
| 2026-05-07 | Closing price | 12.75 |
| 2026-05-08 | Closing price | 12.539999961853027 |
| 2026-05-11 | Closing price | 12.890000343322754 |
| 2026-05-12 | Closing price | 12.979999542236328 |
| 2026-05-13 | Closing price | 12.850000381469727 |
| 2026-05-14 | Closing price | 12.949999809265137 |
| 2026-05-15 | Closing price | 13.300000190734863 |
| 2026-05-19 | Closing price | 13.600000381469727 |
| 2026-05-20 | Closing price | 13.220000267028809 |
| 2026-05-21 | Closing price | 12.9399995803833 |
| 2026-05-22 | Closing price | 12.920000076293945 |
| 2026-05-25 | Closing price | 12.380000114440918 |
| 2026-05-26 | Closing price | 12.470000267028809 |
| 2026-05-27 | Closing price | 12.260000228881836 |
| 2026-05-28 | Closing price | 12.550000190734863 |
| 2026-05-29 | Closing price | 12.539999961853027 |
| 2026-06-01 | Closing price | 12.699999809265137 |
| 2026-06-02 | Closing price | 12.930000305175781 |
| 2026-06-03 | Closing price | 13.0600004196167 |
| 2026-06-04 | Closing price | 13.579999923706055 |
| 2026-06-05 | Closing price | 12.930000305175781 |
| 2026-06-08 | Closing price | 13.479999542236328 |
| 2026-06-09 | Closing price | 12.979999542236328 |
| 2026-06-10 | Closing price | 13.329999923706055 |
| 2026-06-11 | Closing price | 13.199999809265137 |
| 2026-06-12 | Closing price | 12.949999809265137 |
| 2026-06-15 | Closing price | 12.65999984741211 |
| 2026-06-16 | Closing price | 12.430000305175781 |
| 2026-06-17 | Closing price | 12.359999656677246 |
| 2026-06-18 | Closing price | 12.09000015258789 |
| 2026-06-19 | Closing price | 12.260000228881836 |
| 2026-06-22 | Closing price | 12.220000267028809 |
| 2026-06-23 | Closing price | 12.510000228881836 |
| 2026-06-24 | Closing price | 12.09000015258789 |
| 2026-06-25 | Closing price | 12.039999961853027 |
| 2026-06-26 | Closing price | 12.079999923706055 |
| 2026-06-29 | Closing price | 11.989999771118164 |
| 2026-06-30 | Closing price | 11.829999923706055 |
| 2026-07-02 | Closing price | 11.8100004196167 |
| 2026-07-03 | Closing price | 11.90999984741211 |
| 2026-07-06 | Closing price | 11.470000267028809 |
| 2026-07-07 | Closing price | 11.699999809265137 |
| 2026-07-08 | Closing price | 12.359999656677246 |
| 2026-07-09 | Closing price | 12.140000343322754 |
| 2026-07-10 | Closing price | 12.3100004196167 |
| 2026-07-13 | Closing price | 12.699999809265137 |
| 2026-07-14 | Closing price | 12.640000343322754 |
| 2026-07-15 | Closing price | 12.520000457763672 |
| 2026-07-16 | Closing price | 12.569999694824219 |
| 2026-07-17 | Closing price | 12.770000457763672 |
| 2026-07-20 | Closing price | 12.890000343322754 |
| 2026-07-21 | Closing price | 12.920000076293945 |
| 2026-07-22 | Closing price | 13.0600004196167 |
| 2026-07-23 | Closing price | 13.300000190734863 |
| 2026-07-24 | Closing price | 13.470000267028809 |
| 2026-07-27 | Closing price | 13.130000114440918 |
| 2026-07-28 | Closing price | 12.949999809265137 |
| 2026-07-29 | Closing price | 13.399999618530273 |
| 2026-07-30 | Closing price | 13.289999961853027 |
| 2026-07-31 | Closing price | 13.25 |
| 2026-08-04 | Closing price | 12.960000038146973 |
| 2026-08-05 | Closing price | 12.5600004196167 |
| 2026-08-06 | Closing price | 12.699999809265137 |
| 2026-08-07 | Closing price | 12.8100004196167 |
| 2026-08-10 | Closing price | 13.25 |
| 2026-08-11 | Closing price | 13.420000076293945 |
| 2026-08-12 | Closing price | 13.380000114440918 |
| 2026-08-13 | Closing price | 13.229999542236328 |
| 2026-08-14 | Closing price | 13.289999961853027 |
| 2026-08-17 | Closing price | 13.670000076293945 |
| 2026-08-18 | Closing price | 13.789999961853027 |
| 2026-08-19 | Closing price | 13.739999771118164 |
| 2026-08-20 | Closing price | 14.09000015258789 |
| 2026-08-21 | Closing price | 14.220000267028809 |
| 2026-08-24 | Closing price | 14.1899995803833 |
| 2026-08-25 | Closing price | 14.0 |
| 2026-08-26 | Closing price | 14.140000343322754 |
| 2026-08-27 | Closing price | 14.609999656677246 |
| 2026-08-28 | Closing price | 14.300000190734863 |
| 2026-08-31 | Closing price | 14.460000038146973 |
| 2026-09-01 | Closing price | 14.59000015258789 |
| 2026-09-02 | Closing price | 14.4399995803833 |
| 2026-09-03 | Closing price | 14.270000457763672 |
| 2026-09-04 | Closing price | 14.220000267028809 |
| 2026-09-08 | Closing price | 14.029999732971191 |
| 2026-09-09 | Closing price | 13.789999961853027 |
| 2026-09-10 | Closing price | 13.760000228881836 |
| 2026-09-11 | Closing price | 13.510000228881836 |
| 2026-09-14 | Closing price | 13.850000381469727 |
| 2026-09-15 | Closing price | 14.670000076293945 |
| 2026-09-16 | Closing price | 13.979999542236328 |
| 2026-09-17 | Closing price | 13.829999923706055 |
| 2026-09-18 | Closing price | 14.029999732971191 |
| 2026-09-21 | Closing price | 13.5 |
| 2026-09-22 | Closing price | 13.289999961853027 |
| 2026-09-23 | Closing price | 13.3100004196167 |
| 2026-09-24 | Closing price | 13.449999809265137 |
| 2026-09-25 | Closing price | 13.420000076293945 |
| 2026-09-28 | Closing price | 13.479999542236328 |
| 2026-09-29 | Closing price | 13.25 |
| 2026-09-30 | Closing price | 13.380000114440918 |
| 2026-10-01 | Closing price | 13.40999984741211 |
| 2026-10-02 | Closing price | 13.600000381469727 |
| 2026-10-05 | Closing price | 13.65999984741211 |
| 2026-10-06 | Closing price | 13.460000038146973 |
| 2026-10-07 | Closing price | 13.520000457763672 |
| 2026-10-08 | Closing price | 13.880000114440918 |
| 2026-10-09 | Closing price | 13.960000038146973 |
| 2026-10-13 | Closing price | 14.279999732971191 |
| 2026-10-14 | Closing price | 14.300000190734863 |
| 2026-10-15 | Closing price | 14.260000228881836 |
| 2026-10-16 | Closing price | 14.670000076293945 |
| 2026-10-19 | Closing price | 14.989999771118164 |
| 2026-10-20 | Closing price | 14.6899995803833 |
| 2026-10-21 | Closing price | 14.859999656677246 |
| 2026-10-22 | Closing price | 14.729999542236328 |
| 2026-10-23 | Closing price | 15.170000076293945 |
| 2026-10-26 | Closing price | 15.079999923706055 |
| 2026-10-27 | Closing price | 14.779999732971191 |
| 2026-10-28 | Closing price | 14.770000457763672 |
| 2026-10-29 | Closing price | 14.399999618530273 |
| 2026-10-30 | Closing price | 14.210000038146973 |
| 2026-11-02 | Closing price | 13.170000076293945 |
| 2026-11-03 | Closing price | 12.970000267028809 |
| 2026-11-04 | Closing price | 11.800000190734863 |
| 2026-11-05 | Closing price | 11.470000267028809 |
| 2026-11-06 | Closing price | 11.470000267028809 |
| 2026-11-09 | Closing price | 11.289999961853027 |
| 2026-11-10 | Closing price | 11.529999732971191 |
| 2026-11-11 | Closing price | 11.890000343322754 |
| 2026-11-12 | Closing price | 11.970000267028809 |
| 2026-11-13 | Closing price | 11.979999542236328 |
| 2026-11-16 | Closing price | 11.600000381469727 |
EV/EBITDA LTM of 8.0 against its own three-year average of 4.9 – a 63% premium
EV/EBITDA for the trailing twelve months is 8.0 against its own three-year average of 4.9, a 63% premium. P/E LTM is 18.2 and ROE 32.4%. On the multiple the share is more expensive than it was on average over three years.
At current prices the portal's spot model gives annual EBITDA of USD 328.7m against USD 289.4m for the trailing twelve months (+13.6%) and EV/EBITDA of 5.8. That is below the historical average but still above where the company traded at the previous quarter's price.
The portal's model puts fair value 11% below the current price. This is our own calculation, not a consensus: it rests on current prices and a target multiple. At WTI of USD 85 and EV/EBITDA of 5.8 the margin of safety is negative, and the share needs either a higher oil price or lower costs to rise.
Valuation on the latest reported figures
| Metric | Value |
|---|---|
| Market cap | 1.99 bn USD |
| P/E (LTM) | 18.2 |
| EV/EBITDA (LTM) | 8.0 |
| P/B | 3.65 |
| Net debt / EBITDA (LTM) | -0.35 |
| ROE | 32.4% |
| Dividend yield (12m) | 4.0% |
| EV/EBITDA, 3-year average | 4.9 |
Net profit by quarter
| Period | Measure | bn USD |
|---|---|---|
| Q4 2024 | Net profit | 0.034975 |
| Q1 2025 | Net profit | 0.034755 |
| Q2 2025 | Net profit | 0.027495000000000002 |
| Q4 2025 | Net profit | 0.021061 |
| Q1 2026 | Net profit | 0.025854 |
| Q2 2026 | Net profit | 0.061433999999999996 |
| Q3 2026 | Net profit | 0.047477 |
Bottom line
The strength of the report remains the balance sheet: net cash of USD 84.1m and net debt to EBITDA of -0.35, with operating cash flow of USD 87.9m covering capital expenditure of USD 44.1m and the dividend. The weak spot is the conversion of price into profit: at WTI of USD 85.4 EBITDA of USD 84.1m came in below the price-implied USD 87.0m while revenue was USD 12.3m above it, so volume growth did not reach profit. The valuation does not forgive this: EV/EBITDA of 8.0 against its own three-year average of 4.9 is a 63% premium, and on the portal's model the share trades 11% above modelled fair value. Our conclusion: rather unattractive – the margin of safety is negative, and closing it requires either a WTI price above USD 90 or a sustained reduction in unit costs. Our view: the share is rather unattractive at the current price; upside on the portal model -11%.