Journey Energy: WTI up 31.7% yet revenue rose only 9.4% – EBITDA grew 66.2% on margin, not volume
Contents
On 13 November Journey Energy released its third-quarter 2026 results. The average WTI price in the period was USD 85.4 versus USD 64.9 a year earlier (+31.7%), Henry Hub gas fell 6.2% to USD 2.893, propane rose 5.8% to USD 0.73. At those prices with year-ago volumes and costs, revenue should have been USD 45.6m and EBITDA USD 21.4m; actual revenue was USD 42.34m (–7.2% versus implied) and EBITDA USD 24.019m (+12.3% versus implied), with net profit of USD 11.983m. Our verdict: rather attractive – the portal model puts the upside to fair value at +22%, with EV/EBITDA at 5.0 versus its own three-year average of 3.8. Our view: the share is rather attractive at the current price; upside on the portal model +22%.
Our view: is there upside
Our view in numbers
| Metric | Our read |
|---|---|
| Verdict | Rather attractive |
| Upside on the portal model | +22% |
| How the model works | spot model: EBITDA re-priced to current commodity prices at the target EV/EBITDA, against market cap |
| EV/EBITDA now and 3-year average | 5.0 vs 3.8 – a 31% premium to its history |
| Net debt / EBITDA | 0.58 – low leverage |
| Strongest case for | On the portal spot model EBITDA at current prices is USD 70.9m versus USD 54.7m LTM, and EV/EBITDA is 3.5, giving the share +22% upside. |
| Strongest case against | EV/EBITDA LTM of 5.0 is 31% above its own three-year average of 3.8, and capex of USD 29.136m exceeds operating cash flow of USD 11.343m. |
| What would change the view | The verdict would drop a step if WTI fell to the year-ago USD 64.9, and rise if the price held above USD 85.4 with costs at the current level. |
Key takeaways
— WTI rose 31.7% year on year, yet revenue added only 9.4% – volume and realisations ate part of the price
— At the year-ago volumes and costs EBITDA should have been USD 21.4m; it came in at USD 24.019m – the USD 2.6m gap came from costs, not price
— The EBITDA margin rose from 37.4% to 56.7%, a consequence of the cost structure rather than production growth
— Net profit of USD 11.983m at a 28.3% margin versus 8.3% a year earlier – operating leverage worked in full
— Leverage at 0.58x LTM EBITDA is moderate, but the direction is not disclosed
— EV/EBITDA at 5.0 versus its own three-year average of 3.8 – the stock is 31% above its own history
— On the portal spot model EBITDA at current prices is USD 70.9m versus USD 54.7m LTM, and EV/EBITDA is 3.5
Key figures, USD bn
| Metric | Q3 2025 | Q3 2026 | Change |
|---|---|---|---|
| Revenue | 0.04 | 0.04 | +9.4% |
| EBITDA | 0.01 | 0.02 | +66.2% |
| Operating profit | 0.00 | 0.01 | +157.6% |
| Net profit | 0.00 | 0.01 | +272.0% |
| Operating cash flow | 0.01 | 0.01 | +22.3% |
| EBITDA margin | 37.4% | 56.7% | +19.3 pp |
| Net margin | 8.3% | 28.3% | +20.0 pp |
WTI rose 31.7% year on year, yet revenue added only 9.4% – volume and realisations ate part of the price
The average WTI price in Q3 2026 was USD 85.4 versus USD 64.9 a year earlier, up 31.7%. Henry Hub gas fell 6.2% to USD 2.893, propane rose 5.8% to USD 0.73. In the portal model oil accounts for 60% of revenue, gas 25% and propane 8%, so the oil price sets the tone.
Revenue for the quarter was USD 42.34m, only 9.4% above the USD 38.691m of a year earlier. At year-ago volumes and costs and the new prices, our calculation puts revenue at USD 45.6m, USD 3.3m above the actual. The gap is explained by volume and by the realised price versus the benchmark – the causes named in the source; the facts give no others.
The quarterly trend matters too: in Q2 2026 revenue grew 37.5% year on year, in Q3 only 9.4% – a deceleration. WTI fell 7.9% quarter on quarter, from USD 92.8 in the previous quarter to USD 85.4 in the reported one. Spot is now USD 88.6, 3.7% above the period average.
Commodity prices: period average and now
| Benchmark | Year ago | Q3 2026 | YoY | Spot 2026-11-13 |
|---|---|---|---|---|
| WTI, USD | 64,9 | 85,4 | +31,7% | 88,6 |
| Henry Hub, USD | 3,08 | 2,89 | -6,2% | 3,27 |
| Propane, USD | 0,69 | 0,73 | +5,8% | 1,06 |
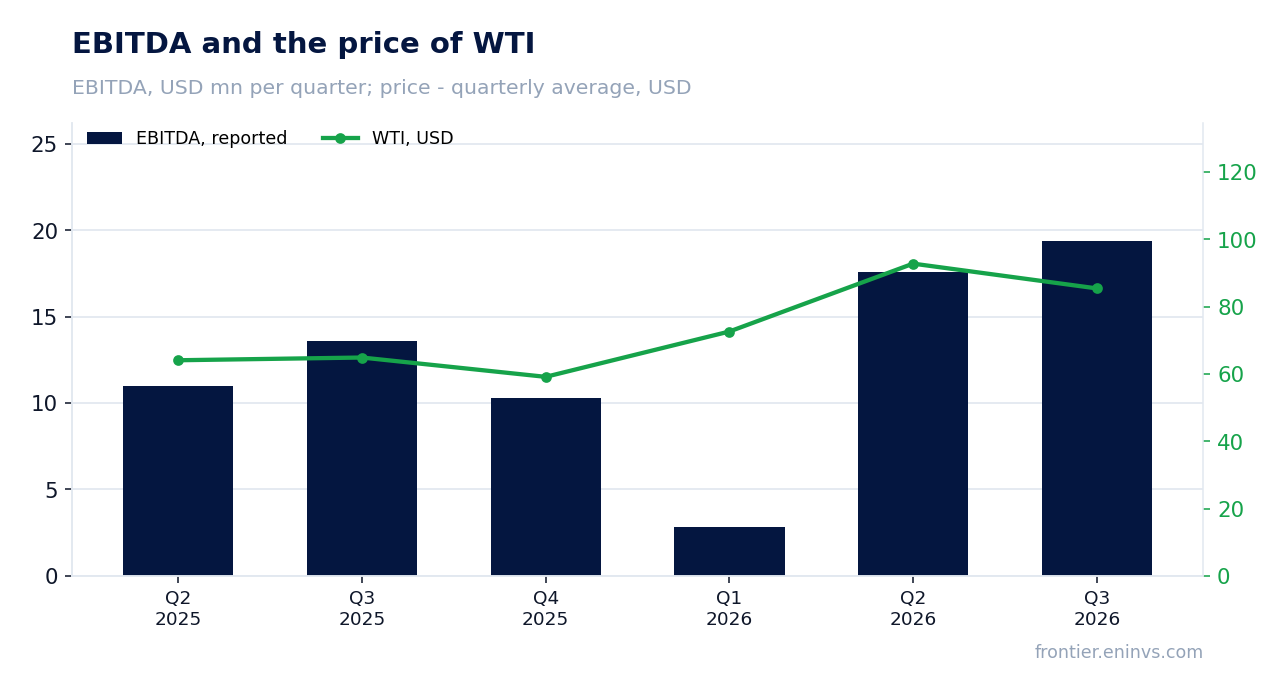
At the year-ago volumes and costs EBITDA should have been USD 21.4m; it came in at USD 24.019m – the USD 2.6m gap came from costs, not price
At Q3 2025 volumes and non-commodity costs and the reported period's prices, our calculation puts EBITDA at USD 21.4m. Actual EBITDA was USD 24.019m, USD 2.6m or 12.3% higher. The company earned more than the price allowed, and the source is costs, not realisations.
The comparison with the previous quarter confirms it: at Q2 2026 volumes and costs and Q3 prices EBITDA should have been USD 14.9m, but came in at USD 24.019m – USD 9.1m or 61.1% higher. WTI fell 7.9% quarter on quarter, so the entire gain came from costs.
Year on year EBITDA rose 66.2% on revenue growth of 9.4%. Such a gap is only possible with a sharp fall in unit costs or one-offs in the base. The facts name no one-offs, so we state it plainly: costs fell, and that is the main source of the result.
What the prices implied and what the company earned
| Base (Q3 2025) | Implied at period prices | Reported | Reported vs implied | |
|---|---|---|---|---|
| Revenue, USD mn | 38,7 | 45,6 | 42,3 | -7,2% |
| EBITDA, USD mn | 14,5 | 21,4 | 24,0 | +12,3% |
Revenue and EBITDA by quarter
| Period | Measure | bn USD |
|---|---|---|
| Q2 2025 | Revenue | 0.033808 |
| Q3 2025 | Revenue | 0.038691 |
| Q4 2025 | Revenue | 0.034074 |
| Q1 2026 | Revenue | 0.035931 |
| Q2 2026 | Revenue | 0.046494999999999995 |
| Q3 2026 | Revenue | 0.04234 |
| Q2 2025 | EBITDA | 0.010984 |
| Q3 2025 | EBITDA | 0.013585000000000002 |
| Q4 2025 | EBITDA | 0.01027 |
| Q1 2026 | EBITDA | 0.0028529999999999996 |
| Q2 2026 | EBITDA | 0.017572 |
| Q3 2026 | EBITDA | 0.019406 |
EBITDA margin
| Period | Measure | % |
|---|---|---|
| Q2 2025 | EBITDA margin | 32.5 |
| Q3 2025 | EBITDA margin | 35.1 |
| Q4 2025 | EBITDA margin | 30.1 |
| Q1 2026 | EBITDA margin | 7.9 |
| Q2 2026 | EBITDA margin | 37.8 |
| Q3 2026 | EBITDA margin | 45.8 |
The EBITDA margin rose from 37.4% to 56.7%, a consequence of the cost structure rather than production growth
The EBITDA margin in the reported quarter was 56.7% versus 37.4% a year earlier. A 19.3 percentage point rise on revenue growth of only 9.4% means unit costs fell. This is consistent with the calculation above: EBITDA was 12.3% above the price-implied level.
The net margin rose from 8.3% to 28.3%, with net profit of USD 11.983m versus USD 3.221m a year earlier, up 272.0%. Operating profit was USD 12.09m versus USD 4.694m. Operating leverage worked in full: a modest revenue gain produced a multiple increase in profit.
The sustainability of that margin is the main question. If the cost decline came from one-offs, the margin will normalise next quarter. The facts name no one-offs, so we record the level and wait for confirmation in the next report.
Net profit of USD 11.983m at a 28.3% margin versus 8.3% a year earlier – operating leverage worked in full
Net profit for Q3 2026 was USD 11.983m versus USD 3.221m a year earlier, up 272.0%. On revenue of USD 42.34m the net margin is 28.3%. Operating profit of USD 12.09m is almost equal to net profit, pointing to a small gap between operating and bottom-line results.
Over the trailing twelve months net profit was USD 28.0m on revenue of USD 158.8m and EBITDA of USD 51.3m. That is the base for the multiples: P/E LTM 7.8, EV/EBITDA LTM 5.0. Return on equity is 18.0%.
The gap between quarterly and annual profit is explained by a weak Q1 2026, when the company posted a loss of USD 4.252m on EBITDA of USD 2.853m. Q2 and Q3 made up for it, and LTM came out at USD 28.0m.
Leverage at 0.58x LTM EBITDA is moderate, but the direction is not disclosed
Net debt at 30 September 2026 was USD 29.908m against LTM EBITDA of USD 51.3m, a ratio of 0.58. That is a moderate level: debt is less than half of annual EBITDA. The direction of change is not disclosed, so we record the level only.
Operating cash flow for the quarter was USD 11.343m versus USD 9.271m a year earlier. Over the trailing twelve months it was USD 45.0m. Against LTM EBITDA of USD 51.3m, cash conversion is high, which is normal for a producer with a moderate capex programme.
Capex for the quarter was USD 29.136m, more than operating cash flow. The company spent USD 29.136m on investment against a flow of USD 11.343m, covering the gap from other sources. That is the main risk for debt: if capex stays at this level, free cash flow turns negative.
Valuation vs its own history
now vs the 3-year average
| Period | Measure | × |
|---|---|---|
| EV/EBITDA | Now | 4.982955034941986 |
| EV/EBITDA | 3-year average | 3.817206884542493 |
EV/EBITDA at 5.0 versus its own three-year average of 3.8 – the stock is 31% above its own history
EV/EBITDA LTM is 5.0 against its own three-year average of 3.8, i.e. 31% above. On this multiple the stock is more expensive than its own history. P/E LTM is 7.8, which with an 18.0% return on equity looks inexpensive, but the facts give no history for P/E.
Market capitalisation is USD 219.743m. With net debt of USD 29.908m, EV is about USD 249.651m. On LTM EBITDA of USD 51.3m, EV/EBITDA is 4.87, close to the stated 5.0. The difference may be rounding or the LTM base.
On the portal model, EBITDA at current prices is USD 70.9m versus USD 54.7m LTM, up 29.5%. EV/EBITDA at current prices is 3.5, and net debt to EBITDA is 0.42. That means at current prices the stock is cheaper than on LTM, and the model gives +22% upside.
Share price, three years
close, last point 2026-11-12
| Period | Measure | USD per share |
|---|---|---|
| 2025-11-12 | Closing price | 4.099999904632568 |
| 2025-11-13 | Closing price | 3.9600000381469727 |
| 2025-11-14 | Closing price | 4.0 |
| 2025-11-17 | Closing price | 3.9200000762939453 |
| 2025-11-18 | Closing price | 4.03000020980835 |
| 2025-11-19 | Closing price | 4.03000020980835 |
| 2025-11-20 | Closing price | 3.9800000190734863 |
| 2025-11-21 | Closing price | 3.9100000858306885 |
| 2025-11-24 | Closing price | 3.9700000286102295 |
| 2025-11-25 | Closing price | 3.8499999046325684 |
| 2025-11-26 | Closing price | 3.8499999046325684 |
| 2025-11-27 | Closing price | 3.8499999046325684 |
| 2025-11-28 | Closing price | 3.940000057220459 |
| 2025-12-01 | Closing price | 3.869999885559082 |
| 2025-12-02 | Closing price | 3.8399999141693115 |
| 2025-12-03 | Closing price | 3.859999895095825 |
| 2025-12-04 | Closing price | 3.809999942779541 |
| 2025-12-05 | Closing price | 3.75 |
| 2025-12-08 | Closing price | 3.6500000953674316 |
| 2025-12-09 | Closing price | 3.5399999618530273 |
| 2025-12-10 | Closing price | 3.4700000286102295 |
| 2025-12-11 | Closing price | 3.5 |
| 2025-12-12 | Closing price | 3.4600000381469727 |
| 2025-12-15 | Closing price | 3.4100000858306885 |
| 2025-12-16 | Closing price | 3.200000047683716 |
| 2025-12-17 | Closing price | 3.1500000953674316 |
| 2025-12-18 | Closing price | 3.0799999237060547 |
| 2025-12-19 | Closing price | 3.1500000953674316 |
| 2025-12-22 | Closing price | 3.119999885559082 |
| 2025-12-23 | Closing price | 3.130000114440918 |
| 2025-12-24 | Closing price | 3.059999942779541 |
| 2025-12-29 | Closing price | 3.0999999046325684 |
| 2025-12-30 | Closing price | 3.1700000762939453 |
| 2025-12-31 | Closing price | 3.180000066757202 |
| 2026-01-02 | Closing price | 3.4800000190734863 |
| 2026-01-05 | Closing price | 3.3499999046325684 |
| 2026-01-06 | Closing price | 3.2799999713897705 |
| 2026-01-07 | Closing price | 3.0399999618530273 |
| 2026-01-08 | Closing price | 3.190000057220459 |
| 2026-01-09 | Closing price | 3.1600000858306885 |
| 2026-01-12 | Closing price | 3.1500000953674316 |
| 2026-01-13 | Closing price | 3.180000066757202 |
| 2026-01-14 | Closing price | 3.190000057220459 |
| 2026-01-15 | Closing price | 3.240000009536743 |
| 2026-01-16 | Closing price | 3.200000047683716 |
| 2026-01-19 | Closing price | 3.2300000190734863 |
| 2026-01-20 | Closing price | 3.2899999618530273 |
| 2026-01-21 | Closing price | 3.450000047683716 |
| 2026-01-22 | Closing price | 3.4200000762939453 |
| 2026-01-23 | Closing price | 3.440000057220459 |
| 2026-01-26 | Closing price | 3.4200000762939453 |
| 2026-01-27 | Closing price | 3.5 |
| 2026-01-28 | Closing price | 3.509999990463257 |
| 2026-01-29 | Closing price | 3.5899999141693115 |
| 2026-01-30 | Closing price | 3.490000009536743 |
| 2026-02-02 | Closing price | 3.319999933242798 |
| 2026-02-03 | Closing price | 3.4000000953674316 |
| 2026-02-04 | Closing price | 3.490000009536743 |
| 2026-02-05 | Closing price | 3.309999942779541 |
| 2026-02-06 | Closing price | 3.390000104904175 |
| 2026-02-09 | Closing price | 3.4700000286102295 |
| 2026-02-10 | Closing price | 3.450000047683716 |
| 2026-02-11 | Closing price | 3.559999942779541 |
| 2026-02-12 | Closing price | 3.7699999809265137 |
| 2026-02-13 | Closing price | 3.859999895095825 |
| 2026-02-17 | Closing price | 3.75 |
| 2026-02-18 | Closing price | 3.940000057220459 |
| 2026-02-19 | Closing price | 3.990000009536743 |
| 2026-02-20 | Closing price | 4.039999961853027 |
| 2026-02-23 | Closing price | 4.070000171661377 |
| 2026-02-24 | Closing price | 4.179999828338623 |
| 2026-02-25 | Closing price | 4.039999961853027 |
| 2026-02-26 | Closing price | 4.099999904632568 |
| 2026-02-27 | Closing price | 4.110000133514404 |
| 2026-03-02 | Closing price | 4.300000190734863 |
| 2026-03-03 | Closing price | 4.239999771118164 |
| 2026-03-04 | Closing price | 4.380000114440918 |
| 2026-03-05 | Closing price | 4.489999771118164 |
| 2026-03-06 | Closing price | 4.46999979019165 |
| 2026-03-09 | Closing price | 4.289999961853027 |
| 2026-03-10 | Closing price | 4.300000190734863 |
| 2026-03-11 | Closing price | 4.420000076293945 |
| 2026-03-12 | Closing price | 4.940000057220459 |
| 2026-03-13 | Closing price | 5.099999904632568 |
| 2026-03-16 | Closing price | 4.989999771118164 |
| 2026-03-17 | Closing price | 5.03000020980835 |
| 2026-03-18 | Closing price | 5.329999923706055 |
| 2026-03-19 | Closing price | 5.369999885559082 |
| 2026-03-20 | Closing price | 5.429999828338623 |
| 2026-03-23 | Closing price | 5.78000020980835 |
| 2026-03-24 | Closing price | 6.0 |
| 2026-03-25 | Closing price | 5.639999866485596 |
| 2026-03-26 | Closing price | 5.670000076293945 |
| 2026-03-27 | Closing price | 5.710000038146973 |
| 2026-03-30 | Closing price | 5.550000190734863 |
| 2026-03-31 | Closing price | 5.449999809265137 |
| 2026-04-01 | Closing price | 4.889999866485596 |
| 2026-04-02 | Closing price | 5.170000076293945 |
| 2026-04-06 | Closing price | 5.019999980926514 |
| 2026-04-07 | Closing price | 5.289999961853027 |
| 2026-04-08 | Closing price | 5.010000228881836 |
| 2026-04-09 | Closing price | 4.96999979019165 |
| 2026-04-10 | Closing price | 4.920000076293945 |
| 2026-04-13 | Closing price | 4.980000019073486 |
| 2026-04-14 | Closing price | 4.820000171661377 |
| 2026-04-15 | Closing price | 4.829999923706055 |
| 2026-04-16 | Closing price | 5.039999961853027 |
| 2026-04-17 | Closing price | 4.739999771118164 |
| 2026-04-20 | Closing price | 4.800000190734863 |
| 2026-04-21 | Closing price | 5.03000020980835 |
| 2026-04-22 | Closing price | 5.119999885559082 |
| 2026-04-23 | Closing price | 5.170000076293945 |
| 2026-04-24 | Closing price | 5.099999904632568 |
| 2026-04-27 | Closing price | 5.21999979019165 |
| 2026-04-28 | Closing price | 5.28000020980835 |
| 2026-04-29 | Closing price | 5.460000038146973 |
| 2026-04-30 | Closing price | 5.769999980926514 |
| 2026-05-01 | Closing price | 5.679999828338623 |
| 2026-05-04 | Closing price | 5.96999979019165 |
| 2026-05-05 | Closing price | 6.230000019073486 |
| 2026-05-06 | Closing price | 6.619999885559082 |
| 2026-05-07 | Closing price | 6.630000114440918 |
| 2026-05-08 | Closing price | 6.269999980926514 |
| 2026-05-11 | Closing price | 6.570000171661377 |
| 2026-05-12 | Closing price | 6.369999885559082 |
| 2026-05-13 | Closing price | 6.239999771118164 |
| 2026-05-14 | Closing price | 6.28000020980835 |
| 2026-05-15 | Closing price | 6.53000020980835 |
| 2026-05-19 | Closing price | 6.369999885559082 |
| 2026-05-20 | Closing price | 6.179999828338623 |
| 2026-05-21 | Closing price | 6.110000133514404 |
| 2026-05-22 | Closing price | 6.0 |
| 2026-05-25 | Closing price | 5.690000057220459 |
| 2026-05-26 | Closing price | 5.679999828338623 |
| 2026-05-27 | Closing price | 5.71999979019165 |
| 2026-05-28 | Closing price | 5.619999885559082 |
| 2026-05-29 | Closing price | 5.519999980926514 |
| 2026-06-01 | Closing price | 5.920000076293945 |
| 2026-06-02 | Closing price | 6.039999961853027 |
| 2026-06-03 | Closing price | 6.099999904632568 |
| 2026-06-04 | Closing price | 6.130000114440918 |
| 2026-06-05 | Closing price | 5.71999979019165 |
| 2026-06-08 | Closing price | 5.849999904632568 |
| 2026-06-09 | Closing price | 5.489999771118164 |
| 2026-06-10 | Closing price | 5.590000152587891 |
| 2026-06-11 | Closing price | 5.53000020980835 |
| 2026-06-12 | Closing price | 5.460000038146973 |
| 2026-06-15 | Closing price | 5.110000133514404 |
| 2026-06-16 | Closing price | 4.849999904632568 |
| 2026-06-17 | Closing price | 4.769999980926514 |
| 2026-06-18 | Closing price | 4.659999847412109 |
| 2026-06-19 | Closing price | 4.630000114440918 |
| 2026-06-22 | Closing price | 4.619999885559082 |
| 2026-06-23 | Closing price | 4.590000152587891 |
| 2026-06-24 | Closing price | 4.360000133514404 |
| 2026-06-25 | Closing price | 4.349999904632568 |
| 2026-06-26 | Closing price | 4.28000020980835 |
| 2026-06-29 | Closing price | 4.21999979019165 |
| 2026-06-30 | Closing price | 4.090000152587891 |
| 2026-07-02 | Closing price | 4.119999885559082 |
| 2026-07-03 | Closing price | 4.099999904632568 |
| 2026-07-06 | Closing price | 3.9800000190734863 |
| 2026-07-07 | Closing price | 4.25 |
| 2026-07-08 | Closing price | 4.28000020980835 |
| 2026-07-09 | Closing price | 4.099999904632568 |
| 2026-07-10 | Closing price | 4.050000190734863 |
| 2026-07-13 | Closing price | 4.230000019073486 |
| 2026-07-14 | Closing price | 4.230000019073486 |
| 2026-07-15 | Closing price | 4.309999942779541 |
| 2026-07-16 | Closing price | 4.230000019073486 |
| 2026-07-17 | Closing price | 4.349999904632568 |
| 2026-07-20 | Closing price | 4.420000076293945 |
| 2026-07-21 | Closing price | 4.480000019073486 |
| 2026-07-22 | Closing price | 4.519999980926514 |
| 2026-07-23 | Closing price | 4.670000076293945 |
| 2026-07-24 | Closing price | 4.539999961853027 |
| 2026-07-27 | Closing price | 4.25 |
| 2026-07-28 | Closing price | 4.050000190734863 |
| 2026-07-29 | Closing price | 4.230000019073486 |
| 2026-07-30 | Closing price | 4.400000095367432 |
| 2026-07-31 | Closing price | 4.5 |
| 2026-08-04 | Closing price | 4.349999904632568 |
| 2026-08-05 | Closing price | 4.159999847412109 |
| 2026-08-06 | Closing price | 4.289999961853027 |
| 2026-08-07 | Closing price | 4.619999885559082 |
| 2026-08-10 | Closing price | 4.980000019073486 |
| 2026-08-11 | Closing price | 5.150000095367432 |
| 2026-08-12 | Closing price | 5.139999866485596 |
| 2026-08-13 | Closing price | 5.539999961853027 |
| 2026-08-14 | Closing price | 5.429999828338623 |
| 2026-08-17 | Closing price | 5.820000171661377 |
| 2026-08-18 | Closing price | 5.960000038146973 |
| 2026-08-19 | Closing price | 6.019999980926514 |
| 2026-08-20 | Closing price | 6.260000228881836 |
| 2026-08-21 | Closing price | 6.400000095367432 |
| 2026-08-24 | Closing price | 6.050000190734863 |
| 2026-08-25 | Closing price | 5.820000171661377 |
| 2026-08-26 | Closing price | 5.880000114440918 |
| 2026-08-27 | Closing price | 6.090000152587891 |
| 2026-08-28 | Closing price | 5.960000038146973 |
| 2026-08-31 | Closing price | 5.869999885559082 |
| 2026-09-01 | Closing price | 5.96999979019165 |
| 2026-09-02 | Closing price | 5.949999809265137 |
| 2026-09-03 | Closing price | 5.889999866485596 |
| 2026-09-04 | Closing price | 5.75 |
| 2026-09-08 | Closing price | 5.809999942779541 |
| 2026-09-09 | Closing price | 6.010000228881836 |
| 2026-09-10 | Closing price | 6.0 |
| 2026-09-11 | Closing price | 6.130000114440918 |
| 2026-09-14 | Closing price | 5.920000076293945 |
| 2026-09-15 | Closing price | 5.989999771118164 |
| 2026-09-16 | Closing price | 5.78000020980835 |
| 2026-09-17 | Closing price | 5.829999923706055 |
| 2026-09-18 | Closing price | 5.769999980926514 |
| 2026-09-21 | Closing price | 5.429999828338623 |
| 2026-09-22 | Closing price | 5.309999942779541 |
| 2026-09-23 | Closing price | 5.289999961853027 |
| 2026-09-24 | Closing price | 5.360000133514404 |
| 2026-09-25 | Closing price | 5.239999771118164 |
| 2026-09-28 | Closing price | 5.150000095367432 |
| 2026-09-29 | Closing price | 4.949999809265137 |
| 2026-09-30 | Closing price | 5.019999980926514 |
| 2026-10-01 | Closing price | 5.0 |
| 2026-10-02 | Closing price | 4.989999771118164 |
| 2026-10-05 | Closing price | 5.119999885559082 |
| 2026-10-06 | Closing price | 5.190000057220459 |
| 2026-10-07 | Closing price | 5.239999771118164 |
| 2026-10-08 | Closing price | 5.389999866485596 |
| 2026-10-09 | Closing price | 5.449999809265137 |
| 2026-10-13 | Closing price | 5.570000171661377 |
| 2026-10-14 | Closing price | 5.570000171661377 |
| 2026-10-15 | Closing price | 5.639999866485596 |
| 2026-10-16 | Closing price | 5.630000114440918 |
| 2026-10-19 | Closing price | 5.71999979019165 |
| 2026-10-20 | Closing price | 5.630000114440918 |
| 2026-10-21 | Closing price | 5.670000076293945 |
| 2026-10-22 | Closing price | 5.619999885559082 |
| 2026-10-23 | Closing price | 5.769999980926514 |
| 2026-10-26 | Closing price | 5.889999866485596 |
| 2026-10-27 | Closing price | 5.599999904632568 |
| 2026-10-28 | Closing price | 5.75 |
| 2026-10-29 | Closing price | 5.630000114440918 |
| 2026-10-30 | Closing price | 5.599999904632568 |
| 2026-11-02 | Closing price | 4.960000038146973 |
| 2026-11-03 | Closing price | 5.019999980926514 |
| 2026-11-04 | Closing price | 4.53000020980835 |
| 2026-11-05 | Closing price | 4.389999866485596 |
| 2026-11-06 | Closing price | 4.699999809265137 |
| 2026-11-09 | Closing price | 4.639999866485596 |
| 2026-11-10 | Closing price | 4.639999866485596 |
| 2026-11-11 | Closing price | 4.739999771118164 |
| 2026-11-12 | Closing price | 4.739999771118164 |
On the portal spot model EBITDA at current prices is USD 70.9m versus USD 54.7m LTM, and EV/EBITDA is 3.5
The portal spot model re-prices EBITDA to current prices: WTI USD 88.6, Henry Hub USD 3.27, propane USD 1.061. At those prices annual EBITDA is USD 70.9m versus USD 54.7m LTM, up 29.5%. That is the base the valuation should start from, because LTM was earned at past prices.
EV/EBITDA at current prices is 3.5, and net debt to EBITDA is 0.42. Reserve life is 21 years at the current production rate. For a producer with that cover and low leverage, a multiple of 3.5 looks modest.
The portal model puts the upside to fair value at +22%. That is our own estimate, not a market consensus. It rests on current prices and a target EV/EBITDA, so if prices fall the upside shrinks.
Valuation on the latest reported figures
| Metric | Value |
|---|---|
| Market cap | 0.22 bn USD |
| P/E (LTM) | 7.8 |
| EV/EBITDA (LTM) | 5.0 |
| P/B | 0.85 |
| Net debt / EBITDA (LTM) | 0.58 |
| Operating cash flow (LTM) | 0.04 bn |
| ROE | 18.0% |
| EV/EBITDA, 3-year average | 3.8 |
Net profit by quarter
| Period | Measure | bn USD |
|---|---|---|
| Q2 2025 | Net profit | 0.002939 |
| Q3 2025 | Net profit | 0.003221 |
| Q4 2025 | Net profit | 0.0069619999999999994 |
| Q1 2026 | Net profit | −0.004252 |
| Q2 2026 | Net profit | 0.013312 |
| Q3 2026 | Net profit | 0.011983 |
Bottom line
What was strong in the report was not revenue, which added only 9.4%, but the margin: EBITDA rose 66.2%, net profit 272.0%, and by our calculation the company earned USD 2.6m more than the price allowed. What was weak was capex of USD 29.136m against operating cash flow of USD 11.343m and the undisclosed direction of debt. The question for a holder now is whether the cost decline is sustainable and whether capex will eat free cash flow. Our verdict: rather attractive – the portal model gives +22% upside, with EV/EBITDA at 5.0 versus its own three-year average of 3.8. Our view: the share is rather attractive at the current price; upside on the portal model +22%.