Lithium Americas: the $74.7m profit is warrant remeasurement, not cash
Contents
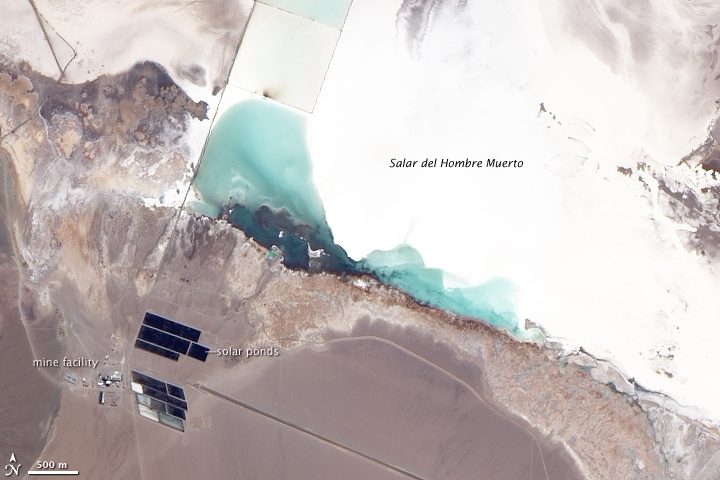
On November 12 Lithium Americas reported third-quarter 2026 results. The operating loss was $9.26m and the operating business remains loss-making, yet net profit turned positive at $74.669m – driven not by operations but by remeasurement of the warrants and the embedded derivative as the share price fell from $3.85 to $2.63. Operating cash flow was positive at $2.692m for the quarter, but capital expenditure was $407.504m and net debt stood at $355.868m at September 30. Our conclusion: rather unattractive – at a P/E LTM of 3.43 the profit is almost entirely paper, and Thacker Pass needs roughly $995m of additional funding. Our view: the share is rather unattractive at the current price.
Our view: is there upside
Our view in numbers
| Metric | Our read |
|---|---|
| Verdict | Rather unattractive |
| Upside on the portal model | no portal model for this share |
| Strongest case for | Construction is on schedule: engineering complete, procurement above 90%, 4.7 million workhours without a serious injury, and quarterly operating cash flow positive at $2.692m. |
| Strongest case against | The $74.7m profit is paper, there is no revenue, and about $995m is still needed to complete the project, threatening shareholder dilution. |
| What would change the view | The verdict would improve if the company secures the additional $995m without equity issuance and confirms the $3.83bn estimate; it would worsen on another cost overrun or a fall in the lithium price. |
Key takeaways
— The $74.7m profit came from warrant and derivative remeasurement, not operations
— The $9.26m operating loss barely moved and there is still no revenue
— $407.5m of quarterly capex is construction, not investment in revenue growth
— $355.9m of net debt against a $599.0m market cap weighs on future earnings
— The Thacker Pass estimate rose to $3.83bn, and $995m of it is still unfunded
— The 3.43 P/E LTM is misleading: it is built on paper remeasurement gains
Key figures, USD bn
| Metric | Q3 2025 | Q3 2026 | Change |
|---|---|---|---|
| Revenue | 0.00 | — | — |
| EBITDA | -0.01 | — | — |
| Operating profit | -0.01 | -0.01 | — |
| Net profit | -0.20 | 0.07 | to profit |
| Operating cash flow | 0.00 | 0.00 | +16.4% |
| Capex | 0.17 | -0.41 | -336.7% |
The $74.7m profit came from warrant and derivative remeasurement, not operations
Net profit for Q3 2026 was $74.669m against a $197.684m loss a year earlier. The $272.4m swing is almost entirely explained by remeasurement of financial instruments. The quarter recognised a $53.6m gain on the change in fair value of the JV warrant and $39.3m on the embedded derivative of the Orion notes – both because the share price fell from $3.85 on June 30 to $2.63 on September 30.
A year earlier the effect was the opposite: a $193.8m loss on remeasuring the same derivative as the share price rose from $2.68 to $5.71. So both this quarter's profit and last year's loss are not business results but the accounting mirror of the company's own share price. The operating side stayed loss-making: an operating loss of $9.26m against $9.704m a year earlier.
For an investor this means the $74.7m profit is not backed by cash flow and is not repeatable. It will shrink or vanish if the share price rises, as already happened in Q3 2025. The company cannot be valued on this profit.
Revenue and EBITDA by quarter
| Period | Measure | bn USD |
|---|---|---|
| Q4 2024 | Revenue | −0.0001 |
| Q1 2025 | Revenue | 0.0 |
| Q2 2025 | Revenue | 0.0 |
| Q3 2025 | Revenue | 0.0 |
| Q4 2025 | Revenue | 0.0 |
| Q1 2026 | Revenue | 0.0 |
| Q2 2026 | Revenue | 0.0 |
| Q4 2024 | EBITDA | −0.02 |
| Q1 2025 | EBITDA | −0.006271 |
| Q2 2025 | EBITDA | −0.007579 |
| Q3 2025 | EBITDA | −0.009436 |
| Q4 2025 | EBITDA | −0.028509 |
| Q1 2026 | EBITDA | −0.01077 |
| Q2 2026 | EBITDA | −0.014902999999999998 |
The $9.26m operating loss barely moved and there is still no revenue
The operating loss for Q3 2026 was $9.26m against $9.704m a year earlier, a change within 5%. There is no revenue: the company has not started production, and Thacker Pass is still under construction. General and administrative expenses were $9.3m for the quarter, roughly flat year on year, while transaction costs rose to $7.3m from $0.6m – mainly advisory fees for the Yorkville debentures.
For the nine months of 2026, G&A expenses were $35.5m against $24.1m a year earlier – up $11.4m on hiring, share-based compensation, community investment and regulatory fees. These are costs for future construction, not for current revenue.
With no revenue and no operating profit, the only measurable result is the speed and cost of construction. The $9.26m operating loss is small in itself, but it shows the company is still far from the point where the project starts generating money.
Net profit by quarter
| Period | Measure | bn USD |
|---|---|---|
| Q4 2024 | Net profit | −0.021172999999999997 |
| Q1 2025 | Net profit | −0.010702 |
| Q2 2025 | Net profit | −0.012447 |
| Q3 2025 | Net profit | −0.197684 |
| Q4 2025 | Net profit | 0.098746 |
| Q1 2026 | Net profit | −0.00040899999999999997 |
| Q2 2026 | Net profit | 0.0016619999999999998 |
| Q3 2026 | Net profit | 0.074669 |
$407.5m of quarterly capex is construction, not investment in revenue growth
Capital expenditure for Q3 2026 was $407.504m – the company's largest expense line. Operating cash flow for the quarter was positive at $2.692m, but it is not comparable with the scale of construction: every dollar of operating cash flow is matched by roughly $150 of capex. For the nine months of 2026, capex reached $1,464.9m, of which $1,398.7m was Thacker Pass Phase 1 construction costs.
The company raised the project estimate to $3.83bn from $2.93bn. The report names the reasons: tariffs and logistics about $100m, craft labour wage inflation about $150m, labour install rates for piping, steel and equipment about $245m, contractor staffing and wage rates about $250m, and additional contingency about $150m.
The incremental funding requirement is estimated at $995m: $895m of additional capex, $58m from higher reserve account requirements under the DOE loan, and $42m across other areas. The company plans to cover it with $650m of its own contributions to the JV and $315m from reserve accounts. That means fresh capital and dilution, not revenue growth.
$355.9m of net debt against a $599.0m market cap weighs on future earnings
Net debt at September 30, 2026 was $355.868m. Against a market cap of $599.0m that is 59% of the company's value. Debt rose mainly through the DOE loan: over the nine months of 2026 the loan liability increased by $845.3m, including $1,013m of new advances and $32.6m of capitalised interest. In addition, in August the company issued $150m of Yorkville convertible debentures, of which $40.5m has already converted into 14.3m shares.
Interest costs are capitalised into the project: over the nine months of 2026, $51.6m of finance costs were included in Thacker Pass construction. That means current profit does not show the interest burden – it will appear once the project starts operating. With $355.9m of net debt and future revenue from 40,000 tonnes of lithium carbonate a year, debt service will become a noticeable line.
The company also raised $4.1m through its ATM programme, selling 1.1m shares at an average price of $3.87. That is a small source compared with the scale of construction, and it shows the company has little of its own cash.
The Thacker Pass estimate rose to $3.83bn, and $995m of it is still unfunded
The new Thacker Pass Phase 1 estimate is $3.83bn including contingency, against $2.93bn previously. The company attributes the $900m increase to tariffs and logistics, labour inflation and higher installation rates. At September 30, 2026, $2.4bn of construction and project costs had been capitalised, of which $2.3bn is part of the estimate. A significant portion of spending remains before mechanical completion in late 2027 and ramp-up through 2028.
The $995m incremental requirement will be met through $650m of company contributions to the JV and $315m from reserve accounts under the DOE loan. The contributions will increase the company's JV stake but require cash it does not have. At September 30, total cash and restricted cash was $1,258.7m, of which $359.5m was at the JV level. That is not enough to cover the incremental requirement without new borrowing or equity issuance.
For a shareholder this means dilution risk: the company is already selling shares through the ATM and converting debentures into equity. The more expensive the construction, the more shares will have to be issued, and the lower future earnings per share will be.
Share price, three years
close, last point 2026-11-11
| Period | Measure | USD per share |
|---|---|---|
| 2025-11-12 | Closing price | 4.869999885559082 |
| 2025-11-13 | Closing price | 4.599999904632568 |
| 2025-11-14 | Closing price | 4.460000038146973 |
| 2025-11-17 | Closing price | 4.769999980926514 |
| 2025-11-18 | Closing price | 4.989999771118164 |
| 2025-11-19 | Closing price | 5.119999885559082 |
| 2025-11-20 | Closing price | 4.789999961853027 |
| 2025-11-21 | Closing price | 4.739999771118164 |
| 2025-11-24 | Closing price | 4.869999885559082 |
| 2025-11-25 | Closing price | 5.03000020980835 |
| 2025-11-26 | Closing price | 5.260000228881836 |
| 2025-11-28 | Closing price | 5.630000114440918 |
| 2025-12-01 | Closing price | 5.329999923706055 |
| 2025-12-02 | Closing price | 5.400000095367432 |
| 2025-12-03 | Closing price | 5.25 |
| 2025-12-04 | Closing price | 5.440000057220459 |
| 2025-12-05 | Closing price | 5.329999923706055 |
| 2025-12-08 | Closing price | 5.309999942779541 |
| 2025-12-09 | Closing price | 5.269999980926514 |
| 2025-12-10 | Closing price | 5.139999866485596 |
| 2025-12-11 | Closing price | 5.329999923706055 |
| 2025-12-12 | Closing price | 5.119999885559082 |
| 2025-12-15 | Closing price | 4.820000171661377 |
| 2025-12-16 | Closing price | 4.78000020980835 |
| 2025-12-17 | Closing price | 4.610000133514404 |
| 2025-12-18 | Closing price | 4.519999980926514 |
| 2025-12-19 | Closing price | 4.75 |
| 2025-12-22 | Closing price | 4.880000114440918 |
| 2025-12-23 | Closing price | 4.769999980926514 |
| 2025-12-24 | Closing price | 4.860000133514404 |
| 2025-12-26 | Closing price | 4.690000057220459 |
| 2025-12-29 | Closing price | 4.519999980926514 |
| 2025-12-30 | Closing price | 4.409999847412109 |
| 2025-12-31 | Closing price | 4.360000133514404 |
| 2026-01-02 | Closing price | 4.769999980926514 |
| 2026-01-05 | Closing price | 5.210000038146973 |
| 2026-01-06 | Closing price | 5.449999809265137 |
| 2026-01-07 | Closing price | 5.590000152587891 |
| 2026-01-08 | Closing price | 5.519999980926514 |
| 2026-01-09 | Closing price | 5.389999866485596 |
| 2026-01-12 | Closing price | 5.760000228881836 |
| 2026-01-13 | Closing price | 5.840000152587891 |
| 2026-01-14 | Closing price | 6.059999942779541 |
| 2026-01-15 | Closing price | 5.869999885559082 |
| 2026-01-16 | Closing price | 5.960000038146973 |
| 2026-01-20 | Closing price | 5.78000020980835 |
| 2026-01-21 | Closing price | 5.670000076293945 |
| 2026-01-22 | Closing price | 6.130000114440918 |
| 2026-01-23 | Closing price | 6.440000057220459 |
| 2026-01-26 | Closing price | 5.989999771118164 |
| 2026-01-27 | Closing price | 6.28000020980835 |
| 2026-01-28 | Closing price | 6.010000228881836 |
| 2026-01-29 | Closing price | 5.429999828338623 |
| 2026-01-30 | Closing price | 4.869999885559082 |
| 2026-02-02 | Closing price | 4.760000228881836 |
| 2026-02-03 | Closing price | 5.170000076293945 |
| 2026-02-04 | Closing price | 4.829999923706055 |
| 2026-02-05 | Closing price | 4.409999847412109 |
| 2026-02-06 | Closing price | 4.659999847412109 |
| 2026-02-09 | Closing price | 4.840000152587891 |
| 2026-02-10 | Closing price | 4.739999771118164 |
| 2026-02-11 | Closing price | 4.760000228881836 |
| 2026-02-12 | Closing price | 4.539999961853027 |
| 2026-02-13 | Closing price | 4.630000114440918 |
| 2026-02-17 | Closing price | 4.539999961853027 |
| 2026-02-18 | Closing price | 4.539999961853027 |
| 2026-02-19 | Closing price | 4.610000133514404 |
| 2026-02-20 | Closing price | 4.510000228881836 |
| 2026-02-23 | Closing price | 4.570000171661377 |
| 2026-02-24 | Closing price | 5.039999961853027 |
| 2026-02-25 | Closing price | 5.110000133514404 |
| 2026-02-26 | Closing price | 5.150000095367432 |
| 2026-02-27 | Closing price | 5.059999942779541 |
| 2026-03-02 | Closing price | 5.119999885559082 |
| 2026-03-03 | Closing price | 4.769999980926514 |
| 2026-03-04 | Closing price | 4.809999942779541 |
| 2026-03-05 | Closing price | 4.599999904632568 |
| 2026-03-06 | Closing price | 4.550000190734863 |
| 2026-03-09 | Closing price | 4.639999866485596 |
| 2026-03-10 | Closing price | 4.690000057220459 |
| 2026-03-11 | Closing price | 4.690000057220459 |
| 2026-03-12 | Closing price | 4.550000190734863 |
| 2026-03-13 | Closing price | 4.389999866485596 |
| 2026-03-16 | Closing price | 4.389999866485596 |
| 2026-03-17 | Closing price | 4.5 |
| 2026-03-18 | Closing price | 4.28000020980835 |
| 2026-03-19 | Closing price | 4.010000228881836 |
| 2026-03-20 | Closing price | 3.7100000381469727 |
| 2026-03-23 | Closing price | 3.940000057220459 |
| 2026-03-24 | Closing price | 4.010000228881836 |
| 2026-03-25 | Closing price | 4.050000190734863 |
| 2026-03-26 | Closing price | 3.880000114440918 |
| 2026-03-27 | Closing price | 3.9000000953674316 |
| 2026-03-30 | Closing price | 3.7899999618530273 |
| 2026-03-31 | Closing price | 3.950000047683716 |
| 2026-04-01 | Closing price | 3.950000047683716 |
| 2026-04-02 | Closing price | 4.039999961853027 |
| 2026-04-06 | Closing price | 4.03000020980835 |
| 2026-04-07 | Closing price | 3.9700000286102295 |
| 2026-04-08 | Closing price | 4.170000076293945 |
| 2026-04-09 | Closing price | 4.070000171661377 |
| 2026-04-10 | Closing price | 4.070000171661377 |
| 2026-04-13 | Closing price | 4.380000114440918 |
| 2026-04-14 | Closing price | 4.409999847412109 |
| 2026-04-15 | Closing price | 4.559999942779541 |
| 2026-04-16 | Closing price | 4.869999885559082 |
| 2026-04-17 | Closing price | 4.840000152587891 |
| 2026-04-20 | Closing price | 4.980000019073486 |
| 2026-04-21 | Closing price | 4.739999771118164 |
| 2026-04-22 | Closing price | 4.980000019073486 |
| 2026-04-23 | Closing price | 4.71999979019165 |
| 2026-04-24 | Closing price | 4.639999866485596 |
| 2026-04-27 | Closing price | 5.25 |
| 2026-04-28 | Closing price | 4.920000076293945 |
| 2026-04-29 | Closing price | 4.949999809265137 |
| 2026-04-30 | Closing price | 5.730000019073486 |
| 2026-05-01 | Closing price | 5.710000038146973 |
| 2026-05-04 | Closing price | 5.539999961853027 |
| 2026-05-05 | Closing price | 5.519999980926514 |
| 2026-05-06 | Closing price | 5.989999771118164 |
| 2026-05-07 | Closing price | 5.659999847412109 |
| 2026-05-08 | Closing price | 5.570000171661377 |
| 2026-05-11 | Closing price | 5.789999961853027 |
| 2026-05-12 | Closing price | 5.570000171661377 |
| 2026-05-13 | Closing price | 5.480000019073486 |
| 2026-05-14 | Closing price | 5.139999866485596 |
| 2026-05-15 | Closing price | 5.010000228881836 |
| 2026-05-18 | Closing price | 4.78000020980835 |
| 2026-05-19 | Closing price | 4.650000095367432 |
| 2026-05-20 | Closing price | 4.760000228881836 |
| 2026-05-21 | Closing price | 4.989999771118164 |
| 2026-05-22 | Closing price | 4.869999885559082 |
| 2026-05-26 | Closing price | 4.989999771118164 |
| 2026-05-27 | Closing price | 5.03000020980835 |
| 2026-05-28 | Closing price | 5.150000095367432 |
| 2026-05-29 | Closing price | 5.210000038146973 |
| 2026-06-01 | Closing price | 5.510000228881836 |
| 2026-06-02 | Closing price | 5.75 |
| 2026-06-03 | Closing price | 5.199999809265137 |
| 2026-06-04 | Closing price | 5.099999904632568 |
| 2026-06-05 | Closing price | 4.53000020980835 |
| 2026-06-08 | Closing price | 4.559999942779541 |
| 2026-06-09 | Closing price | 4.340000152587891 |
| 2026-06-10 | Closing price | 4.150000095367432 |
| 2026-06-11 | Closing price | 4.409999847412109 |
| 2026-06-12 | Closing price | 4.550000190734863 |
| 2026-06-15 | Closing price | 4.579999923706055 |
| 2026-06-16 | Closing price | 4.449999809265137 |
| 2026-06-17 | Closing price | 4.420000076293945 |
| 2026-06-18 | Closing price | 4.369999885559082 |
| 2026-06-22 | Closing price | 4.300000190734863 |
| 2026-06-23 | Closing price | 4.150000095367432 |
| 2026-06-24 | Closing price | 3.940000057220459 |
| 2026-06-25 | Closing price | 3.8499999046325684 |
| 2026-06-26 | Closing price | 3.7899999618530273 |
| 2026-06-29 | Closing price | 3.7699999809265137 |
| 2026-06-30 | Closing price | 3.8499999046325684 |
| 2026-07-01 | Closing price | 3.8299999237060547 |
| 2026-07-02 | Closing price | 3.759999990463257 |
| 2026-07-06 | Closing price | 3.819999933242798 |
| 2026-07-07 | Closing price | 3.619999885559082 |
| 2026-07-08 | Closing price | 3.5799999237060547 |
| 2026-07-09 | Closing price | 3.559999942779541 |
| 2026-07-10 | Closing price | 3.319999933242798 |
| 2026-07-13 | Closing price | 3.140000104904175 |
| 2026-07-14 | Closing price | 3.1500000953674316 |
| 2026-07-15 | Closing price | 3.109999895095825 |
| 2026-07-16 | Closing price | 2.940000057220459 |
| 2026-07-17 | Closing price | 2.950000047683716 |
| 2026-07-20 | Closing price | 2.9000000953674316 |
| 2026-07-21 | Closing price | 3.059999942779541 |
| 2026-07-22 | Closing price | 2.990000009536743 |
| 2026-07-23 | Closing price | 2.9100000858306885 |
| 2026-07-24 | Closing price | 2.809999942779541 |
| 2026-07-27 | Closing price | 2.9000000953674316 |
| 2026-07-28 | Closing price | 2.7699999809265137 |
| 2026-07-29 | Closing price | 2.7100000381469727 |
| 2026-07-30 | Closing price | 2.890000104904175 |
| 2026-07-31 | Closing price | 2.869999885559082 |
| 2026-08-03 | Closing price | 2.9800000190734863 |
| 2026-08-04 | Closing price | 3.0799999237060547 |
| 2026-08-05 | Closing price | 3.0899999141693115 |
| 2026-08-06 | Closing price | 3.0199999809265137 |
| 2026-08-07 | Closing price | 3.2300000190734863 |
| 2026-08-10 | Closing price | 3.25 |
| 2026-08-11 | Closing price | 3.25 |
| 2026-08-12 | Closing price | 3.259999990463257 |
| 2026-08-13 | Closing price | 3.430000066757202 |
| 2026-08-14 | Closing price | 3.380000114440918 |
| 2026-08-17 | Closing price | 3.1500000953674316 |
| 2026-08-18 | Closing price | 2.9600000381469727 |
| 2026-08-19 | Closing price | 3.0 |
| 2026-08-20 | Closing price | 2.9700000286102295 |
| 2026-08-21 | Closing price | 3.140000104904175 |
| 2026-08-24 | Closing price | 3.109999895095825 |
| 2026-08-25 | Closing price | 3.25 |
| 2026-08-26 | Closing price | 3.2100000381469727 |
| 2026-08-27 | Closing price | 3.1700000762939453 |
| 2026-08-28 | Closing price | 3.069999933242798 |
| 2026-08-31 | Closing price | 3.0899999141693115 |
| 2026-09-01 | Closing price | 2.9700000286102295 |
| 2026-09-02 | Closing price | 3.009999990463257 |
| 2026-09-03 | Closing price | 2.9700000286102295 |
| 2026-09-04 | Closing price | 3.0 |
| 2026-09-08 | Closing price | 3.0 |
| 2026-09-09 | Closing price | 3.190000057220459 |
| 2026-09-10 | Closing price | 3.0199999809265137 |
| 2026-09-11 | Closing price | 2.9100000858306885 |
| 2026-09-14 | Closing price | 2.890000104904175 |
| 2026-09-15 | Closing price | 2.809999942779541 |
| 2026-09-16 | Closing price | 2.7799999713897705 |
| 2026-09-17 | Closing price | 2.890000104904175 |
| 2026-09-18 | Closing price | 2.859999895095825 |
| 2026-09-21 | Closing price | 2.9600000381469727 |
| 2026-09-22 | Closing price | 3.0 |
| 2026-09-23 | Closing price | 2.9000000953674316 |
| 2026-09-24 | Closing price | 2.8299999237060547 |
| 2026-09-25 | Closing price | 2.75 |
| 2026-09-28 | Closing price | 2.680000066757202 |
| 2026-09-29 | Closing price | 2.630000114440918 |
| 2026-09-30 | Closing price | 2.630000114440918 |
| 2026-10-01 | Closing price | 2.569999933242798 |
| 2026-10-02 | Closing price | 2.549999952316284 |
| 2026-10-05 | Closing price | 2.549999952316284 |
| 2026-10-06 | Closing price | 2.5399999618530273 |
| 2026-10-07 | Closing price | 2.4100000858306885 |
| 2026-10-08 | Closing price | 2.359999895095825 |
| 2026-10-09 | Closing price | 2.3499999046325684 |
| 2026-10-12 | Closing price | 2.25 |
| 2026-10-13 | Closing price | 2.200000047683716 |
| 2026-10-14 | Closing price | 2.069999933242798 |
| 2026-10-15 | Closing price | 2.240000009536743 |
| 2026-10-16 | Closing price | 2.180000066757202 |
| 2026-10-19 | Closing price | 2.140000104904175 |
| 2026-10-20 | Closing price | 2.140000104904175 |
| 2026-10-21 | Closing price | 2.140000104904175 |
| 2026-10-22 | Closing price | 2.0999999046325684 |
| 2026-10-23 | Closing price | 2.069999933242798 |
| 2026-10-26 | Closing price | 2.0199999809265137 |
| 2026-10-27 | Closing price | 2.1600000858306885 |
| 2026-10-28 | Closing price | 2.1700000762939453 |
| 2026-10-29 | Closing price | 2.130000114440918 |
| 2026-10-30 | Closing price | 2.0299999713897705 |
| 2026-11-02 | Closing price | 1.9600000381469727 |
| 2026-11-03 | Closing price | 1.8799999952316284 |
| 2026-11-04 | Closing price | 1.9500000476837158 |
| 2026-11-05 | Closing price | 1.840000033378601 |
| 2026-11-06 | Closing price | 1.9299999475479126 |
| 2026-11-09 | Closing price | 2.0199999809265137 |
| 2026-11-10 | Closing price | 1.8899999856948853 |
| 2026-11-11 | Closing price | 1.649999976158142 |
The 3.43 P/E LTM is misleading: it is built on paper remeasurement gains
The 3.43 P/E LTM looks very low, but that is because trailing-twelve-month profit of $174.7m consists almost entirely of warrant and derivative remeasurements. There is no revenue over the last twelve months and operating cash flow is negative at -$35.3m. The earnings per share behind the multiple do not reflect the business's ability to earn.
The 17.0% return on equity is also calculated from this paper profit. The real return on capital is still negative because the project generates no revenue. The 3.43 P/E cannot be compared with the company's history: there is no operating profit yet, and the multiple has no economic meaning.
The only meaningful yardstick is the $599.0m market cap against $355.9m of net debt and future capex. The market values the company at $599m, but completing construction requires about $995m of additional funding. That means the current share price already discounts future success, and the margin of safety is thin.
Valuation on the latest reported figures
| Metric | Value |
|---|---|
| Market cap | 0.60 bn USD |
| P/E (LTM) | 3.4 |
| P/B | 0.94 |
| Operating cash flow (LTM) | -0.04 bn |
| ROE | 17.0% |
Bottom line
The only strengths in the report are positive operating cash flow of $2.692m and construction progress: 4.7 million workhours without a serious injury, engineering and procurement more than 90% complete. But the $74.7m profit is paper – it came from warrant and derivative remeasurement as the share price fell, not from operations. The $9.26m operating loss remains, there is no revenue, quarterly capex was $407.5m and net debt is $355.9m. The real question for a holder is where the additional $995m to complete Thacker Pass will come from and how many shares will have to be issued. Our conclusion: rather unattractive – the 3.43 P/E LTM has no economic meaning because it is built on paper profit, and the project still needs about $995m of additional funding. Our view: the share is rather unattractive at the current price.