Nutrien: fertiliser prices rose 4.9%, but sulfur at 3.7x last year's cost ate the margin – EBITDA fell short of what prices implied
Contents
On 11 November Nutrien reported results for the third quarter of 2026. The average fertiliser price in the period was USD 766.3 versus USD 730.3 a year earlier (+4.9%), potash – USD 767.6 (+4.7%), but sulfur, which the company buys, rose to USD 1,294 from USD 349.4 (+270.4%). Revenue grew only 0.9% to USD 6,064m, EBITDA fell 8.6% to USD 1,301m and net profit – 38.8% to USD 284m. At the year-ago volumes and costs, our calculation shows prices should have produced EBITDA of USD 1,301m – the reported figure matched that estimate, but quarter on quarter prices implied USD 2,169.1m, and the USD 868.1m gap is explained by the seasonal fall in volumes. Our conclusion: rather attractive – on the portal's model the upside of the share to fair value is +16%. Our view: the share is rather attractive at the current price; upside on the portal model +16%.
Our view: is there upside
Our view in numbers
| Metric | Our read |
|---|---|
| Verdict | Rather attractive |
| Upside on the portal model | +16% |
| How the model works | spot model: EBITDA re-priced to current commodity prices at the target EV/EBITDA, against market cap |
| EV/EBITDA now and 3-year average | 7.3 vs 7.5 – in line with its history |
| Dividend yield, 12m | 2.3% |
| Net debt / EBITDA | 1.93 – moderate leverage |
| Strongest case for | On the portal's model the upside of the share to fair value is +16%, and EBITDA at current prices of USD 6,211.5m is already above LTM USD 6,171.5m. |
| Strongest case against | Sulfur rose 3.7-fold to USD 1,294 and compressed the EBITDA margin to 21.5% from 23.7%, while net profit fell 38.8%. |
| What would change the view | If the spot sulfur price of USD 765.8 holds, the margin will recover and the verdict will move one step up; if potash stays at USD 711.6, it will move one step down. |
Key takeaways
— Fertiliser prices rose 4.9% year on year, but sulfur became 3.7 times more expensive and offset that effect
— EBITDA of USD 1,301m matched the calculation at year-ago prices, but quarter on quarter prices implied USD 2,169.1m
— Revenue added only 0.9% – a deceleration from 3.6% in the second quarter, and volumes fell against the previous quarter
— EBITDA margin narrowed to 21.5% from 23.7% because of higher sulfur costs, not selling prices
— Leverage at 1.93x EBITDA LTM is moderate, but operating cash flow was negative in the quarter on a seasonal working-capital outflow
— Dividend yield of 2.29% is modest, but payouts are covered by LTM profit of USD 2,200m
— EV/EBITDA of 7.3 is almost in line with the three-year average of 7.5 – the share is valued in line with its own history
Key figures, USD bn
| Metric | Q3 2025 | Q3 2026 | Change |
|---|---|---|---|
| Revenue | 6.01 | 6.06 | +0.9% |
| EBITDA | 1.42 | 1.30 | -8.6% |
| Operating profit | 0.88 | 0.74 | -15.6% |
| Net profit | 0.46 | 0.28 | -38.8% |
| Operating cash flow | -0.43 | -0.42 | — |
| Capex | 0.53 | 0.53 | -0.9% |
| EBITDA margin | 23.7% | 21.5% | -2.2 pp |
| Net margin | 7.7% | 4.7% | -3.0 pp |
Fertiliser prices rose 4.9% year on year, but sulfur became 3.7 times more expensive and offset that effect
The average fertiliser price in the reported period was USD 766.3 versus USD 730.3 a year earlier (+4.9%), potash – USD 767.6 versus USD 733.3 (+4.7%), oilseeds – USD 128.3 versus USD 115.1 (+11.5%). Prices rose across all three commodity groups, which should have supported revenue and margin.
At the same time sulfur, which Nutrien buys as an input, rose to USD 1,294 from USD 349.4 a year earlier (+270.4%). With sulfur at about 10% of revenue in costs, that increase added roughly USD 1,852m to costs at year-ago volumes – more than offsetting the positive revenue price effect of USD 236.3m.
The spot fertiliser price is now USD 795.2 – 3.8% above the reported-period average, potash – USD 711.6, 7.3% below. Sulfur has fallen to USD 765.8, 40.8% below the quarterly average, which should improve unit costs in the next period.
Commodity prices: period average and now
| Benchmark | Year ago | Q3 2026 | YoY | Spot 2026-11-11 |
|---|---|---|---|---|
| US Fertilizer, USD | 730,3 | 766,3 | +4,9% | 795,2 |
| Potash (US Gulf Nola), USD | 733,3 | 767,6 | +4,7% | 711,6 |
| Food Oils and Oilseeds, USD | 115,1 | 128,3 | +11,5% | 128,4 |
| China Factory Posted Sulfur Spot (input cost), USD | 349,4 | 1 294 | +270,4% | 765,8 |
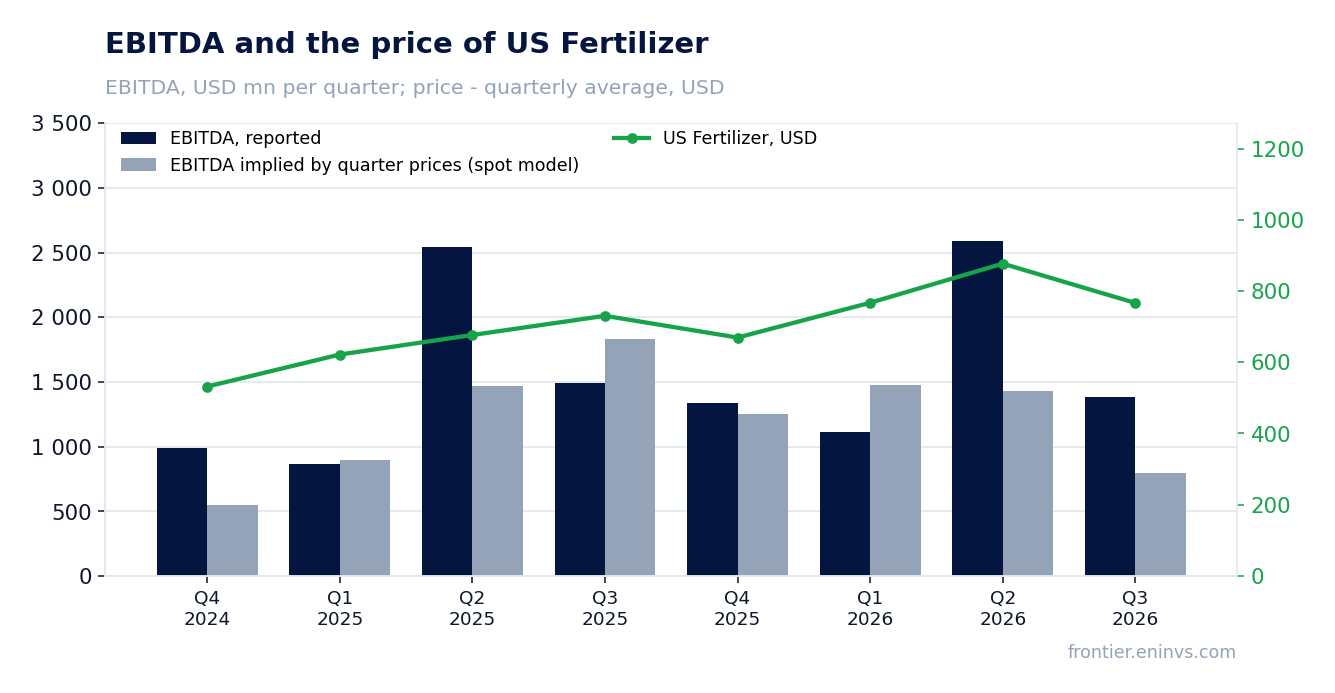
EBITDA of USD 1,301m matched the calculation at year-ago prices, but quarter on quarter prices implied USD 2,169.1m
At the volumes and costs of the third quarter of 2025 and the prices of the reported period, our calculation gives revenue of USD 6,243.3m and EBITDA of USD 1,301m. Reported EBITDA of USD 1,301m matched that estimate, meaning the company earned exactly what prices implied at last year's volumes.
Against the previous quarter, however, prices implied EBITDA of USD 2,169.1m at second-quarter volumes. Reported USD 1,301m is USD 868.1m, or 40.0%, below that estimate. The gap is explained by the seasonal fall in volumes: reported-quarter revenue was USD 6,064m versus USD 10,812m in the second quarter.
The portal's spot model, built from the average of the previous four quarters, expected EBITDA of USD 796m and revenue of USD 7,291.7m. Reported EBITDA is 63.4% above the model, revenue 16.8% below. The deviation of EBITDA from the model in the four prior periods ranged from -34.5% to +67.0%, so the model is sensitive to one-off quarters in its base.
What the prices implied and what the company earned
| Base (Q3 2025) | Implied at period prices | Reported | Reported vs implied | |
|---|---|---|---|---|
| Revenue, USD mn | 6 007 | 6 243 | 6 064 | -2,9% |
| EBITDA, USD mn | 1 424 | -191,7 | 1 301 | — |
| EBITDA, portal spot model, USD mn | — | 796,0 | 1 301 | +63,4% |
Revenue and EBITDA by quarter
| Period | Measure | bn USD |
|---|---|---|
| Q4 2024 | Revenue | 5.079 |
| Q1 2025 | Revenue | 5.1 |
| Q2 2025 | Revenue | 10.438 |
| Q3 2025 | Revenue | 6.007 |
| Q4 2025 | Revenue | 5.34 |
| Q1 2026 | Revenue | 6.046 |
| Q2 2026 | Revenue | 10.812 |
| Q3 2026 | Revenue | 6.064 |
| Q4 2024 | EBITDA | 0.988 |
| Q1 2025 | EBITDA | 0.862 |
| Q2 2025 | EBITDA | 2.541 |
| Q3 2025 | EBITDA | 1.494 |
| Q4 2025 | EBITDA | 1.338 |
| Q1 2026 | EBITDA | 1.113 |
| Q2 2026 | EBITDA | 2.593 |
| Q3 2026 | EBITDA | 1.38 |
EBITDA margin
| Period | Measure | % |
|---|---|---|
| Q4 2024 | EBITDA margin | 19.5 |
| Q1 2025 | EBITDA margin | 16.9 |
| Q2 2025 | EBITDA margin | 24.3 |
| Q3 2025 | EBITDA margin | 24.9 |
| Q4 2025 | EBITDA margin | 25.1 |
| Q1 2026 | EBITDA margin | 18.4 |
| Q2 2026 | EBITDA margin | 24.0 |
| Q3 2026 | EBITDA margin | 22.8 |
Revenue added only 0.9% – a deceleration from 3.6% in the second quarter, and volumes fell against the previous quarter
Reported-quarter revenue was USD 6,064m, 0.9% above USD 6,007m a year earlier. Growth decelerated from 3.6% in the second quarter of 2026 to 0.9% in the third – a deceleration, not an acceleration.
Against the second quarter revenue fell from USD 10,812m to USD 6,064m – almost by half. This matches Nutrien's seasonal profile: the second quarter is the peak of spring selling in the Northern Hemisphere, the third is the trough. Volumes in the reported quarter were lower than in the second, which explains the gap with the price-implied estimate.
EBITDA margin narrowed to 21.5% from 23.7% because of higher sulfur costs, not selling prices
EBITDA margin in the reported quarter was 21.5% versus 23.7% a year earlier. The 2.2 percentage point decline came with rising fertiliser and potash prices, so the cause was costs, not revenue.
The main factor is sulfur: its price rose 3.7-fold year on year, and at about 10% of revenue in costs that added roughly USD 1,852m to costs at year-ago volumes. The revenue price effect was only USD 236.3m, so the margin compressed.
Net profit fell 38.8% to USD 284m, and net margin – to 4.7% from 7.7%. The profit decline is steeper than EBITDA because of higher input costs and probably higher depreciation, but the facts do not disclose the exact cause.
Leverage at 1.93x EBITDA LTM is moderate, but operating cash flow was negative in the quarter on a seasonal working-capital outflow
Net debt at 30 September 2026 was USD 11,887m against LTM EBITDA of USD 6,171.5m, or 1.93x LTM EBITDA. That is a moderate level for a fertiliser producer, although the facts do not disclose the direction of the change in leverage.
Operating cash flow in the reported quarter was negative – minus USD 425m – with capital expenditure of USD 525m. Negative cash flow in the third quarter is typical for Nutrien: in the second quarter flow was positive (USD 2,484m), and in the third the company funds working capital after the spring selling peak.
Over the last twelve months operating cash flow was USD 4,185m, which covers capital expenditure and dividends. At current prices EBITDA is estimated at USD 6,211.5m and leverage at 1.91x EBITDA, close to the reported level.
Valuation vs its own history
now vs the 3-year average
| Period | Measure | × |
|---|---|---|
| EV/EBITDA | Now | 7.335471300550298 |
| EV/EBITDA | 3-year average | 7.516374763000363 |
Dividend yield of 2.29% is modest, but payouts are covered by LTM profit of USD 2,200m
The trailing twelve-month dividend yield is 2.29% on the current price. The company pays dividends regularly, and with LTM profit of USD 2,200m and market capitalisation of USD 35,236m the payout ratio is about 37% – a moderate level.
Our estimate for the current year's dividend assumes the payout stays near 37% and LTM profit of USD 2,200m, giving about USD 810m of payouts, or roughly 2.3% yield. The estimate hinges on profit: rising sulfur costs pressure the margin, and if that continues profit may fall, and the dividend with it.
The 2.29% yield is below the key rate, but for a commodity company with cyclical profit that is normal. A dividend cut is possible if sulfur costs rise further or potash prices fall – the spot potash price is already 7.3% below the quarterly average.
Share price, three years
close, last point 2026-11-10
| Period | Measure | USD per share |
|---|---|---|
| 2025-11-10 | Closing price | 58.939998626708984 |
| 2025-11-11 | Closing price | 59.33000183105469 |
| 2025-11-12 | Closing price | 60.130001068115234 |
| 2025-11-13 | Closing price | 58.869998931884766 |
| 2025-11-14 | Closing price | 59.369998931884766 |
| 2025-11-17 | Closing price | 56.9900016784668 |
| 2025-11-18 | Closing price | 57.31999969482422 |
| 2025-11-19 | Closing price | 55.939998626708984 |
| 2025-11-20 | Closing price | 55.060001373291016 |
| 2025-11-21 | Closing price | 56.189998626708984 |
| 2025-11-24 | Closing price | 56.22999954223633 |
| 2025-11-25 | Closing price | 56.83000183105469 |
| 2025-11-26 | Closing price | 57.400001525878906 |
| 2025-11-28 | Closing price | 58.16999816894531 |
| 2025-12-01 | Closing price | 60.16999816894531 |
| 2025-12-02 | Closing price | 59.290000915527344 |
| 2025-12-03 | Closing price | 60.06999969482422 |
| 2025-12-04 | Closing price | 60.04999923706055 |
| 2025-12-05 | Closing price | 60.34000015258789 |
| 2025-12-08 | Closing price | 59.119998931884766 |
| 2025-12-09 | Closing price | 58.65999984741211 |
| 2025-12-10 | Closing price | 59.0 |
| 2025-12-11 | Closing price | 61.0 |
| 2025-12-12 | Closing price | 62.84000015258789 |
| 2025-12-15 | Closing price | 61.849998474121094 |
| 2025-12-16 | Closing price | 61.849998474121094 |
| 2025-12-17 | Closing price | 63.29999923706055 |
| 2025-12-18 | Closing price | 61.630001068115234 |
| 2025-12-19 | Closing price | 62.279998779296875 |
| 2025-12-22 | Closing price | 62.66999816894531 |
| 2025-12-23 | Closing price | 63.61000061035156 |
| 2025-12-24 | Closing price | 63.540000915527344 |
| 2025-12-26 | Closing price | 62.77000045776367 |
| 2025-12-29 | Closing price | 62.689998626708984 |
| 2025-12-30 | Closing price | 62.47999954223633 |
| 2025-12-31 | Closing price | 61.720001220703125 |
| 2026-01-02 | Closing price | 63.15999984741211 |
| 2026-01-05 | Closing price | 62.11000061035156 |
| 2026-01-06 | Closing price | 60.599998474121094 |
| 2026-01-07 | Closing price | 58.9900016784668 |
| 2026-01-08 | Closing price | 59.79999923706055 |
| 2026-01-09 | Closing price | 59.81999969482422 |
| 2026-01-12 | Closing price | 59.34000015258789 |
| 2026-01-13 | Closing price | 61.33000183105469 |
| 2026-01-14 | Closing price | 66.19999694824219 |
| 2026-01-15 | Closing price | 67.83000183105469 |
| 2026-01-16 | Closing price | 66.37999725341797 |
| 2026-01-20 | Closing price | 67.22000122070312 |
| 2026-01-21 | Closing price | 68.68000030517578 |
| 2026-01-22 | Closing price | 68.0999984741211 |
| 2026-01-23 | Closing price | 70.87999725341797 |
| 2026-01-26 | Closing price | 70.2300033569336 |
| 2026-01-27 | Closing price | 70.31999969482422 |
| 2026-01-28 | Closing price | 71.5999984741211 |
| 2026-01-29 | Closing price | 71.12999725341797 |
| 2026-01-30 | Closing price | 68.88999938964844 |
| 2026-02-02 | Closing price | 68.69000244140625 |
| 2026-02-03 | Closing price | 70.41000366210938 |
| 2026-02-04 | Closing price | 71.5 |
| 2026-02-05 | Closing price | 67.9800033569336 |
| 2026-02-06 | Closing price | 68.61000061035156 |
| 2026-02-09 | Closing price | 70.08000183105469 |
| 2026-02-10 | Closing price | 71.13999938964844 |
| 2026-02-11 | Closing price | 73.06999969482422 |
| 2026-02-12 | Closing price | 70.43000030517578 |
| 2026-02-13 | Closing price | 70.80999755859375 |
| 2026-02-17 | Closing price | 69.86000061035156 |
| 2026-02-18 | Closing price | 70.27999877929688 |
| 2026-02-19 | Closing price | 71.77999877929688 |
| 2026-02-20 | Closing price | 71.19999694824219 |
| 2026-02-23 | Closing price | 71.91000366210938 |
| 2026-02-24 | Closing price | 72.76000213623047 |
| 2026-02-25 | Closing price | 72.52999877929688 |
| 2026-02-26 | Closing price | 73.12999725341797 |
| 2026-02-27 | Closing price | 75.06999969482422 |
| 2026-03-02 | Closing price | 75.73999786376953 |
| 2026-03-03 | Closing price | 74.41999816894531 |
| 2026-03-04 | Closing price | 73.58999633789062 |
| 2026-03-05 | Closing price | 74.38999938964844 |
| 2026-03-06 | Closing price | 76.20999908447266 |
| 2026-03-09 | Closing price | 75.80999755859375 |
| 2026-03-10 | Closing price | 76.08999633789062 |
| 2026-03-11 | Closing price | 79.30999755859375 |
| 2026-03-12 | Closing price | 83.94000244140625 |
| 2026-03-13 | Closing price | 82.8499984741211 |
| 2026-03-16 | Closing price | 77.79000091552734 |
| 2026-03-17 | Closing price | 79.55000305175781 |
| 2026-03-18 | Closing price | 77.87999725341797 |
| 2026-03-19 | Closing price | 76.05000305175781 |
| 2026-03-20 | Closing price | 74.7300033569336 |
| 2026-03-23 | Closing price | 72.86000061035156 |
| 2026-03-24 | Closing price | 76.81999969482422 |
| 2026-03-25 | Closing price | 76.62000274658203 |
| 2026-03-26 | Closing price | 73.69000244140625 |
| 2026-03-27 | Closing price | 75.6500015258789 |
| 2026-03-30 | Closing price | 76.55000305175781 |
| 2026-03-31 | Closing price | 75.45999908447266 |
| 2026-04-01 | Closing price | 74.55999755859375 |
| 2026-04-02 | Closing price | 75.47000122070312 |
| 2026-04-06 | Closing price | 75.80999755859375 |
| 2026-04-07 | Closing price | 76.87999725341797 |
| 2026-04-08 | Closing price | 74.87999725341797 |
| 2026-04-09 | Closing price | 72.77999877929688 |
| 2026-04-10 | Closing price | 73.75 |
| 2026-04-13 | Closing price | 74.37999725341797 |
| 2026-04-14 | Closing price | 73.62000274658203 |
| 2026-04-15 | Closing price | 73.3499984741211 |
| 2026-04-16 | Closing price | 74.52999877929688 |
| 2026-04-17 | Closing price | 70.62000274658203 |
| 2026-04-20 | Closing price | 71.16999816894531 |
| 2026-04-21 | Closing price | 72.66999816894531 |
| 2026-04-22 | Closing price | 71.55000305175781 |
| 2026-04-23 | Closing price | 72.19000244140625 |
| 2026-04-24 | Closing price | 71.56999969482422 |
| 2026-04-27 | Closing price | 72.37000274658203 |
| 2026-04-28 | Closing price | 72.91000366210938 |
| 2026-04-29 | Closing price | 74.12999725341797 |
| 2026-04-30 | Closing price | 76.0 |
| 2026-05-01 | Closing price | 75.22000122070312 |
| 2026-05-04 | Closing price | 75.81999969482422 |
| 2026-05-05 | Closing price | 77.23999786376953 |
| 2026-05-06 | Closing price | 73.80999755859375 |
| 2026-05-07 | Closing price | 68.37999725341797 |
| 2026-05-08 | Closing price | 68.33000183105469 |
| 2026-05-11 | Closing price | 71.29000091552734 |
| 2026-05-12 | Closing price | 71.9800033569336 |
| 2026-05-13 | Closing price | 71.29000091552734 |
| 2026-05-14 | Closing price | 70.94000244140625 |
| 2026-05-15 | Closing price | 71.55999755859375 |
| 2026-05-18 | Closing price | 71.62000274658203 |
| 2026-05-19 | Closing price | 71.58999633789062 |
| 2026-05-20 | Closing price | 70.11000061035156 |
| 2026-05-21 | Closing price | 70.23999786376953 |
| 2026-05-22 | Closing price | 70.12999725341797 |
| 2026-05-26 | Closing price | 69.94000244140625 |
| 2026-05-27 | Closing price | 68.7300033569336 |
| 2026-05-28 | Closing price | 69.6500015258789 |
| 2026-05-29 | Closing price | 68.55000305175781 |
| 2026-06-01 | Closing price | 69.56999969482422 |
| 2026-06-02 | Closing price | 68.5 |
| 2026-06-03 | Closing price | 68.80999755859375 |
| 2026-06-04 | Closing price | 69.0 |
| 2026-06-05 | Closing price | 67.19999694824219 |
| 2026-06-08 | Closing price | 67.27999877929688 |
| 2026-06-09 | Closing price | 66.3499984741211 |
| 2026-06-10 | Closing price | 65.02999877929688 |
| 2026-06-11 | Closing price | 65.55999755859375 |
| 2026-06-12 | Closing price | 67.62000274658203 |
| 2026-06-15 | Closing price | 66.12999725341797 |
| 2026-06-16 | Closing price | 65.4800033569336 |
| 2026-06-17 | Closing price | 64.27999877929688 |
| 2026-06-18 | Closing price | 62.86000061035156 |
| 2026-06-22 | Closing price | 62.25 |
| 2026-06-23 | Closing price | 61.540000915527344 |
| 2026-06-24 | Closing price | 60.369998931884766 |
| 2026-06-25 | Closing price | 60.959999084472656 |
| 2026-06-26 | Closing price | 60.97999954223633 |
| 2026-06-29 | Closing price | 61.18000030517578 |
| 2026-06-30 | Closing price | 62.95000076293945 |
| 2026-07-01 | Closing price | 63.56999969482422 |
| 2026-07-02 | Closing price | 65.05999755859375 |
| 2026-07-06 | Closing price | 64.54000091552734 |
| 2026-07-07 | Closing price | 65.31999969482422 |
| 2026-07-08 | Closing price | 66.76000213623047 |
| 2026-07-09 | Closing price | 64.56999969482422 |
| 2026-07-10 | Closing price | 65.43000030517578 |
| 2026-07-13 | Closing price | 67.5999984741211 |
| 2026-07-14 | Closing price | 68.63999938964844 |
| 2026-07-15 | Closing price | 68.33000183105469 |
| 2026-07-16 | Closing price | 67.0999984741211 |
| 2026-07-17 | Closing price | 67.27999877929688 |
| 2026-07-20 | Closing price | 66.66000366210938 |
| 2026-07-21 | Closing price | 66.83999633789062 |
| 2026-07-22 | Closing price | 68.5 |
| 2026-07-23 | Closing price | 68.54000091552734 |
| 2026-07-24 | Closing price | 68.0999984741211 |
| 2026-07-27 | Closing price | 67.4000015258789 |
| 2026-07-28 | Closing price | 69.45999908447266 |
| 2026-07-29 | Closing price | 70.58999633789062 |
| 2026-07-30 | Closing price | 70.72000122070312 |
| 2026-07-31 | Closing price | 69.06999969482422 |
| 2026-08-03 | Closing price | 65.95999908447266 |
| 2026-08-04 | Closing price | 66.91999816894531 |
| 2026-08-05 | Closing price | 66.91999816894531 |
| 2026-08-06 | Closing price | 66.76000213623047 |
| 2026-08-07 | Closing price | 64.41999816894531 |
| 2026-08-10 | Closing price | 66.30999755859375 |
| 2026-08-11 | Closing price | 67.27999877929688 |
| 2026-08-12 | Closing price | 67.18000030517578 |
| 2026-08-13 | Closing price | 67.47000122070312 |
| 2026-08-14 | Closing price | 68.23999786376953 |
| 2026-08-17 | Closing price | 68.29000091552734 |
| 2026-08-18 | Closing price | 69.4000015258789 |
| 2026-08-19 | Closing price | 70.5 |
| 2026-08-20 | Closing price | 73.12000274658203 |
| 2026-08-21 | Closing price | 75.2699966430664 |
| 2026-08-24 | Closing price | 74.29000091552734 |
| 2026-08-25 | Closing price | 72.83999633789062 |
| 2026-08-26 | Closing price | 73.61000061035156 |
| 2026-08-27 | Closing price | 73.05999755859375 |
| 2026-08-28 | Closing price | 73.51000213623047 |
| 2026-08-31 | Closing price | 75.52999877929688 |
| 2026-09-01 | Closing price | 77.69000244140625 |
| 2026-09-02 | Closing price | 80.29000091552734 |
| 2026-09-03 | Closing price | 80.7300033569336 |
| 2026-09-04 | Closing price | 79.47000122070312 |
| 2026-09-08 | Closing price | 80.68000030517578 |
| 2026-09-09 | Closing price | 80.72000122070312 |
| 2026-09-10 | Closing price | 78.73999786376953 |
| 2026-09-11 | Closing price | 78.44999694824219 |
| 2026-09-14 | Closing price | 77.0 |
| 2026-09-15 | Closing price | 78.72000122070312 |
| 2026-09-16 | Closing price | 77.68000030517578 |
| 2026-09-17 | Closing price | 78.91999816894531 |
| 2026-09-18 | Closing price | 77.08999633789062 |
| 2026-09-21 | Closing price | 74.54000091552734 |
| 2026-09-22 | Closing price | 75.43000030517578 |
| 2026-09-23 | Closing price | 75.12999725341797 |
| 2026-09-24 | Closing price | 73.95999908447266 |
| 2026-09-25 | Closing price | 72.2300033569336 |
| 2026-09-28 | Closing price | 71.9800033569336 |
| 2026-09-29 | Closing price | 71.18000030517578 |
| 2026-09-30 | Closing price | 70.25 |
| 2026-10-01 | Closing price | 69.7300033569336 |
| 2026-10-02 | Closing price | 70.05999755859375 |
| 2026-10-05 | Closing price | 70.26000213623047 |
| 2026-10-06 | Closing price | 71.19999694824219 |
| 2026-10-07 | Closing price | 69.97000122070312 |
| 2026-10-08 | Closing price | 69.87000274658203 |
| 2026-10-09 | Closing price | 67.4800033569336 |
| 2026-10-12 | Closing price | 68.0 |
| 2026-10-13 | Closing price | 69.68000030517578 |
| 2026-10-14 | Closing price | 69.87000274658203 |
| 2026-10-15 | Closing price | 69.58000183105469 |
| 2026-10-16 | Closing price | 71.26000213623047 |
| 2026-10-19 | Closing price | 69.44000244140625 |
| 2026-10-20 | Closing price | 69.02999877929688 |
| 2026-10-21 | Closing price | 68.12000274658203 |
| 2026-10-22 | Closing price | 69.08999633789062 |
| 2026-10-23 | Closing price | 69.73999786376953 |
| 2026-10-26 | Closing price | 68.22000122070312 |
| 2026-10-27 | Closing price | 69.37000274658203 |
| 2026-10-28 | Closing price | 69.06999969482422 |
| 2026-10-29 | Closing price | 68.4800033569336 |
| 2026-10-30 | Closing price | 69.41999816894531 |
| 2026-11-02 | Closing price | 70.19999694824219 |
| 2026-11-03 | Closing price | 69.31999969482422 |
| 2026-11-04 | Closing price | 72.06999969482422 |
| 2026-11-05 | Closing price | 72.20999908447266 |
| 2026-11-06 | Closing price | 71.4800033569336 |
| 2026-11-09 | Closing price | 72.29000091552734 |
| 2026-11-10 | Closing price | 72.42500305175781 |
EV/EBITDA of 7.3 is almost in line with the three-year average of 7.5 – the share is valued in line with its own history
EV/EBITDA LTM is 7.3 against a three-year average of 7.5 – a deviation of just -2%, meaning the share is valued in line with its own history, without a discount or premium. P/E LTM is 16.0, which looks neutral for a commodity company with profit of USD 2,200m.
On the portal's model, at current commodity prices EBITDA is estimated at USD 6,211.5m versus LTM USD 6,171.5m (+0.6%), and EV/EBITDA at current prices is 7.6. That is close to the historical level, so the main argument for the share is not a re-rating of the multiple but the potential for profit growth if sulfur prices fall.
On the portal's model, the fair value of the share implies +16% upside to the current price. This is our own calculation, not a market consensus. With a dividend yield of 2.29%, total expected return is about 18%.
Valuation on the latest reported figures
| Metric | Value |
|---|---|
| Market cap | 35.2 bn USD |
| P/E (LTM) | 16.0 |
| EV/EBITDA (LTM) | 7.3 |
| P/B | 1.39 |
| Net debt / EBITDA (LTM) | 1.93 |
| Operating cash flow (LTM) | 4.18 bn |
| ROE | 4.4% |
| Dividend yield (12m) | 2.3% |
| EV/EBITDA, 3-year average | 7.5 |
Net profit by quarter
| Period | Measure | bn USD |
|---|---|---|
| Q4 2024 | Net profit | 0.118 |
| Q1 2025 | Net profit | 0.011 |
| Q2 2025 | Net profit | 1.221 |
| Q3 2025 | Net profit | 0.464 |
| Q4 2025 | Net profit | 0.571 |
| Q1 2026 | Net profit | 0.131 |
| Q2 2026 | Net profit | 1.214 |
| Q3 2026 | Net profit | 0.284 |
Bottom line
The strength of the report is that the company earned exactly what prices implied at last year's volumes: EBITDA of USD 1,301m matched the calculation. The weakness is in costs: sulfur rose 3.7-fold and compressed the margin to 21.5% from 23.7%, while net profit fell 38.8%. Leverage at 1.93x LTM EBITDA is moderate, the dividend is covered by profit, and the multiple of 7.3 is almost in line with the three-year average of 7.5. The key question for a holder is whether the fall in sulfur prices to USD 765.8 holds, which could restore the margin. Our conclusion: rather attractive – on the portal's model the upside of the share is +16%. Our view: the share is rather attractive at the current price; upside on the portal model +16%.