Occidental Petroleum: profit more than doubled, but revenue growth slowed from the prior quarter
Contents
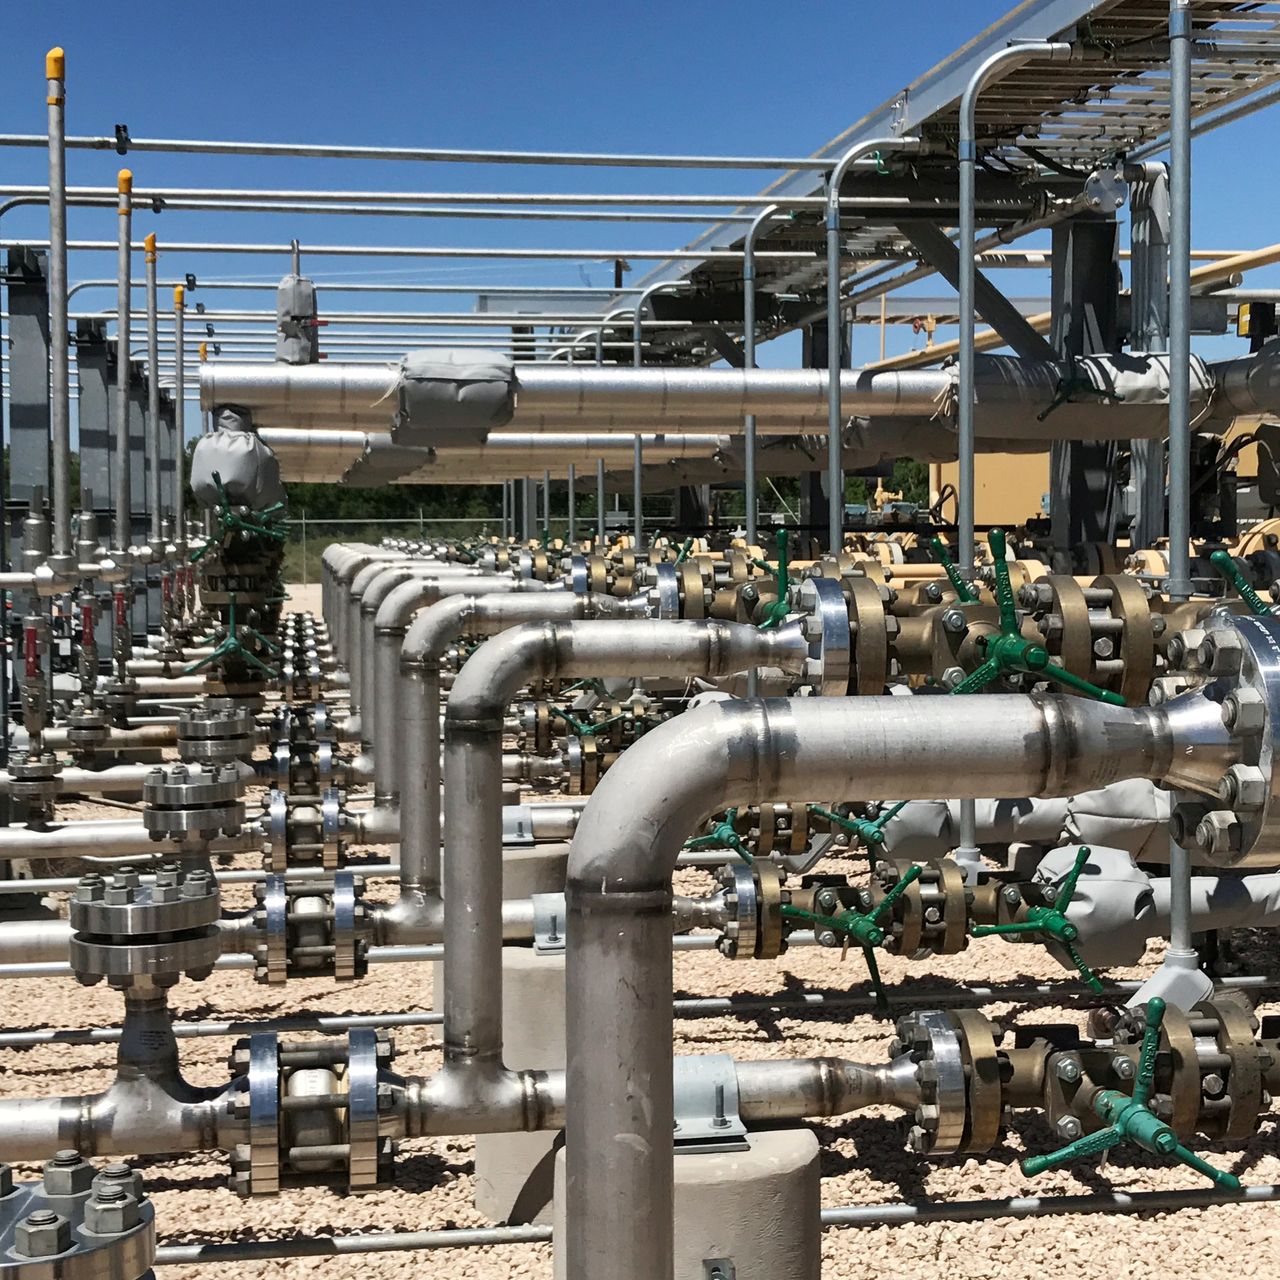
On 13 October Occidental Petroleum released its third-quarter 2026 results. Revenue came in at USD 6.57 bn (+19.0% year on year), EBITDA at USD 4.18 bn (+42.8%) and net profit at USD 1.82 bn (+116.3%). Revenue growth decelerated from the second quarter (+53.4%), but the margin and profit remain strong, and leverage stands at 1.02x EBITDA over the last twelve months. At the current price the share looks attractive: EV/EBITDA of 4.8 is below its own three-year average of 7.7, and net debt fell from USD 30.1 bn to 18.4 bn over the year.
Key takeaways
— Revenue grew 19.0% year on year, but that is slower than the +53.4% a quarter earlier
— EBITDA rose 42.8% on 19.0% revenue growth, lifting the margin to 63.6% from 53.0%
— Net profit grew 116.3% – faster than both revenue and EBITDA
— Free cash flow for the quarter was USD 2.35 bn on capex of USD 1.32 bn
— Net debt fell from USD 30.1 bn on 30 September 2025 to USD 18.4 bn on 30 September 2026
— The 1.87% dividend yield is modest, but the payout is covered by profit
— EV/EBITDA of 4.8 is 38% below its own three-year average of 7.7
Attractiveness
Key figures, USD bn
| Metric | Q3 2025 | Q3 2026 | Change |
|---|---|---|---|
| Revenue | 5.52 | 6.57 | +19.0% |
| EBITDA | 2.92 | 4.18 | +42.8% |
| Operating profit | 0.98 | 2.40 | +144.9% |
| Net profit | 0.84 | 1.82 | +116.3% |
| Operating cash flow | 2.79 | 3.67 | +31.6% |
| Capex | 1.77 | 1.32 | -25.2% |
| EBITDA margin | 53.0% | 63.6% | +10.6 pp |
| Net margin | 15.3% | 27.7% | +12.4 pp |
Revenue grew 19.0% year on year, but that is slower than the +53.4% a quarter earlier
Revenue for the third quarter of 2026 was USD 6.57 bn, 19.0% above the third quarter of 2025. This is the second consecutive quarter of growth after the decline in late 2025 – early 2026, when revenue fell 8.3–23.1% year on year.
The deceleration from the second quarter (+53.4%) is primarily due to a high base: in the second quarter of 2026 revenue reached USD 8.07 bn, while in the third it fell to 6.57 bn. Seasonality and one-off factors are not disclosed in the release, so the quarter-on-quarter driver cannot be identified.
The release states that production in the third quarter of 2026 was within the guidance range despite a temporary curtailment in the Gulf of America due to a third-party gas pipeline constraint. That constraint has been partially lifted, and the remaining impacted production is expected to return as it is resolved.
Revenue and EBITDA by quarter
| Period | Measure | bn USD |
|---|---|---|
| Q4 2024 | Revenue | 2.054 |
| Q1 2025 | Revenue | 5.704 |
| Q2 2025 | Revenue | 5.258 |
| Q3 2025 | Revenue | 5.519 |
| Q4 2025 | Revenue | 5.112 |
| Q1 2026 | Revenue | 5.23 |
| Q2 2026 | Revenue | 8.065 |
| Q3 2026 | Revenue | 6.567 |
| Q4 2024 | EBITDA | 1.342 |
| Q1 2025 | EBITDA | 3.071 |
| Q2 2025 | EBITDA | 2.521 |
| Q3 2025 | EBITDA | 2.925 |
| Q4 2025 | EBITDA | 2.51 |
| Q1 2026 | EBITDA | 3.483 |
| Q2 2026 | EBITDA | 5.287 |
| Q3 2026 | EBITDA | 4.178 |
EBITDA margin
| Period | Measure | % |
|---|---|---|
| Q4 2024 | EBITDA margin | 65.3 |
| Q1 2025 | EBITDA margin | 53.8 |
| Q2 2025 | EBITDA margin | 47.9 |
| Q3 2025 | EBITDA margin | 53.0 |
| Q4 2025 | EBITDA margin | 49.1 |
| Q1 2026 | EBITDA margin | 66.6 |
| Q2 2026 | EBITDA margin | 65.6 |
| Q3 2026 | EBITDA margin | 63.6 |
EBITDA rose 42.8% on 19.0% revenue growth, lifting the margin to 63.6% from 53.0%
EBITDA for the third quarter of 2026 was USD 4.18 bn, 42.8% above the year-earlier level. Outpacing revenue growth lifted the EBITDA margin to 63.6% from 53.0% a year earlier.
Operating profit was USD 2.40 bn, up 145% year on year. The gap between EBITDA and operating profit is depreciation, which remains significant for a capital-intensive oil and gas business.
Margin expansion on modest revenue growth may point to lower unit costs or favourable pricing. The release provides average realised prices: US oil at USD 85.93/bbl, international at USD 85.80/bbl, which is 100% of average WTI and 94% of Brent. US natural gas realised at USD 1.61/Mcf, or 54% of NYMEX.
Net profit by quarter
| Period | Measure | bn USD |
|---|---|---|
| Q4 2024 | Net profit | −0.12 |
| Q1 2025 | Net profit | 0.945 |
| Q2 2025 | Net profit | 0.468 |
| Q3 2025 | Net profit | 0.842 |
| Q4 2025 | Net profit | 0.114 |
| Q1 2026 | Net profit | 3.359 |
| Q2 2026 | Net profit | 2.996 |
| Q3 2026 | Net profit | 1.821 |
Net profit grew 116.3% – faster than both revenue and EBITDA
Net profit for the third quarter of 2026 was USD 1.82 bn, 116.3% above the third quarter of 2025. The net margin rose to 27.7% from 15.3% a year earlier.
Profit growing faster than EBITDA is explained by lower interest expense: net debt fell from USD 30.1 bn to 18.4 bn over the year, reducing the debt burden on the financial result. In addition, the release notes that crude oil collar settlements negatively impacted operating cash flow before working capital by USD 94 mn – a one-off factor that does not recur every quarter.
Profit over the last twelve months was USD 8.29 bn, which at a market capitalisation of USD 55.7 bn gives a P/E of 6.7. That is a low multiple, but it reflects the cyclicality of the industry and dependence on oil prices.
Net debt
at each reporting date, current net debt / EBITDA (LTM) = 1.02
| Period | Measure | bn USD |
|---|---|---|
| Q4 2024 | Net debt | 25.452 |
| Q1 2025 | Net debt | 32.721 |
| Q2 2025 | Net debt | 31.22 |
| Q3 2025 | Net debt | 30.141 |
| Q4 2025 | Net debt | 19.61 |
| Q1 2026 | Net debt | 22.479 |
| Q2 2026 | Net debt | 20.138 |
| Q3 2026 | Net debt | 18.413 |
Free cash flow for the quarter was USD 2.35 bn on capex of USD 1.32 bn
Operating cash flow for the third quarter of 2026 was USD 3.67 bn, capital expenditures – USD 1.32 bn. Free cash flow therefore amounted to USD 2.35 bn, covering dividend payments and debt reduction.
Over the last twelve months operating cash flow was USD 12.69 bn, which with capex for the same period (sum of four quarters – about USD 5.2 bn) leaves significant free cash flow. This allows the company to pay dividends and reduce debt simultaneously.
The release states that average diluted shares outstanding for the third quarter were 1,012.8 mn. With quarterly free cash flow of USD 2.35 bn, free cash flow per share is about USD 2.3 per quarter.
Valuation vs its own history
now vs the 3-year average
| Period | Measure | × |
|---|---|---|
| EV/EBITDA | Now | 4.7921555475579 |
| EV/EBITDA | 3-year average | 7.732212203765677 |
Net debt fell from USD 30.1 bn on 30 September 2025 to USD 18.4 bn on 30 September 2026
Net debt as of 30 September 2026 was USD 18.4 bn, down from USD 30.1 bn on 30 September 2025 – a reduction of USD 11.7 bn over the year. Over the quarter debt decreased from USD 20.1 bn on 30 June 2026 to USD 18.4 bn on 30 September 2026, i.e. by USD 1.7 bn.
The ratio of net debt to EBITDA over the last twelve months is 1.02. This is a moderate level for an oil and gas company, leaving room for manoeuvre if oil prices decline. The direction of change in the ratio is not disclosed, so only the level can be discussed.
Debt reduction is supported by strong operating cash flow. If current oil prices persist, the company can continue to reduce debt, which will lower interest expense and support profit.
Share price, three years
close, last point 2026-11-09
| Period | Measure | USD per share |
|---|---|---|
| 2025-11-10 | Closing price | 41.79999923706055 |
| 2025-11-11 | Closing price | 41.849998474121094 |
| 2025-11-12 | Closing price | 41.93000030517578 |
| 2025-11-13 | Closing price | 42.02000045776367 |
| 2025-11-14 | Closing price | 42.7599983215332 |
| 2025-11-17 | Closing price | 41.689998626708984 |
| 2025-11-18 | Closing price | 42.52000045776367 |
| 2025-11-19 | Closing price | 41.45000076293945 |
| 2025-11-20 | Closing price | 41.209999084472656 |
| 2025-11-21 | Closing price | 41.439998626708984 |
| 2025-11-24 | Closing price | 41.43000030517578 |
| 2025-11-25 | Closing price | 41.40999984741211 |
| 2025-11-26 | Closing price | 41.41999816894531 |
| 2025-11-28 | Closing price | 42.0 |
| 2025-12-01 | Closing price | 42.34000015258789 |
| 2025-12-02 | Closing price | 41.97999954223633 |
| 2025-12-03 | Closing price | 42.45000076293945 |
| 2025-12-04 | Closing price | 42.66999816894531 |
| 2025-12-05 | Closing price | 42.43000030517578 |
| 2025-12-08 | Closing price | 41.36000061035156 |
| 2025-12-09 | Closing price | 41.54999923706055 |
| 2025-12-10 | Closing price | 41.75 |
| 2025-12-11 | Closing price | 41.20000076293945 |
| 2025-12-12 | Closing price | 41.06999969482422 |
| 2025-12-15 | Closing price | 40.189998626708984 |
| 2025-12-16 | Closing price | 38.91999816894531 |
| 2025-12-17 | Closing price | 40.630001068115234 |
| 2025-12-18 | Closing price | 39.72999954223633 |
| 2025-12-19 | Closing price | 39.619998931884766 |
| 2025-12-22 | Closing price | 40.27000045776367 |
| 2025-12-23 | Closing price | 40.099998474121094 |
| 2025-12-24 | Closing price | 40.0 |
| 2025-12-26 | Closing price | 39.849998474121094 |
| 2025-12-29 | Closing price | 40.40999984741211 |
| 2025-12-30 | Closing price | 41.459999084472656 |
| 2025-12-31 | Closing price | 41.119998931884766 |
| 2026-01-02 | Closing price | 42.380001068115234 |
| 2026-01-05 | Closing price | 41.22999954223633 |
| 2026-01-06 | Closing price | 41.7400016784668 |
| 2026-01-07 | Closing price | 40.9900016784668 |
| 2026-01-08 | Closing price | 43.22999954223633 |
| 2026-01-09 | Closing price | 42.86000061035156 |
| 2026-01-12 | Closing price | 42.720001220703125 |
| 2026-01-13 | Closing price | 43.310001373291016 |
| 2026-01-14 | Closing price | 44.31999969482422 |
| 2026-01-15 | Closing price | 43.16999816894531 |
| 2026-01-16 | Closing price | 42.70000076293945 |
| 2026-01-20 | Closing price | 42.2400016784668 |
| 2026-01-21 | Closing price | 43.5099983215332 |
| 2026-01-22 | Closing price | 43.150001525878906 |
| 2026-01-23 | Closing price | 44.099998474121094 |
| 2026-01-26 | Closing price | 43.91999816894531 |
| 2026-01-27 | Closing price | 44.54999923706055 |
| 2026-01-28 | Closing price | 44.83000183105469 |
| 2026-01-29 | Closing price | 45.41999816894531 |
| 2026-01-30 | Closing price | 45.38999938964844 |
| 2026-02-02 | Closing price | 43.79999923706055 |
| 2026-02-03 | Closing price | 45.2599983215332 |
| 2026-02-04 | Closing price | 46.689998626708984 |
| 2026-02-05 | Closing price | 45.09000015258789 |
| 2026-02-06 | Closing price | 46.310001373291016 |
| 2026-02-09 | Closing price | 46.65999984741211 |
| 2026-02-10 | Closing price | 46.27000045776367 |
| 2026-02-11 | Closing price | 47.2400016784668 |
| 2026-02-12 | Closing price | 45.4900016784668 |
| 2026-02-13 | Closing price | 46.06999969482422 |
| 2026-02-17 | Closing price | 45.939998626708984 |
| 2026-02-18 | Closing price | 47.11000061035156 |
| 2026-02-19 | Closing price | 51.529998779296875 |
| 2026-02-20 | Closing price | 51.84000015258789 |
| 2026-02-23 | Closing price | 52.43000030517578 |
| 2026-02-24 | Closing price | 51.95000076293945 |
| 2026-02-25 | Closing price | 50.939998626708984 |
| 2026-02-26 | Closing price | 51.43000030517578 |
| 2026-02-27 | Closing price | 53.08000183105469 |
| 2026-03-02 | Closing price | 54.209999084472656 |
| 2026-03-03 | Closing price | 53.68000030517578 |
| 2026-03-04 | Closing price | 53.61000061035156 |
| 2026-03-05 | Closing price | 53.2400016784668 |
| 2026-03-06 | Closing price | 54.189998626708984 |
| 2026-03-09 | Closing price | 55.02000045776367 |
| 2026-03-10 | Closing price | 53.119998931884766 |
| 2026-03-11 | Closing price | 55.58000183105469 |
| 2026-03-12 | Closing price | 58.40999984741211 |
| 2026-03-13 | Closing price | 57.880001068115234 |
| 2026-03-16 | Closing price | 57.25 |
| 2026-03-17 | Closing price | 57.72999954223633 |
| 2026-03-18 | Closing price | 58.380001068115234 |
| 2026-03-19 | Closing price | 59.58000183105469 |
| 2026-03-20 | Closing price | 60.709999084472656 |
| 2026-03-23 | Closing price | 60.310001373291016 |
| 2026-03-24 | Closing price | 61.25 |
| 2026-03-25 | Closing price | 61.849998474121094 |
| 2026-03-26 | Closing price | 64.36000061035156 |
| 2026-03-27 | Closing price | 65.31999969482422 |
| 2026-03-30 | Closing price | 66.23999786376953 |
| 2026-03-31 | Closing price | 65.0 |
| 2026-04-01 | Closing price | 62.22999954223633 |
| 2026-04-02 | Closing price | 62.970001220703125 |
| 2026-04-06 | Closing price | 62.959999084472656 |
| 2026-04-07 | Closing price | 62.939998626708984 |
| 2026-04-08 | Closing price | 59.77000045776367 |
| 2026-04-09 | Closing price | 58.529998779296875 |
| 2026-04-10 | Closing price | 57.970001220703125 |
| 2026-04-13 | Closing price | 58.060001373291016 |
| 2026-04-14 | Closing price | 55.380001068115234 |
| 2026-04-15 | Closing price | 55.83000183105469 |
| 2026-04-16 | Closing price | 56.869998931884766 |
| 2026-04-17 | Closing price | 53.790000915527344 |
| 2026-04-20 | Closing price | 54.47999954223633 |
| 2026-04-21 | Closing price | 56.33000183105469 |
| 2026-04-22 | Closing price | 57.04999923706055 |
| 2026-04-23 | Closing price | 57.83000183105469 |
| 2026-04-24 | Closing price | 57.119998931884766 |
| 2026-04-27 | Closing price | 57.27000045776367 |
| 2026-04-28 | Closing price | 58.61000061035156 |
| 2026-04-29 | Closing price | 60.7599983215332 |
| 2026-04-30 | Closing price | 60.58000183105469 |
| 2026-05-01 | Closing price | 58.709999084472656 |
| 2026-05-04 | Closing price | 60.27000045776367 |
| 2026-05-05 | Closing price | 59.34000015258789 |
| 2026-05-06 | Closing price | 55.119998931884766 |
| 2026-05-07 | Closing price | 53.939998626708984 |
| 2026-05-08 | Closing price | 53.029998779296875 |
| 2026-05-11 | Closing price | 55.13999938964844 |
| 2026-05-12 | Closing price | 56.27000045776367 |
| 2026-05-13 | Closing price | 56.18000030517578 |
| 2026-05-14 | Closing price | 56.84000015258789 |
| 2026-05-15 | Closing price | 59.619998931884766 |
| 2026-05-18 | Closing price | 59.70000076293945 |
| 2026-05-19 | Closing price | 60.70000076293945 |
| 2026-05-20 | Closing price | 58.869998931884766 |
| 2026-05-21 | Closing price | 58.83000183105469 |
| 2026-05-22 | Closing price | 58.810001373291016 |
| 2026-05-26 | Closing price | 57.459999084472656 |
| 2026-05-27 | Closing price | 56.88999938964844 |
| 2026-05-28 | Closing price | 57.31999969482422 |
| 2026-05-29 | Closing price | 56.630001068115234 |
| 2026-06-01 | Closing price | 58.91999816894531 |
| 2026-06-02 | Closing price | 59.09000015258789 |
| 2026-06-03 | Closing price | 59.63999938964844 |
| 2026-06-04 | Closing price | 58.66999816894531 |
| 2026-06-05 | Closing price | 56.93000030517578 |
| 2026-06-08 | Closing price | 57.47999954223633 |
| 2026-06-09 | Closing price | 56.54999923706055 |
| 2026-06-10 | Closing price | 57.099998474121094 |
| 2026-06-11 | Closing price | 55.470001220703125 |
| 2026-06-12 | Closing price | 56.540000915527344 |
| 2026-06-15 | Closing price | 54.459999084472656 |
| 2026-06-16 | Closing price | 53.66999816894531 |
| 2026-06-17 | Closing price | 53.040000915527344 |
| 2026-06-18 | Closing price | 51.81999969482422 |
| 2026-06-22 | Closing price | 52.0 |
| 2026-06-23 | Closing price | 52.22999954223633 |
| 2026-06-24 | Closing price | 51.09000015258789 |
| 2026-06-25 | Closing price | 51.209999084472656 |
| 2026-06-26 | Closing price | 49.9900016784668 |
| 2026-06-29 | Closing price | 49.09000015258789 |
| 2026-06-30 | Closing price | 48.56999969482422 |
| 2026-07-01 | Closing price | 47.939998626708984 |
| 2026-07-02 | Closing price | 48.90999984741211 |
| 2026-07-06 | Closing price | 48.810001373291016 |
| 2026-07-07 | Closing price | 51.68000030517578 |
| 2026-07-08 | Closing price | 53.59000015258789 |
| 2026-07-09 | Closing price | 52.29999923706055 |
| 2026-07-10 | Closing price | 52.88999938964844 |
| 2026-07-13 | Closing price | 54.810001373291016 |
| 2026-07-14 | Closing price | 54.56999969482422 |
| 2026-07-15 | Closing price | 53.77000045776367 |
| 2026-07-16 | Closing price | 53.650001525878906 |
| 2026-07-17 | Closing price | 54.86000061035156 |
| 2026-07-20 | Closing price | 55.189998626708984 |
| 2026-07-21 | Closing price | 56.5 |
| 2026-07-22 | Closing price | 57.5 |
| 2026-07-23 | Closing price | 57.599998474121094 |
| 2026-07-24 | Closing price | 57.29999923706055 |
| 2026-07-27 | Closing price | 54.93000030517578 |
| 2026-07-28 | Closing price | 53.93000030517578 |
| 2026-07-29 | Closing price | 56.029998779296875 |
| 2026-07-30 | Closing price | 55.95000076293945 |
| 2026-07-31 | Closing price | 57.06999969482422 |
| 2026-08-03 | Closing price | 55.470001220703125 |
| 2026-08-04 | Closing price | 55.09000015258789 |
| 2026-08-05 | Closing price | 53.810001373291016 |
| 2026-08-06 | Closing price | 56.040000915527344 |
| 2026-08-07 | Closing price | 55.90999984741211 |
| 2026-08-10 | Closing price | 58.650001525878906 |
| 2026-08-11 | Closing price | 59.060001373291016 |
| 2026-08-12 | Closing price | 58.54999923706055 |
| 2026-08-13 | Closing price | 57.70000076293945 |
| 2026-08-14 | Closing price | 58.36000061035156 |
| 2026-08-17 | Closing price | 59.040000915527344 |
| 2026-08-18 | Closing price | 59.79999923706055 |
| 2026-08-19 | Closing price | 60.09000015258789 |
| 2026-08-20 | Closing price | 61.52000045776367 |
| 2026-08-21 | Closing price | 61.29999923706055 |
| 2026-08-24 | Closing price | 60.11000061035156 |
| 2026-08-25 | Closing price | 58.40999984741211 |
| 2026-08-26 | Closing price | 58.619998931884766 |
| 2026-08-27 | Closing price | 59.16999816894531 |
| 2026-08-28 | Closing price | 59.099998474121094 |
| 2026-08-31 | Closing price | 60.18000030517578 |
| 2026-09-01 | Closing price | 60.95000076293945 |
| 2026-09-02 | Closing price | 60.90999984741211 |
| 2026-09-03 | Closing price | 60.61000061035156 |
| 2026-09-04 | Closing price | 60.040000915527344 |
| 2026-09-08 | Closing price | 60.650001525878906 |
| 2026-09-09 | Closing price | 61.29999923706055 |
| 2026-09-10 | Closing price | 61.15999984741211 |
| 2026-09-11 | Closing price | 61.459999084472656 |
| 2026-09-14 | Closing price | 61.779998779296875 |
| 2026-09-15 | Closing price | 63.52000045776367 |
| 2026-09-16 | Closing price | 59.36000061035156 |
| 2026-09-17 | Closing price | 59.290000915527344 |
| 2026-09-18 | Closing price | 58.84000015258789 |
| 2026-09-21 | Closing price | 57.25 |
| 2026-09-22 | Closing price | 56.310001373291016 |
| 2026-09-23 | Closing price | 57.36000061035156 |
| 2026-09-24 | Closing price | 58.04999923706055 |
| 2026-09-25 | Closing price | 56.86000061035156 |
| 2026-09-28 | Closing price | 56.099998474121094 |
| 2026-09-29 | Closing price | 54.939998626708984 |
| 2026-09-30 | Closing price | 55.31999969482422 |
| 2026-10-01 | Closing price | 57.84000015258789 |
| 2026-10-02 | Closing price | 58.08000183105469 |
| 2026-10-05 | Closing price | 58.310001373291016 |
| 2026-10-06 | Closing price | 58.33000183105469 |
| 2026-10-07 | Closing price | 58.209999084472656 |
| 2026-10-08 | Closing price | 60.279998779296875 |
| 2026-10-09 | Closing price | 60.11000061035156 |
| 2026-10-12 | Closing price | 61.130001068115234 |
| 2026-10-13 | Closing price | 61.650001525878906 |
| 2026-10-14 | Closing price | 61.40999984741211 |
| 2026-10-15 | Closing price | 60.66999816894531 |
| 2026-10-16 | Closing price | 62.380001068115234 |
| 2026-10-19 | Closing price | 62.720001220703125 |
| 2026-10-20 | Closing price | 62.91999816894531 |
| 2026-10-21 | Closing price | 62.70000076293945 |
| 2026-10-22 | Closing price | 62.5 |
| 2026-10-23 | Closing price | 64.16999816894531 |
| 2026-10-26 | Closing price | 64.06999969482422 |
| 2026-10-27 | Closing price | 62.72999954223633 |
| 2026-10-28 | Closing price | 62.86000061035156 |
| 2026-10-29 | Closing price | 63.0099983215332 |
| 2026-10-30 | Closing price | 64.0 |
| 2026-11-02 | Closing price | 60.720001220703125 |
| 2026-11-03 | Closing price | 60.43000030517578 |
| 2026-11-04 | Closing price | 57.33000183105469 |
| 2026-11-05 | Closing price | 56.36000061035156 |
| 2026-11-06 | Closing price | 56.380001068115234 |
| 2026-11-09 | Closing price | 55.7599983215332 |
The 1.87% dividend yield is modest, but the payout is covered by profit
The dividend yield over the last twelve months is 1.87%. This is a modest level, explained by the cyclicality of the industry and the priority of debt reduction. The company did not disclose the size of the last paid dividend or the year for which it was paid in the provided excerpt from the release.
Our estimate of the dividend for 2026 is based on the current yield and profit over the last twelve months. With net profit of USD 8.29 bn and a market capitalisation of USD 55.7 bn, the payout ratio is about 12.5%, leaving significant room for payments even if profit declines.
The 1.87% yield is below the key rate, but for an oil and gas company this is offset by capital appreciation potential and debt reduction. The dividend could be cut if oil prices fall below USD 60/bbl or capex rises substantially.
EV/EBITDA of 4.8 is 38% below its own three-year average of 7.7
EV/EBITDA over the last twelve months is 4.8, 38% below its own three-year average of 7.7. The share trades cheaper than historically, which may indicate undervaluation relative to its own past.
P/E over the last twelve months is 6.7, also low. Return on equity (ROE) is 17.2%, indicating efficient use of capital.
The decline in multiples relative to history may be linked to market concerns about oil price sustainability and industry cyclicality. However, strong cash flow and debt reduction support fundamental value.
Valuation on the latest reported figures
| Metric | Value |
|---|---|
| Market cap | 55.7 bn USD |
| P/E (LTM) | 6.7 |
| EV/EBITDA (LTM) | 4.8 |
| P/B | 1.52 |
| Net debt / EBITDA (LTM) | 1.02 |
| Operating cash flow (LTM) | 12.7 bn |
| ROE | 17.2% |
| Dividend yield (12m) | 1.9% |
| EV/EBITDA, 3-year average | 7.7 |
Bottom line
The strong points of the report were profit more than doubling and net debt falling by USD 11.7 bn over the year. However, revenue growth decelerated from the second quarter, and the dividend yield remains modest. The key question for a holder is the sustainability of oil prices and the company's ability to maintain cash flow at current levels. With an EV/EBITDA of 4.8 against its own three-year average of 7.7, the share looks attractive, but materialisation of oil-related risks could change the picture.